USD/HUF: Up 0.32% to 313.25 — Price Holds Above SMA-20
MarketsFN Team
USD/HUF: Up 0.32% to 313.25 — Price Holds Above SMA-20
Published: September 08, 2026 · MarketsFN Team · US Session · Emerging FX
| Pair | Rate | Change | RSI(14) | SMA-20 | SMA-50 | 52W High | 52W Low | Pivot | R1 | S1 |
|---|---|---|---|---|---|---|---|---|---|---|
| USD/HUF | 313.25 | +0.32% | 44.3 | 313.09 | 313.77 | 343.74 | 300.33 | 312.09 | 313.83 | 309.90 |
S/R Support & Resistance Levels
Dynamic Trendlines
| Level | Type | Direction | Distance |
|---|---|---|---|
| 305.96 | 20d Support | down (descending) | -2.33% / 728.4 pips |
| 321.67 | 20d Resistance | up (ascending) | +2.69% / 841.9 pips |
| 308.11 | 50d Support | flat (flat) | -1.64% / 513.6 pips |
| 320.96 | 50d Resistance | flat (flat) | +2.46% / 771.4 pips |
Static Levels
| Level | Type | Touches | Distance |
|---|---|---|---|
| 332.94 | Resistance | 2x | +6.69% / 2087.9 pips |
| 320.96 | Resistance | 2x | +2.85% / 889.9 pips |
| 315.15 | Resistance | 2x | +0.99% / 308.1 pips |
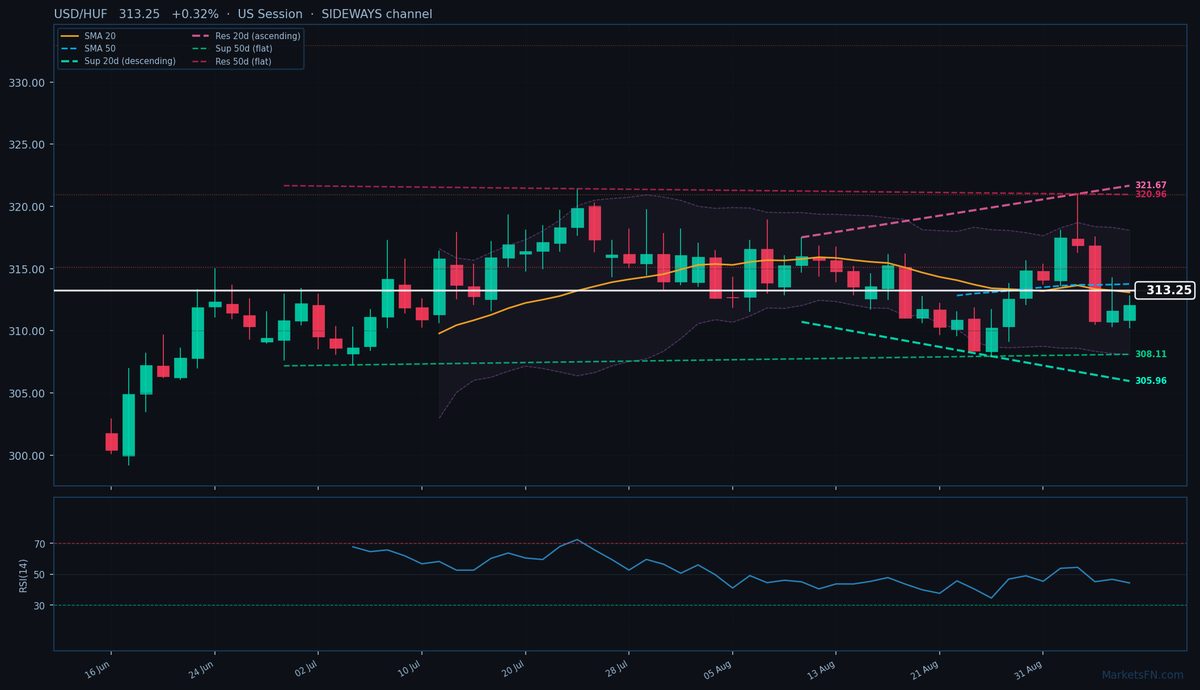
USD/HUF is trading at 313.25 (+0.32%), hovering just above its 20-day SMA (313.09) but below the 50-day SMA (313.77), signaling a consolidation phase within a broader sideways trend. The pair remains trapped between dynamic support and resistance trendlines, with the 20-day descending support at 305.96 (728.4 pips below) and the 20-day ascending resistance at 321.67 (841.9 pips above). The 50-day channel is flat, reinforcing the lack of directional conviction, with support at 308.11 (513.6 pips below) and resistance at 320.96 (771.4 pips above).
Static levels show immediate resistance at R1 (313.83, 58 pips above) and support at S1 (309.90, 335 pips below), with R2 (315.15) looming as the next key hurdle if bullish momentum builds. The RSI at 44.3 is neutral, offering no clear bias, while the ATR of 3.66 suggests subdued volatility.
Short-term, the pair’s inability to decisively break above the 20-day SMA or challenge the 50-day SMA suggests range-bound trading will persist. A close above 313.83 (R1) could test 315.15, while failure to hold 312.09 (pivot) may see a retest of 309.90 (S1). The sideways 50-day channel implies any breakout attempt lacks conviction without a fundamental catalyst. Watch for a sustained move beyond 313.77 (50-day SMA) or below 312.09 to confirm directional bias.
Disclaimer
The content on MarketsFN.com is provided for educational and informational purposes only and does not constitute financial advice. All investments involve risk and past performance does not guarantee future results.