USD/HUF: Up 0.16% to 312.13 — Bearish — Below Key MAs
MarketsFN Team
USD/HUF: Up 0.16% to 312.13 — Bearish — Below Key MAs
Published: September 07, 2026 · MarketsFN Team · US Session · Emerging FX
| Pair | Rate | Change | RSI(14) | SMA-20 | SMA-50 | 52W High | 52W Low | Pivot | R1 | S1 |
|---|---|---|---|---|---|---|---|---|---|---|
| USD/HUF | 312.13 | +0.16% | 46.7 | 313.25 | 313.72 | 343.74 | 300.33 | 312.93 | 315.34 | 308.32 |
S/R Support & Resistance Levels
Dynamic Trendlines
| Level | Type | Direction | Distance |
|---|---|---|---|
| 305.71 | 20d Support | down (descending) | -2.06% / 641.7 pips |
| 321.45 | 20d Resistance | up (ascending) | +2.99% / 931.9 pips |
| 308.09 | 50d Support | flat (flat) | -1.29% / 403.5 pips |
| 320.97 | 50d Resistance | flat (flat) | +2.83% / 884.8 pips |
Static Levels
| Level | Type | Touches | Distance |
|---|---|---|---|
| 344.84 | Resistance | 2x | +10.65% / 3320.2 pips |
| 332.94 | Resistance | 2x | +6.84% / 2130.6 pips |
| 315.15 | Resistance | 2x | +1.13% / 350.8 pips |
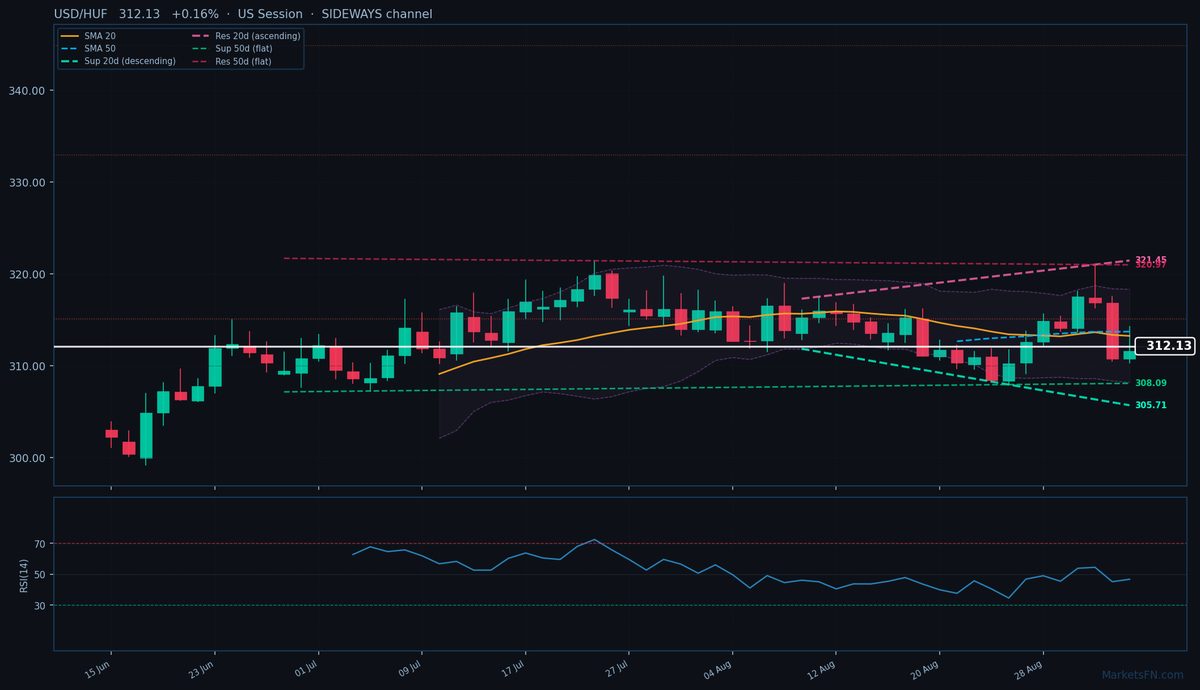
USD/HUF is trading at 312.13 (+0.16%), testing the lower bounds of its recent range as bearish momentum builds. The pair remains below both its 20-day (313.25) and 50-day (313.72) SMAs, confirming a short-term downtrend, though the 50-day trendline has flattened, suggesting indecision in the broader trend. Price action today has been contained within a 394-pip range (310.34–314.28), failing to challenge either dynamic trendline significantly. The 20-day channel is technically sideways but with a slight bearish tilt—support at 305.71 (descending, 641.7 pips below) and resistance at 321.45 (ascending, 931.9 pips above). The 50-day channel is more neutral, with support at 308.09 (flat, 403.5 pips below) and resistance at 320.97 (flat, 884.8 pips above).
Static levels highlight immediate hurdles: R1 at 315.34 (350.8 pips above) and S1 at 308.32 (380.1 pips below). The RSI at 46.7 shows no extreme momentum, leaving room for either continuation or reversal. With the ATR(14) at 3.74, today’s range is modest compared to recent volatility. The key test is whether the pair can hold above the psychological 310.00 level—a break could accelerate toward the 50-day dynamic support at 308.09. Conversely, a rebound above the SMAs would target R1 at 315.34. The European session’s close will be critical for directional conviction. Watch for a decisive break of the 310.34–314.28 day range to confirm next steps.
Disclaimer
The content on MarketsFN.com is provided for educational and informational purposes only and does not constitute financial advice. All investments involve risk and past performance does not guarantee future results.