NZD/USD: Down 0.30% to 0.5681 — Price Holds Above SMA-20
MarketsFN Team
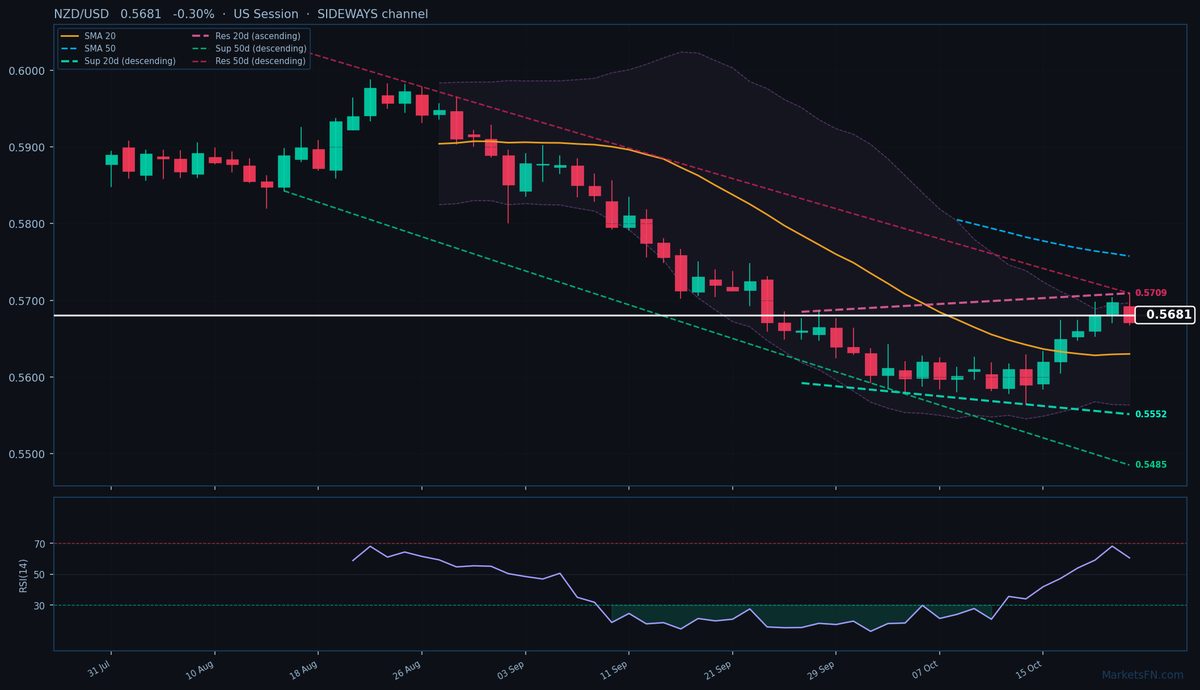
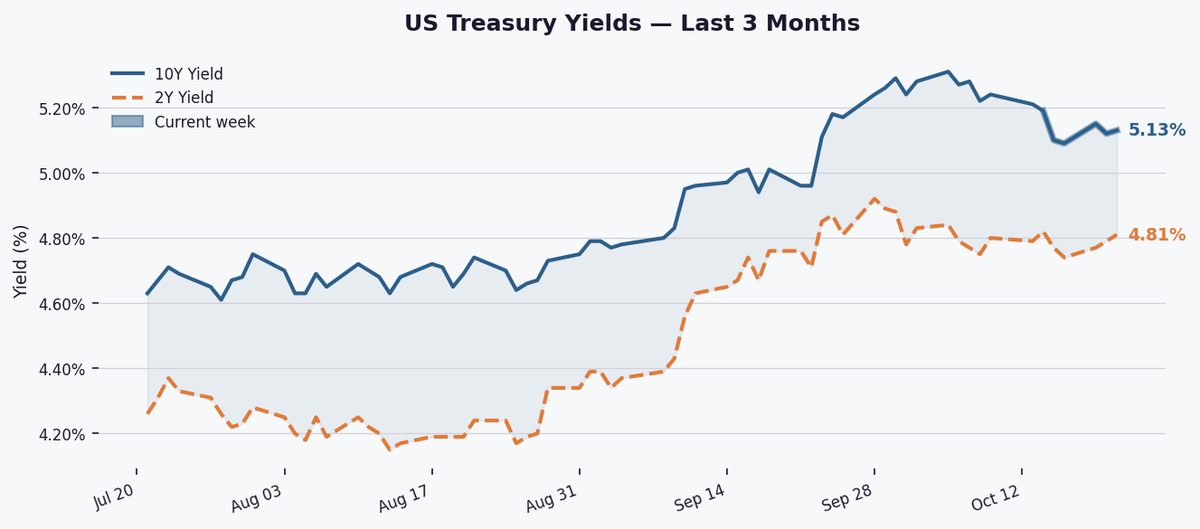
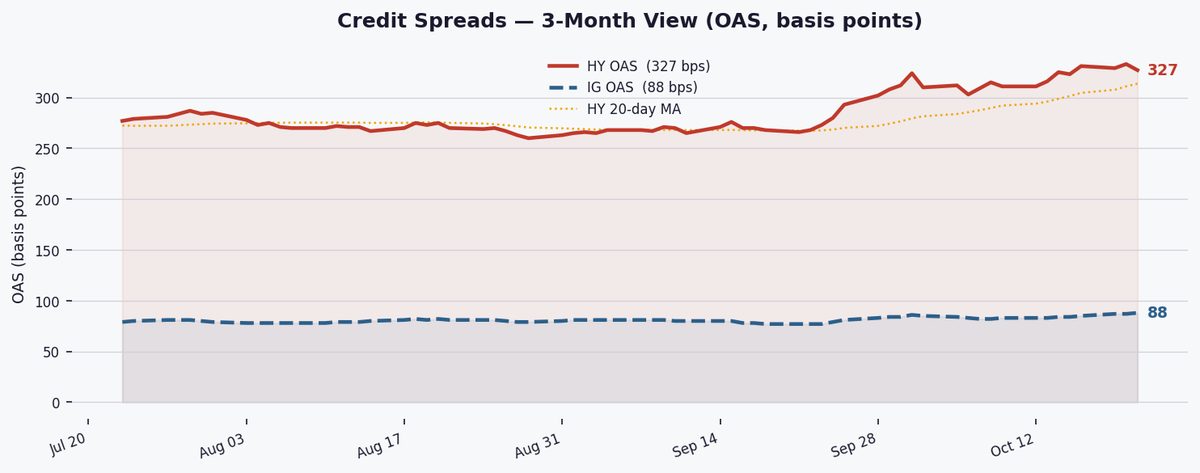
The NZD/USD's modest decline to 0.5681 reflects broader risk-off sentiment as the S&P 500 tumbles 94 points and Treasury yields retreat, though the pair's hold above its 20-day moving average suggests relative resilience. With the VIX jumping to 19.0, forex traders are closely watching whether the kiwi can maintain its technical footing against the dollar amid volatile global markets.
NZD/USD: Down 0.30% to 0.5681 — Price Holds Above SMA-20
Published: October 22, 2026 · MarketsFN Team · US Session
| Pair | Rate | Change | RSI(14) | SMA-20 | SMA-50 | 52W High | 52W Low | Pivot | R1 | S1 |
|---|---|---|---|---|---|---|---|---|---|---|
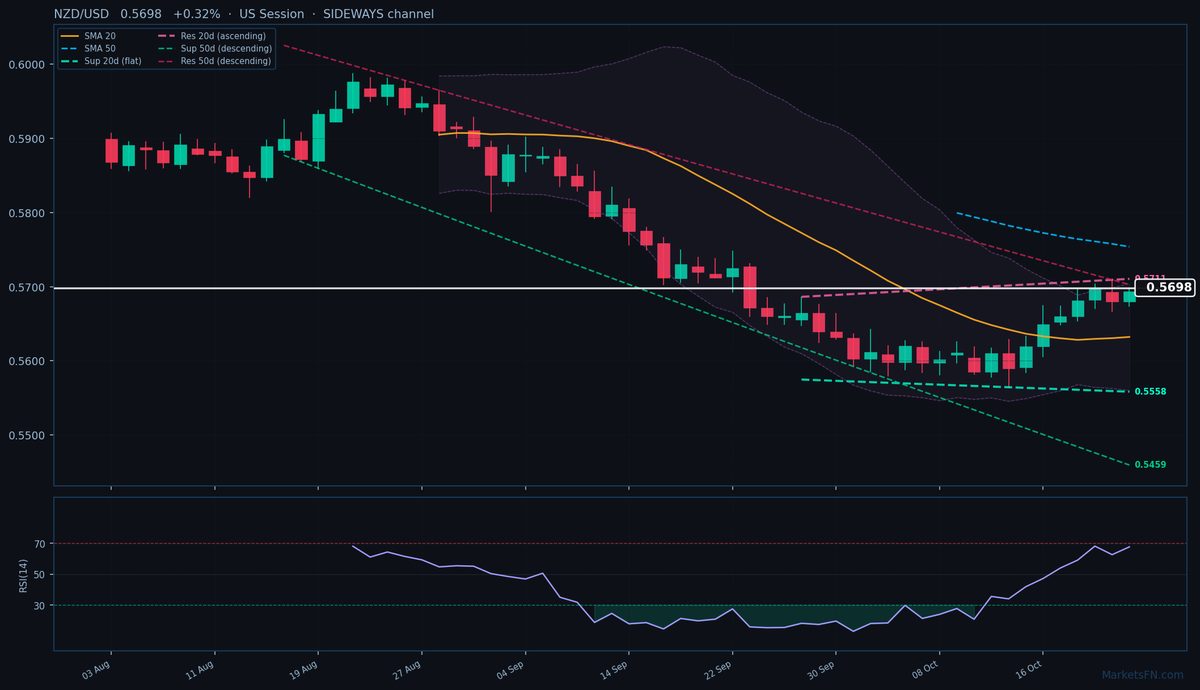
| NZD/USD | 0.5681 | -0.30% | 60.6 | 0.5630 | 0.5758 | 0.6075 | 0.5581 | 0.5691 | 0.5711 | 0.5678 |
📊 Support & Resistance Levels
Dynamic Trendlines
| Level | Type | Direction | Distance |
|---|---|---|---|
| 0.5552 | 20d Support | ↘ descending | -2.27% / 129.2 pips |
| 0.5709 | 20d Resistance | ↗ ascending | +0.50% / 28.4 pips |
| 0.5485 | 50d Support | ↘ descending | -3.44% / 195.5 pips |
| 0.5709 | 50d Resistance | ↘ descending | +0.50% / 28.5 pips |
NZD/USD is trading at 0.5681 (-0.30%), testing the lower bounds of a tightening consolidation phase as it struggles to reclaim the 20-day SMA (0.5630) while remaining capped by the 50-day SMA (0.5758). The pair is caught between conflicting trend signals: the 20-day dynamic channel is sideways, with immediate resistance at 0.5709 (just 28.4 pips above) and support at 0.5552 (129.2 pips below), while the 50-day channel remains decisively descending, with resistance converging at the same 0.5709 level. Static levels reinforce this compression, with S1 at 0.5678 (just 3 pips below current) and R1 at 0.5711 (30 pips above) — a 33-pip range that’s tighter than the 14-day ATR of 42 pips.
The RSI at 60.6 shows neutral momentum, but the repeated rejection near 0.5709 suggests bears are defending the descending 50-day resistance trendline. With the US session active and the pair failing to hold above the pivot (0.5691), the near-term bias leans bearish for a retest of S1 (0.5678) and potentially the 20-day SMA (0.5630). A break above 0.5709 could trigger a squeeze toward 0.5711, but the descending 50-day channel slope makes this a low-probability scenario. Watch for a close below 0.5678 to confirm downside momentum, with the next catalyst being US durable goods data tomorrow — a miss could accelerate the breakdown.
Disclaimer
The content on MarketsFN.com is provided for educational and informational purposes only and does not constitute financial advice. All investments involve risk and past performance does not guarantee future results.