USD/CHF: Down 0.22% to 0.8223 — Price Below SMA-20
MarketsFN Team
USD/CHF: Down 0.22% to 0.8223 — Price Below SMA-20
Published: October 22, 2026 · MarketsFN Team · US Session
| Pair | Rate | Change | RSI(14) | SMA-20 | SMA-50 | 52W High | 52W Low | Pivot | R1 | S1 |
|---|---|---|---|---|---|---|---|---|---|---|
| USD/CHF | 0.8223 | -0.22% | 43.2 | 0.8298 | 0.8191 | 0.8356 | 0.7609 | 0.8246 | 0.8257 | 0.8230 |
📊 Support & Resistance Levels
Dynamic Trendlines
| Level | Type | Direction | Distance |
|---|---|---|---|
| 0.8191 | 20d Support | ↘ descending | -0.38% / 31.6 pips |
| 0.8403 | 20d Resistance | → flat | +2.19% / 180.3 pips |
| 0.8191 | 50d Support | ↗ ascending | -0.39% / 31.7 pips |
| 0.8489 | 50d Resistance | ↗ ascending | +3.24% / 266.3 pips |
Static Levels
| Level | Type | Touches | Distance |
|---|---|---|---|
| 0.7924 | Support | 2× | -3.82% / 315.1 pips |
| 0.7904 | Support | 2× | -4.07% / 335.6 pips |
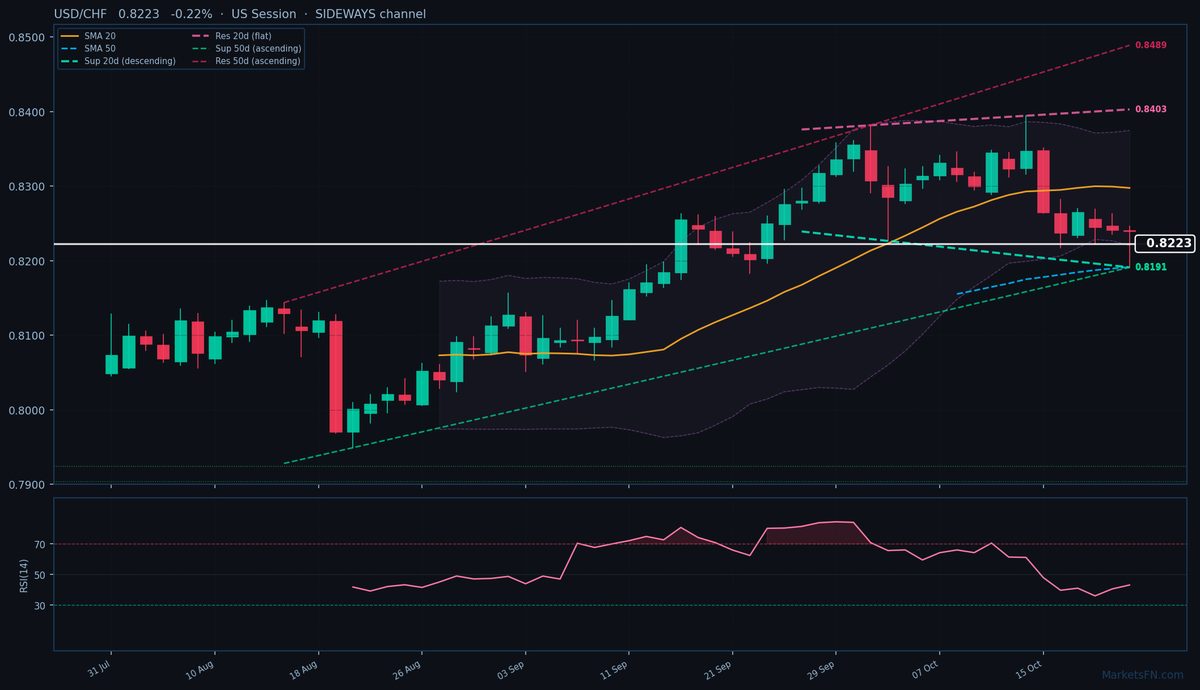
USD/CHF is trading at 0.8223 (-0.22%), testing the lower bounds of its recent consolidation phase as it oscillates between the SMA-50 support at 0.8191 (31.6 pips below) and the SMA-20 resistance at 0.8298 (75.5 pips above). This squeeze between moving averages reflects indecision, with the rate trapped in a sideways 20-day dynamic channel while the broader 50-day trend remains ascending. The immediate dynamic support at 0.8191 (descending, 31.6 pips away) is critical — a break here would confirm bearish momentum and open a path toward the static support cluster near 0.7904 (335.6 pips lower). Conversely, the nearest dynamic resistance at 0.8403 (flat, 180.3 pips away) remains distant, suggesting limited upside without a catalyst.
The RSI at 43.2 shows neutral momentum, neither oversold nor overbought, aligning with the pair’s range-bound action. Short-term pivots are tight, with S1 at 0.8230 (7 pips below) and R1 at 0.8257 (34 pips above), indicating compressed volatility. The 50-day ascending channel (support at 0.8191, resistance at 0.8489) still favors bulls structurally, but the failure to hold above the 20-day SMA signals weakening momentum. A decisive break below 0.8191 would invalidate the near-term bullish bias and likely trigger a test of the 50-day dynamic support. The next catalyst is the US session’s ability to defend the SMA-50 — failure here would accelerate downside toward the static support zone.
Disclaimer
The content on MarketsFN.com is provided for educational and informational purposes only and does not constitute financial advice. All investments involve risk and past performance does not guarantee future results.