USD/HUF: Down 0.26% to 316.93 — Ascending Channel
MarketsFN Team
USD/HUF: Down 0.26% to 316.93 — Ascending Channel
Published: September 15, 2026 · MarketsFN Team · US Session · Emerging FX
| Pair | Rate | Change | RSI(14) | SMA-20 | SMA-50 | 52W High | 52W Low | Pivot | R1 | S1 |
|---|---|---|---|---|---|---|---|---|---|---|
| USD/HUF | 316.93 | -0.26% | 67.4 | 312.94 | 314.18 | 343.74 | 300.33 | 313.59 | 314.81 | 311.99 |
S/R Support & Resistance Levels
Dynamic Trendlines
| Level | Type | Direction | Distance |
|---|---|---|---|
| 311.73 | 20d Support | up (ascending) | -1.64% / 520.2 pips |
| 324.23 | 20d Resistance | up (ascending) | +2.30% / 730.3 pips |
| 307.80 | 50d Support | flat (flat) | -2.88% / 913.0 pips |
| 320.89 | 50d Resistance | flat (flat) | +1.25% / 396.4 pips |
Static Levels
| Level | Type | Touches | Distance |
|---|---|---|---|
| 344.84 | Resistance | 2x | +8.52% / 2707.2 pips |
| 332.94 | Resistance | 2x | +4.78% / 1517.7 pips |
| 320.96 | Resistance | 2x | +1.01% / 319.7 pips |
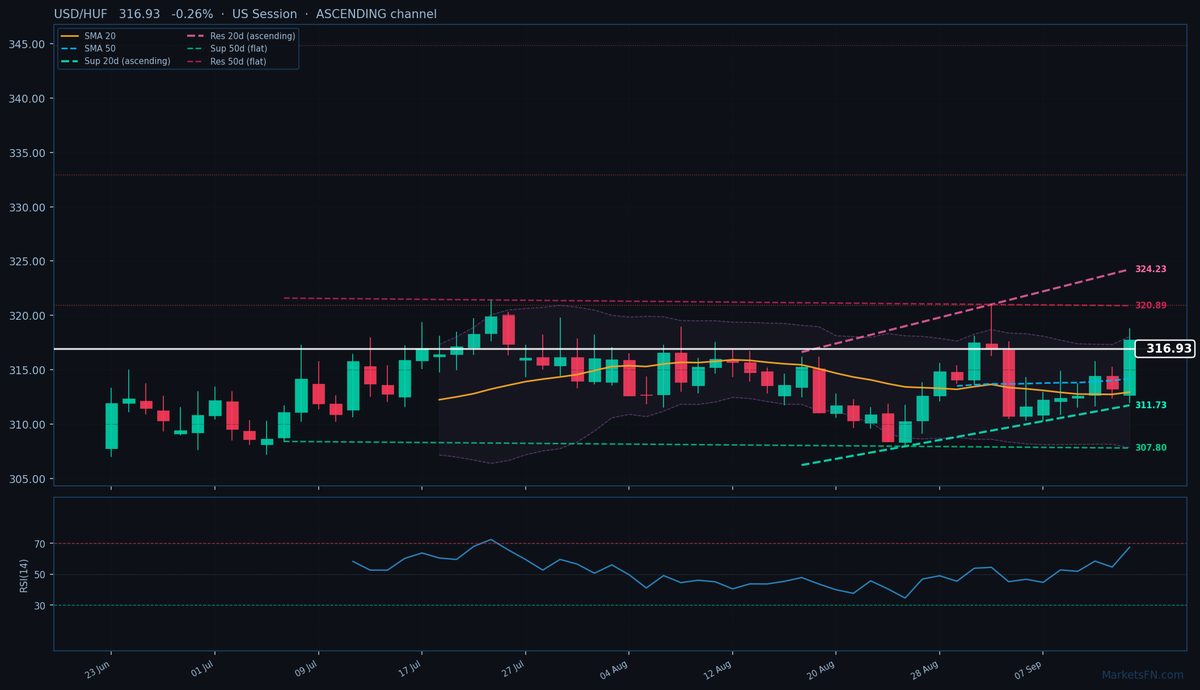
USD/HUF is trading at 316.93 (-0.26%), holding above both the 20-day (312.94) and 50-day (314.18) SMAs, confirming the short-term uptrend remains intact. The pair is currently testing the upper bounds of its 20-day ascending channel, with dynamic resistance at 324.23 (730.3 pips above) and dynamic support at 311.73 (520.2 pips below). The 50-day channel remains flat, suggesting potential consolidation ahead, with resistance at 320.89 (396.4 pips away) and support at 307.80 (913.0 pips below).
Static levels show immediate support at S1 (311.99, 494.0 pips below) and resistance at R1 (320.96, 403.0 pips above), both acting as key inflection points. The RSI at 67.4 is neutral but edging toward overbought territory, indicating the rally may need a breather before further upside.
Short-term, the pair remains bullish within the ascending 20-day channel, but traders should watch for rejection near 320.96 (R1 static resistance) given the RSI’s proximity to overbought levels. A break above 320.96 could target the 50-day dynamic resistance at 320.89, while failure to hold above the 20-day SMA (312.94) may signal a pullback toward 311.99 (S1). The next catalyst will be whether the pair can sustain momentum above the 20-day SMA or if profit-taking emerges near static resistance.
Disclaimer
The content on MarketsFN.com is provided for educational and informational purposes only and does not constitute financial advice. All investments involve risk and past performance does not guarantee future results.