USD/HUF: Down 0.16% to 311.89 — Ascending Channel
MarketsFN Team
USD/HUF: Down 0.16% to 311.89 — Ascending Channel
Published: September 09, 2026 · MarketsFN Team · US Session · Emerging FX
| Pair | Rate | Change | RSI(14) | SMA-20 | SMA-50 | 52W High | 52W Low | Pivot | R1 | S1 |
|---|---|---|---|---|---|---|---|---|---|---|
| USD/HUF | 311.89 | -0.16% | 51.6 | 312.76 | 313.81 | 343.74 | 300.33 | 312.72 | 314.52 | 310.59 |
S/R Support & Resistance Levels
Dynamic Trendlines
| Level | Type | Direction | Distance |
|---|---|---|---|
| 308.29 | 20d Support | flat (flat) | -1.15% / 359.8 pips |
| 322.56 | 20d Resistance | up (ascending) | +3.42% / 1067.4 pips |
| 308.15 | 50d Support | flat (flat) | -1.20% / 373.8 pips |
| 320.93 | 50d Resistance | flat (flat) | +2.90% / 904.9 pips |
Static Levels
| Level | Type | Touches | Distance |
|---|---|---|---|
| 332.94 | Resistance | 2x | +6.55% / 2046.2 pips |
| 320.96 | Resistance | 2x | +2.71% / 848.2 pips |
| 315.15 | Resistance | 2x | +0.85% / 266.4 pips |
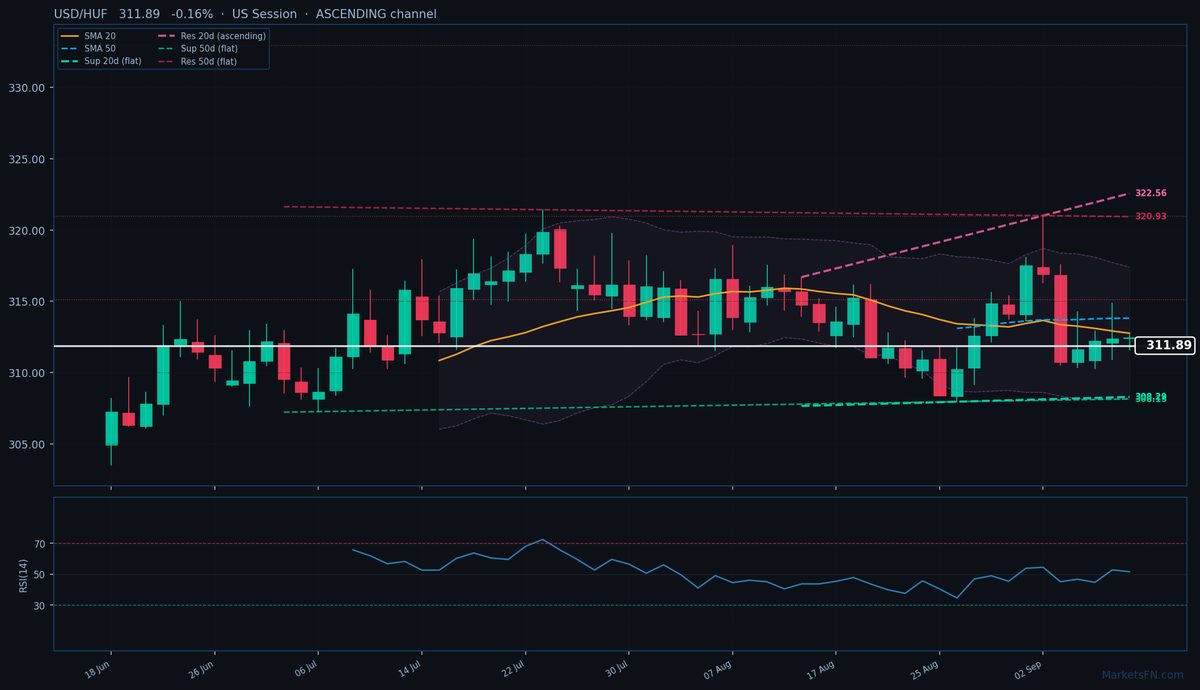
USD/HUF is trading at 311.89 (-0.16%), testing the lower bounds of its recent range as bearish momentum persists below both the SMA-20 (312.76) and SMA-50 (313.81). The rate remains in a technical downtrend, with the current price sitting 87 pips below the 20-day moving average and 192 pips under the 50-day SMA. The 20-day dynamic channel is ascending, but price action has failed to reclaim the mid-channel, leaving immediate resistance at 322.56 (+3.23%, 1067 pips away) while dynamic support holds at 308.29 (-1.34%, 360 pips below). The 50-day channel paints a more neutral picture, with resistance at 320.93 (+2.71%, 905 pips away) and support at 308.15 (-1.39%, 374 pips below).
Static levels show S1 at 310.59 (130 pips below current) as the nearest floor, while R1 at 314.52 (263 pips above) marks the first meaningful overhead supply zone. RSI at 51.6 confirms neutral momentum, though the failure to breach the SMAs suggests latent selling pressure. With ATR(14) at 3.51, today’s 104-pip range is well within normal volatility. The short-term outlook favors continued consolidation near 311-312 unless buyers can reclaim the SMA-20 cluster at 312.72-312.76. A break below S1 would target the dynamic support confluence near 308.15-308.29, while upside requires clearing R1 to challenge the descending SMAs. The European session’s tepid price action suggests hesitation ahead of potential catalyst-driven moves.
Disclaimer
The content on MarketsFN.com is provided for educational and informational purposes only and does not constitute financial advice. All investments involve risk and past performance does not guarantee future results.