AUD/USD: Down 0.10% to 0.7020 — Price Holds Above SMA-20
MarketsFN Team
AUD/USD: Down 0.10% to 0.7020 — Price Holds Above SMA-20
Published: October 22, 2026 · MarketsFN Team · US Session
| Pair | Rate | Change | RSI(14) | SMA-20 | SMA-50 | 52W High | 52W Low | Pivot | R1 | S1 |
|---|---|---|---|---|---|---|---|---|---|---|
| AUD/USD | 0.7020 | -0.10% | 59.3 | 0.6974 | 0.7074 | 0.7256 | 0.6438 | 0.7018 | 0.7044 | 0.7001 |
📊 Support & Resistance Levels
Dynamic Trendlines
| Level | Type | Direction | Distance |
|---|---|---|---|
| 0.6889 | 20d Support | → flat | -1.87% / 131.3 pips |
| 0.7036 | 20d Resistance | → flat | +0.23% / 15.9 pips |
| 0.6839 | 50d Support | ↘ descending | -2.58% / 180.8 pips |
| 0.7036 | 50d Resistance | ↘ descending | +0.23% / 15.9 pips |
Static Levels
| Level | Type | Touches | Distance |
|---|---|---|---|
| 0.6978 | Support | 2× | -0.49% / 34.1 pips |
| 0.6907 | Support | 2× | -1.50% / 105.5 pips |
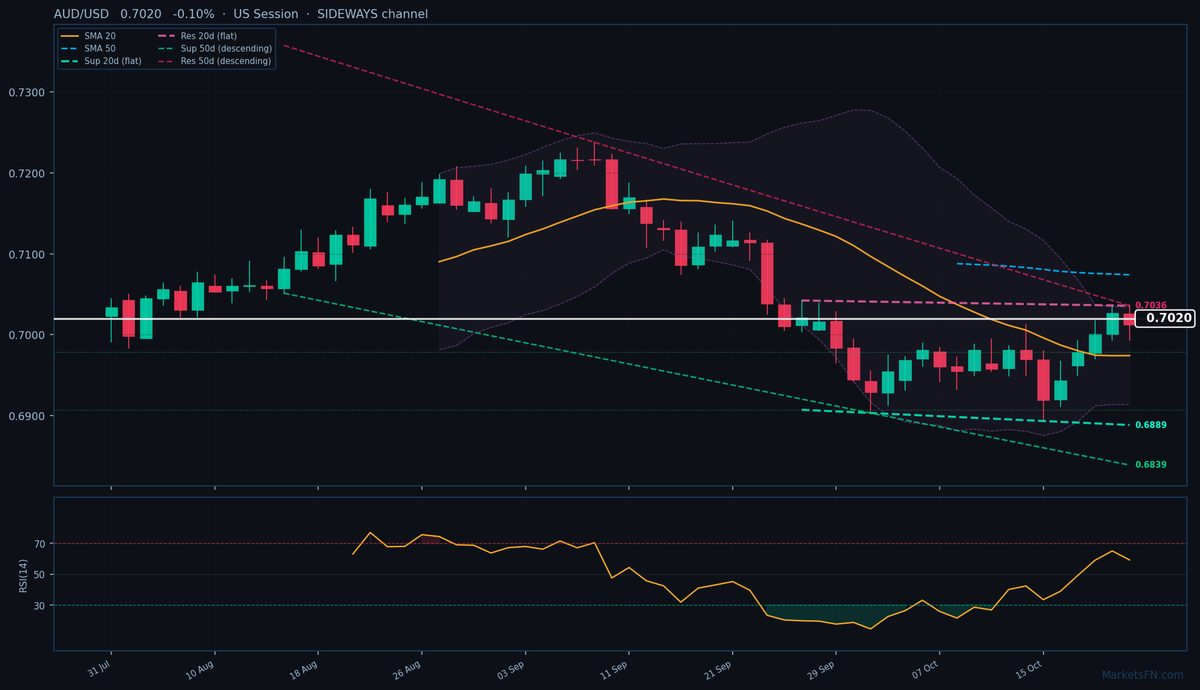
AUD/USD is trading at 0.7020 (-0.10%), hovering near the midpoint of its daily range (0.6993–0.7036) as the pair consolidates between its 20-day SMA (0.6974, support) and 50-day SMA (0.7074, resistance). This technical squeeze reflects indecision, with the RSI at 59.3 confirming neutral momentum. The 20-day dynamic channel is flat, offering no directional bias, but the 50-day channel remains descending — a bearish structural backdrop. Immediate resistance sits at the 20-day dynamic trendline (0.7036, +15.9 pips), coinciding with today’s high and the R1 pivot (0.7044). A break above this cluster could trigger short-covering toward the 50-day SMA.
Static support is layered below, starting with S1 at 0.7001 (-19 pips), then the more significant 0.6978 level (-34.1 pips), which has seen two prior touches. The 50-day dynamic support (0.6839, -180.8 pips) remains distant but underscores the broader downtrend. With ATR(14) at 47 pips, today’s range is muted — expect volatility to pick up near the 0.7036/0.7044 resistance zone.
Short-term, the pair is trapped between competing forces: the 20-day SMA’s buoyancy versus the 50-day channel’s downward slope. A close above 0.7044 would challenge the bearish structure, while failure at S1 (0.7001) opens a retest of 0.6978. Watch US session flows for a breakout catalyst — the 50-day SMA (0.7074) remains the bull case’s litmus test.
Disclaimer
The content on MarketsFN.com is provided for educational and informational purposes only and does not constitute financial advice. All investments involve risk and past performance does not guarantee future results.