MarketsFN
S&P 5005,963+0.54%
NASDAQ21,443+0.87%
DOW43,892+0.31%
DAX23,888+0.44%
FTSE 1008,721-0.12%
EUR/USD1.1465+0.07%
GBP/USD1.3220+0.14%
USD/JPY161.31-0.03%
Gold3,241+0.22%
WTI Oil76.40+0.81%
Bitcoin103,241+1.43%
10Y UST4.47%-9bp
S&P 5005,963+0.54%
NASDAQ21,443+0.87%
DOW43,892+0.31%
DAX23,888+0.44%
FTSE 1008,721-0.12%
EUR/USD1.1465+0.07%
GBP/USD1.3220+0.14%
USD/JPY161.31-0.03%
Gold3,241+0.22%
WTI Oil76.40+0.81%
Bitcoin103,241+1.43%
10Y UST4.47%-9bp
Economics

US jobless claims hold steady at 197,000, signaling labor market resilience

MarketsFN Data Team
•4 min read
US jobless claims hold steady at 197,000, signaling labor market resilience
Labour Market · Weekly Tracker

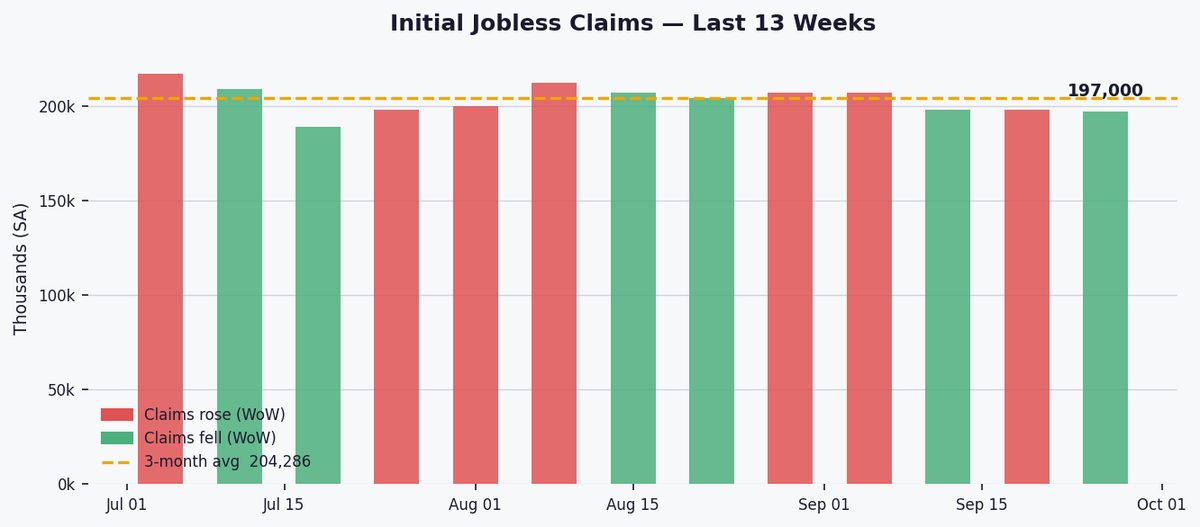
Initial jobless claims edged down slightly to 197,000 for the week ending September 26, a drop of 1,000 (0.5%) from the previous week, reflecting continued stability in the labor market.

The latest figure remains below the 3-month (204,286), 1-year (213,151), and 5-year averages (220,236), and sits comfortably within the 52-week range of 189,000 to 235,000, underscoring the labor market's sustained strength compared to longer-term trends.

The 4-week moving average dipped to 200,000, its lowest level in recent months, suggesting a gradual tightening in labor market conditions as the trend continues to hover near historic lows.

36-month trend chart
Fig. 2 — Initial claims (light blue) and 4-week moving average (red) over 36 months. Dashed lines mark 1-year and 3-year averages.

Continued claims fell by 11,000 to 1,701,000, indicating fewer workers are remaining on unemployment benefits, a sign that job seekers are finding employment relatively quickly amid steady demand for labor.

Key Statistics at a Glance

Latest (week ending)September 26, 2026
Initial claims197,000
WoW change▼ 1,000 (-0.5%)
4-week moving avg200,000
3-month avg204,286 (-3.6% vs current)
1-year avg213,151 (-7.6% vs current)
5-year avg220,236 (-10.6% vs current)
52-week high235,000
52-week low189,000
Continued claims1,701,000
Continued claims WoW-11,000 (-0.6%)
SignalStable
Data: Federal Reserve Bank of St. Louis (FRED) · Series: ICSA, IC4WSA, CCSA · Seasonally adjusted · Released every Thursday by the Bureau of Labor Statistics.
#US Economy#Jobless Claims#Labor Market#Unemployment#BLS#FRED#Federal Reserve#Initial Claims#Weekly Economic Data

Related Articles

HY spreads widen to 308 bps as credit stress builds amid rising yields
Economics

HY spreads widen to 308 bps as credit stress builds amid rising yields

MarketsFN Data Team
5 minOct 1, 2026
10-Year Yield Nears 52-Week High as Curve Steepens Further
Economics

10-Year Yield Nears 52-Week High as Curve Steepens Further

MarketsFN Data Team
4 minSep 29, 2026
Inflation Expectations Steady at 2.34%, Target Regime Holds
Economics

Inflation Expectations Steady at 2.34%, Target Regime Holds

MarketsFN Data Team
4 minSep 29, 2026