S&P 5005,963+0.54%
NASDAQ21,443+0.87%
DOW43,892+0.31%
DAX23,888+0.44%
FTSE 1008,721-0.12%
EUR/USD1.1465+0.07%
GBP/USD1.3220+0.14%
USD/JPY161.31-0.03%
Gold3,241+0.22%
WTI Oil76.40+0.81%
Bitcoin103,241+1.43%
10Y UST4.47%-9bp
S&P 5005,963+0.54%
NASDAQ21,443+0.87%
DOW43,892+0.31%
DAX23,888+0.44%
FTSE 1008,721-0.12%
EUR/USD1.1465+0.07%
GBP/USD1.3220+0.14%
USD/JPY161.31-0.03%
Gold3,241+0.22%
WTI Oil76.40+0.81%
Bitcoin103,241+1.43%
10Y UST4.47%-9bp
MarketsFN
Economics

Jobless Claims Rise to 225,000, Indicating Labor Market Cooling

MarketsFN Data Team
4 min read
Jobless Claims Rise to 225,000, Indicating Labor Market Cooling
Labour Market · Weekly Tracker

Jobless Claims Rise to 225,000, Indicating Labor Market Cooling

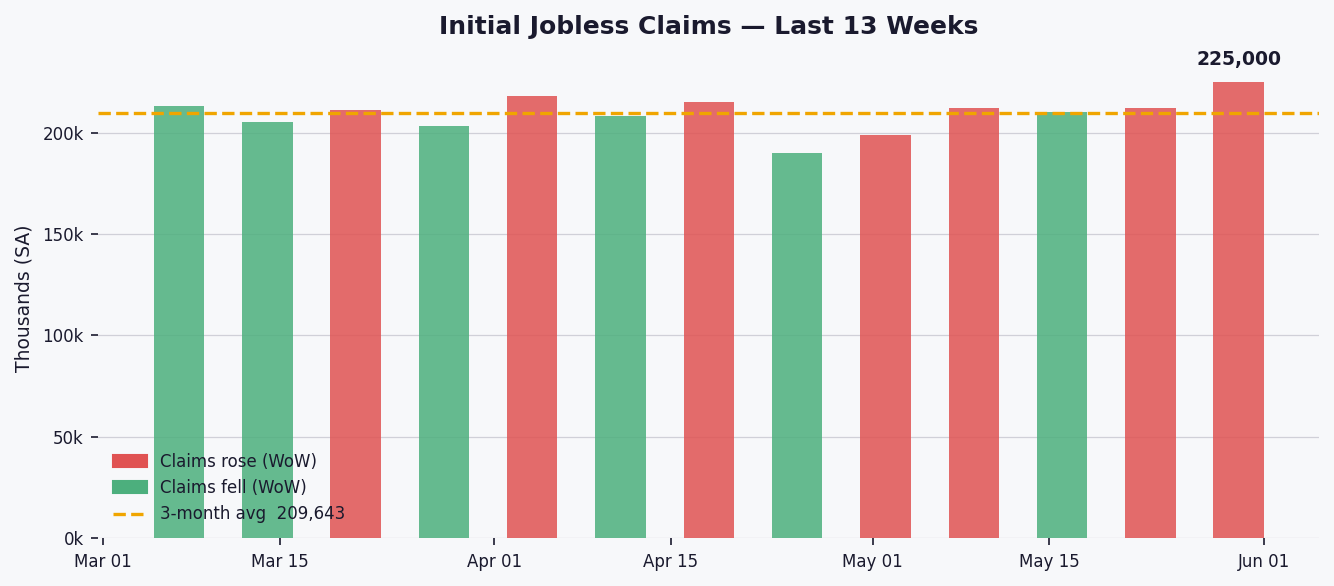
Initial jobless claims for the week ending May 30, 2026, increased by 13,000 to 225,000, reflecting a 6.1% rise from the previous week’s figure of 212,000.

This week’s claims are above the 3-month average of 209,643 and the 5-year average of 220,495, but slightly lower than the 1-year average of 220,925. The 52-week range shows a high of 259,000 and a low of 190,000, indicating fluctuations in the labor market.

3-month weekly claims chart
Fig. 1 — Weekly initial jobless claims, last 13 weeks. Red bars = claims rose WoW; green bars = claims fell WoW. Dashed line shows 3-month average.

The 4-week moving average stands at 214,750, suggesting a slight upward trend in jobless claims. This smoothed figure points to potential softening in the labor market, as it reflects recent increases in initial claims.

36-month trend chart
Fig. 2 — Initial claims (light blue) and 4-week moving average (red) over 36 months. Dashed lines mark 1-year and 3-year averages.

Continued claims have decreased by 8,000 to 1,777,000, suggesting that fewer workers are remaining on unemployment benefits. This decline may indicate a stabilization in the job market, as individuals are finding employment more quickly.

Key Statistics at a Glance

Latest (week ending)May 30, 2026
Initial claims225,000
WoW change▲ 13,000 (+6.1%)
4-week moving avg214,750
3-month avg209,643 (+7.3% vs current)
1-year avg220,925 (+1.8% vs current)
5-year avg220,495 (+2.0% vs current)
52-week high259,000
52-week low190,000
Continued claims1,777,000
Continued claims WoW-8,000 (-0.4%)
SignalCooling
Data: Federal Reserve Bank of St. Louis (FRED) · Series: ICSA, IC4WSA, CCSA · Seasonally adjusted · Released every Thursday by the Bureau of Labor Statistics.

Related Articles

Mortgage Rates Edge Up to 6.58%, Pushing Monthly Payments $65 Higher Than Last Year
Economics

Mortgage Rates Edge Up to 6.58%, Pushing Monthly Payments $65 Higher Than Last Year

MarketsFN Data Team
4 minJul 30, 2026
US jobless claims rise to 197,000 but remain near historic lows
Economics

US jobless claims rise to 197,000 but remain near historic lows

MarketsFN Data Team
4 minJul 30, 2026
Inflation Expectations Hit 2.26%, Up 6bps—On Target
Economics

Inflation Expectations Hit 2.26%, Up 6bps—On Target

MarketsFN Data Team
4 minJul 30, 2026