10-Year Yield Hits 52-Week High at 5.29% as Curve Steepens
MarketsFN Data Team
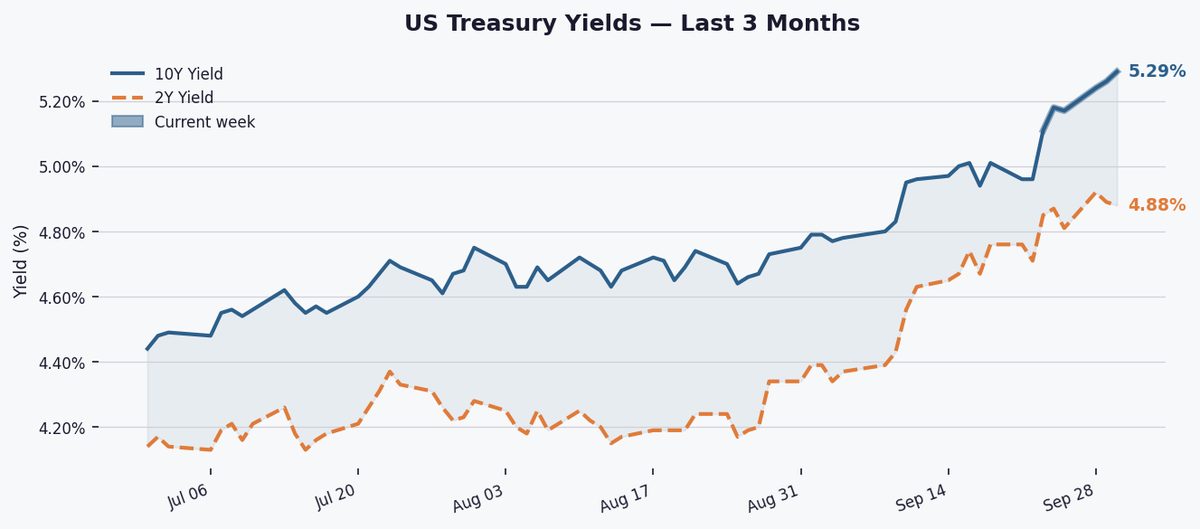
The 10-year Treasury yield surged 18 bps this week to 5.29%, a 52-week high, while the 2Y-10Y spread widened 15 bps to +46 bps, signaling persistent inflation concerns and growth expectations.
The 10-year yield settled at 5.29% on Friday, up 18 bps for the week and 110 bps year-to-date, marking its highest level in 52 weeks. It now sits 54 bps above its 3-month average and 92 bps above its 1-year average, reflecting a sustained upward trajectory from last year's 3.97% low.
The 2Y-10Y spread widened to +46 bps, up 15 bps this week, maintaining a positive slope. While still below its 52-week high of +74 bps, the steeper curve suggests markets anticipate resilient growth alongside lingering inflation pressures, historically a sign of late-cycle expansion rather than imminent recession.

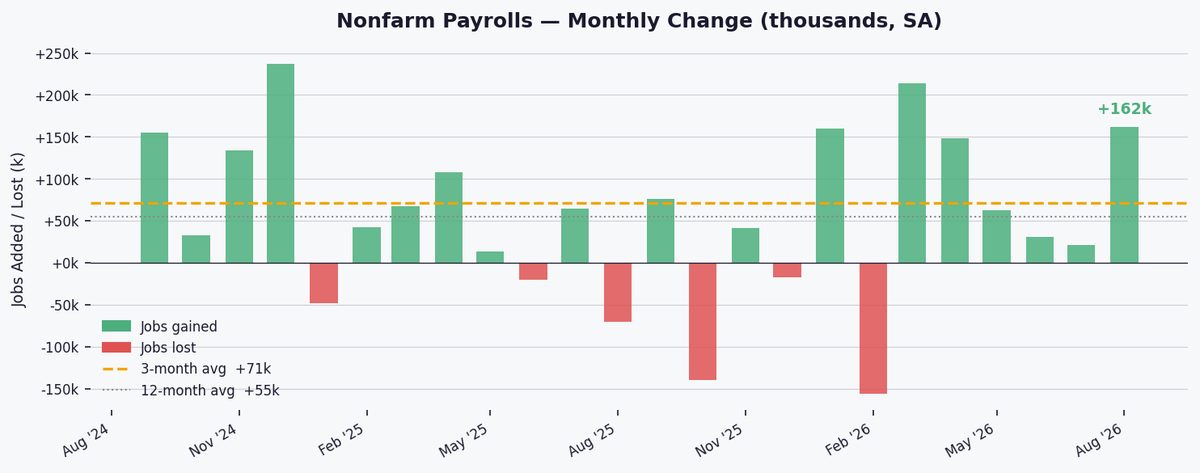
Next week, focus turns to September payrolls data and Fed speakers for clues on rate path durability. Any deviation from expected labor market cooling or hawkish FOMC rhetoric could extend the yield uptrend, testing 2026 highs.
Key Statistics at a Glance
| Edition | Weekly Close |
| Date | Friday, October 02, 2026 |
| 10Y Yield | 5.29% |
| 10Y Day-on-day | ▲ 3.0 bps |
| 10Y Week-on-week | ▲ 18.0 bps |
| 10Y YTD change | +110.0 bps |
| 10Y 3-month avg | 4.75% |
| 10Y 1-year avg | 4.37% |
| 10Y 52-week high | 5.29% |
| 10Y 52-week low | 3.97% |
| 2Y Yield | 4.88% |
| 2Y–10Y Spread | +0.460% (+46.0 bps) |
| Spread WoW | ▲ 15.0 bps |
| Spread 52-week high | +0.740% |
| Spread 52-week low | +0.200% |
| Curve signal | Positive |