HY spreads widen to 312 bps as risk-off sentiment persists into Friday
MarketsFN Data Team
The Option-Adjusted Spread measures the yield premium a corporate bond pays over a risk-free government bond of the same maturity — after stripping out the value of any embedded options (like call provisions). It isolates pure credit risk compensation. A wider OAS means bond investors demand more yield for holding corporate debt, signalling rising perceived risk. A tighter OAS means confidence in issuers is high and credit conditions are loose.
Investment Grade (IG) bonds are rated BBB−/Baa3 or above by S&P/Moody's. They represent large, financially stable companies. IG OAS is currently 84 bps. High Yield (HY) bonds are rated below BBB−/Baa3 — also called "junk bonds" — issued by companies with higher debt loads or less stable cash flows. HY OAS is 312 bps. The HY–IG gap of 228 bps is the market's price for taking extra risk.
When spreads widen (rise), investors are demanding more compensation for credit risk — often because recession fears are rising, corporate earnings are deteriorating, or liquidity is tightening. When spreads tighten (fall), risk appetite is strong: investors are willing to accept less yield premium, usually because the economic outlook is improving. Credit spreads often lead equity markets by days or weeks — they are a leading indicator of financial stress.
Historically, HY OAS has spiked before or during every US recession: ~600 bps in 2001, ~1,900 bps in 2008 (peak), ~900 bps in March 2020. The current HY OAS of 312 bps sits at the 57th percentile of the past 10 years — meaning spreads have been wider than today only 43% of the time. A sustained move above 600 bps would historically mark the threshold of serious credit stress.
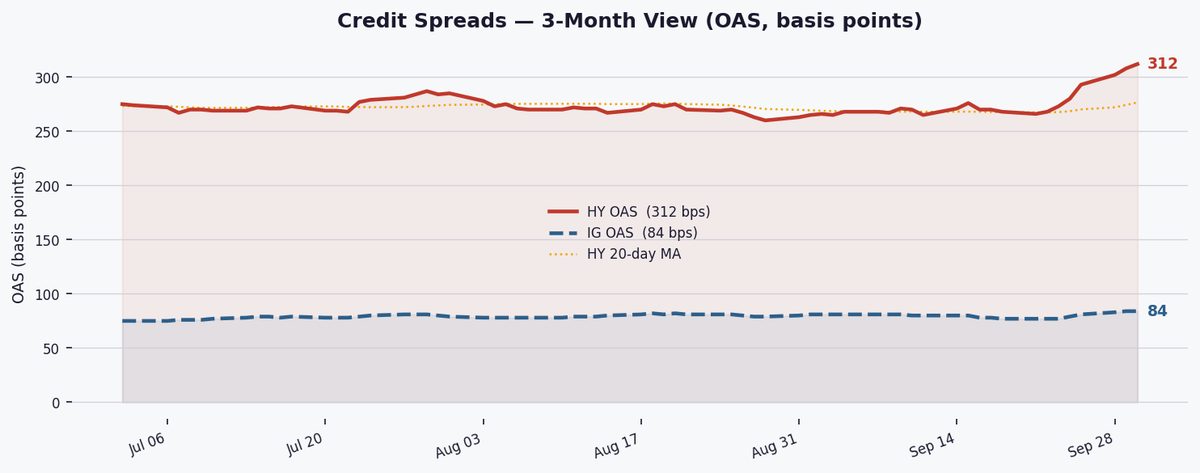
US high-yield spreads rose 4 bps to 312 bps today, now 39 bps wider on the week, as the NORMAL-regime market continues its WIDENING trajectory, signaling growing investor caution toward credit risk amid elevated Treasury yields.
High-yield spreads sit at 312 bps, in the 57th percentile of 10-year ranges, with a notable 39 bps weekly widening. The 20-day MA (277 bps) has diverged sharply above the 60-day MA (274 bps), confirming short-term bearish momentum. While still in NORMAL regime, the rapid widening suggests deteriorating risk appetite, though not yet at distressed levels historically associated with buying opportunities.
Investment-grade spreads held flat at 84 bps (46th percentile), but have widened 7 bps this week. The HY-IG differential of 228 bps remains slightly above its 4-year average (221 bps), indicating modest but not extreme risk aversion — investors aren't fleeing HY en masse but are demanding incremental yield for junk exposure.
HY bonds now yield 8.16%, a 287 bps premium over 10Y Treasuries (5.29%), while Moody's Baa-Aaa spread of 47 bps shows stable quality differentiation. These elevated yields — with HY near 8-month highs — will pressure refinancing for lower-rated issuers, particularly those facing 2027-28 maturities in a higher-for-longer rate environment.

Full Statistics Dashboard
| Metric | Current | Change | Historical Rank |
|---|---|---|---|
| HY OAS (ICE BofA) | 312 bps | ▲ 4 bps DoD ▲ 39 bps WoW | 57th pct |
| IG OAS (ICE BofA) | 84 bps | ▼ 0 bps DoD ▲ 7 bps WoW | 46th pct |
| HY−IG Differential | 228 bps | 4Y avg: 221 bps ▲ 7 bps vs avg | |
| HY Effective Yield | 8.16% | over 10Y: +287 bps | |
| IG Effective Yield | 6.02% | ||
| Moody's Baa Yield | 6.76% | Baa−Aaa: 47 bps | |
| Moody's Aaa Yield | 6.29% | ||
| 10Y Treasury | 5.29% | ||
| SOFR | 3.900% | vs 3M T-Bill: ▼ 30 bps bps | |
| HY OAS Regime | NORMAL | Direction: WIDENING (20d MA 277 vs 60d MA 274 bps) | |
| 10Y HY Range | 259–461 bps | median 302 bps |
The SOFR-T-Bill spread at -30 bps signals loose money-market conditions, with repo rates below Treasury yields. This benign funding backdrop isn't driving current spread moves, but could amplify any future risk rallies given banks' low borrowing costs — a contrast to 2023's regional banking stress episodes.

Watch next week's payrolls data for Treasury yield direction, which could accelerate HY moves. A sustained break above 330 bps (75th percentile) would threaten a shift from NORMAL to WIDE regime, while stability below 300 bps would suggest this week's move was technical rather than fundamental.