Inflation Steady as 10Y Breakeven Holds at 2.36%
MarketsFN Data Team
What is a breakeven rate?
The breakeven inflation rate equals the yield gap between a conventional Treasury and a TIPS of the same maturity. If the 10Y nominal yields 4.50% and the 10Y TIPS yields 2.00%, the 10Y breakeven is 2.50% — the level of average CPI at which an investor is indifferent between the two bonds. A higher breakeven signals stronger market inflation expectations.
Why three horizons?
The 5Y breakeven is most sensitive to near-term CPI prints and Fed policy. The 10Y breakeven blends short and long-run expectations. The 5Y/5Y forward looks only at years 5–10, stripping out near-term noise — it is the purest read on whether long-run inflation is anchored. The Fed watches the forward rate most closely.
The Fed's 2% target in breakeven terms
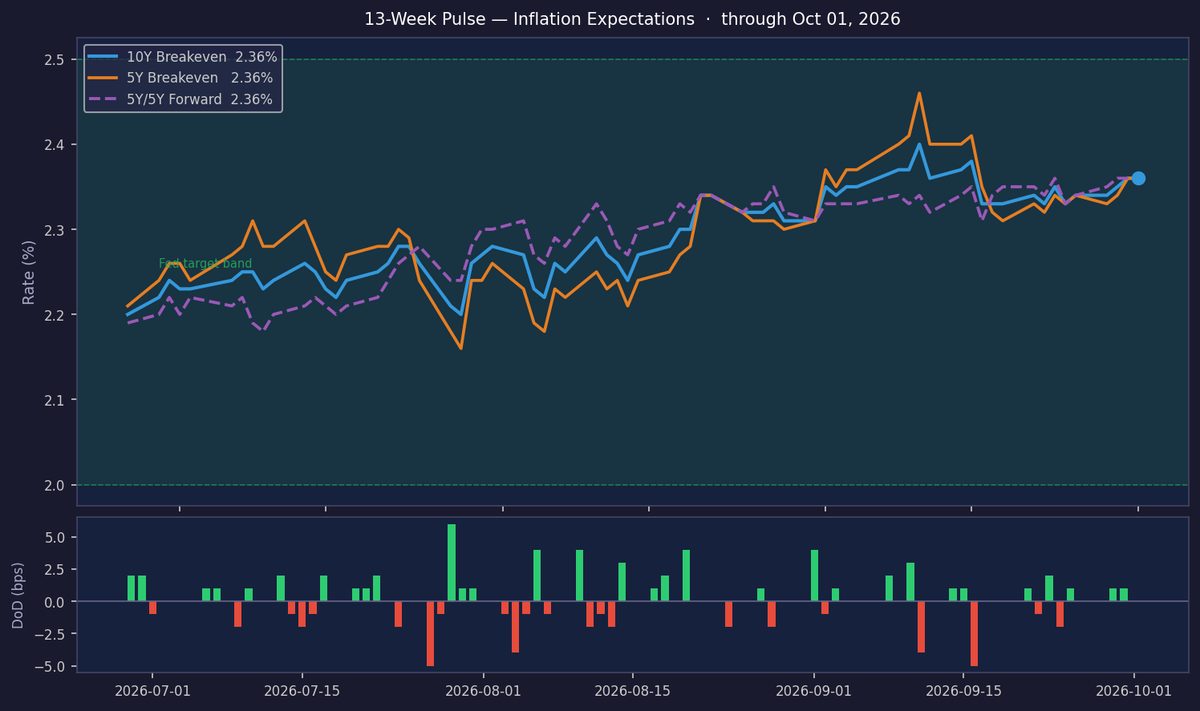
The Federal Reserve targets 2% PCE inflation, not CPI. Because CPI runs roughly 0.3–0.5 pp above PCE (different basket weights and housing costs), breakevens in the 2.2–2.5% range are broadly consistent with the Fed achieving its mandate. Breakevens above 2.5% signal markets doubting that 2% will be delivered; below 2.0% signals deflation or stagnation risk.
Real yields and monetary conditions
The 10Y TIPS yield is the "real" risk-free rate — what investors earn above and beyond inflation. Positive real yields make saving more attractive than spending or risk-taking: a tightening drag on the economy. Negative real yields (common in 2020–2022) were highly stimulative, driving asset prices and compressing credit spreads. The real yield is a direct gauge of monetary restriction.
Inflation expectations held steady this week, with the 10Y breakeven unchanged at 2.36%, reinforcing the ON TARGET regime. The 3.0 bps WoW increase reflects modest upward pressure, though today’s flat DoD move suggests near-term equilibrium. With the 10Y breakeven hovering near its 3-month average and sitting at the 78th percentile, markets appear balanced heading into next week.
The 5Y/5Y forward rate remains firmly anchored at 2.36%, unchanged DoD and in line with its 3-month average. At the 91.5th percentile, it signals elevated but stable long-term inflation expectations, with no immediate signs of drift. The Fed will likely view this as a reassuring indicator, though vigilance is warranted given the elevated percentile.

The 10Y real yield rose 2 bps to 2.93%, maintaining restrictive monetary conditions as it outpaces the Fed’s neutral rate estimate. The 6.23% nominal yield underscores tight financial conditions, with the 330 bps inflation compensation gap reflecting modest inflation risk premiums. Real yields at these levels continue to weigh on growth-sensitive assets.
Next week’s focus includes the September jobs report and Fed speakers, with the term premium flat at +0.0 bps suggesting limited term structure shifts. Watch for any divergence in breakevens post-data, particularly if labor market strength reignites inflation concerns. The Fed’s anchoring framework will remain in focus unless data surprises materially.
| Series | Latest | DoD | WoW | 10Y Rank | Freq. |
|---|---|---|---|---|---|
| 10Y Breakeven (T10YIE) | 2.36% | +0.0 bps | +3.0 bps | 78.1th pct | Daily |
| 5Y Breakeven (T5YIE) | 2.36% | +0.0 bps | +3.0 bps | 66.6th pct | Daily |
| 5Y/5Y Forward (T5YIFR) | 2.36% | +0.0 bps | — | 91.5th pct | Daily |
| 10Y Real / TIPS (DFII10) | 2.93% | +2.0 bps | — | — | Daily |
| 10Y Nominal (DGS10) | 6.23% | +0.0 bps | +24.0 bps | — | Daily |
| Term Premium (10Y−5Y be) | +0.0 bps | n/a | — | — | Derived |
| CPI YoY | 3.7% YoY (August 2026) | n/a | — | — | Monthly |
| Core PCE YoY | 3.0% YoY (August 2026) | n/a | — | — | Monthly |