S&P 5005,963+0.54%
NASDAQ21,443+0.87%
DOW43,892+0.31%
DAX23,888+0.44%
FTSE 1008,721-0.12%
EUR/USD1.1465+0.07%
GBP/USD1.3220+0.14%
USD/JPY161.31-0.03%
Gold3,241+0.22%
WTI Oil76.40+0.81%
Bitcoin103,241+1.43%
10Y UST4.47%-9bp
S&P 5005,963+0.54%
NASDAQ21,443+0.87%
DOW43,892+0.31%
DAX23,888+0.44%
FTSE 1008,721-0.12%
EUR/USD1.1465+0.07%
GBP/USD1.3220+0.14%
USD/JPY161.31-0.03%
Gold3,241+0.22%
WTI Oil76.40+0.81%
Bitcoin103,241+1.43%
10Y UST4.47%-9bp
MarketsFN
Economics

10-Year Treasury Yields Dip 6 bps This Week, Curve Remains Positive

MarketsFN Data Team
4 min read
10-Year Treasury Yields Dip 6 bps This Week, Curve Remains Positive
Fixed Income · Treasury Yields · Weekly Close

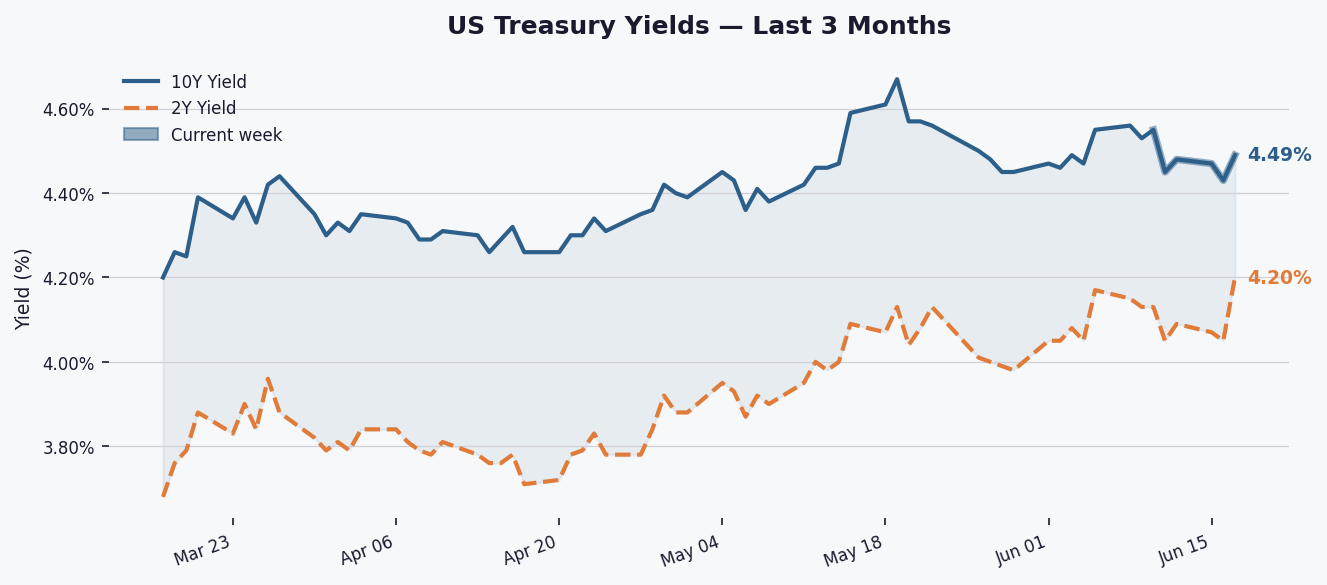
The 10-year Treasury yield settled at 4.490% this week, reflecting a 6.0 bps decline, while the yield curve signals a positive outlook for economic growth.

The 10-year yield experienced a week-on-week decrease of 6.0 bps, closing at 4.490%. This yield is slightly above its 3-month average of 4.406% and significantly higher than the 1-year average of 4.243%. Over the past year, it has fluctuated between a high of 4.670% and a low of 3.970%.

The 2-year to 10-year spread currently stands at 0.270%, having narrowed by 13.0 bps this week. While the spread remains positive, indicating a normal yield curve, it has not reached inversion, which historically suggests a healthy economic outlook and potential growth.

36-month yield spread chart
Fig. 2 — 2Y–10Y Treasury spread over 36 months. Green fill = normal curve; red fill = inverted (recession warning signal). Grey shading marks NBER-defined recessions where applicable.

Looking ahead, market participants should monitor upcoming economic data releases and any Federal Reserve signals regarding interest rate policy, as these factors may influence Treasury yields in the coming week.

Key Statistics at a Glance

EditionWeekly Close
DateFriday, June 19, 2026
10Y Yield4.49%
10Y Day-on-day▼ 6.0 bps
10Y Week-on-week▼ 6.0 bps
10Y YTD change+30.0 bps
10Y 3-month avg4.41%
10Y 1-year avg4.24%
10Y 52-week high4.67%
10Y 52-week low3.97%
2Y Yield4.20%
2Y–10Y Spread+0.270% (+27.0 bps)
Spread WoW▼ 13.0 bps
Spread 52-week high+0.740%
Spread 52-week low+0.270%
Curve signalPositive
Data: Federal Reserve Bank of St. Louis (FRED) · Series: DGS10, DGS2, T10Y2Y, USREC · Daily, business days only · Source: US Treasury / Federal Reserve.
#US Treasuries#Bond Market#Yield Curve#Interest Rates#10-Year Treasury#2-Year Treasury#2Y10Y Spread#Federal Reserve#Fixed Income#FRED

Related Articles

Mortgage Rates Edge Up to 6.58%, Pushing Monthly Payments $65 Higher Than Last Year
Economics

Mortgage Rates Edge Up to 6.58%, Pushing Monthly Payments $65 Higher Than Last Year

MarketsFN Data Team
4 minJul 30, 2026
US jobless claims rise to 197,000 but remain near historic lows
Economics

US jobless claims rise to 197,000 but remain near historic lows

MarketsFN Data Team
4 minJul 30, 2026
Inflation Expectations Hit 2.26%, Up 6bps—On Target
Economics

Inflation Expectations Hit 2.26%, Up 6bps—On Target

MarketsFN Data Team
4 minJul 30, 2026