10-Year Treasury Yield Rises to 4.490% Amid Positive Curve Signal
MarketsFN Data Team
10-Year Treasury Yield Rises to 4.490% Amid Positive Curve Signal
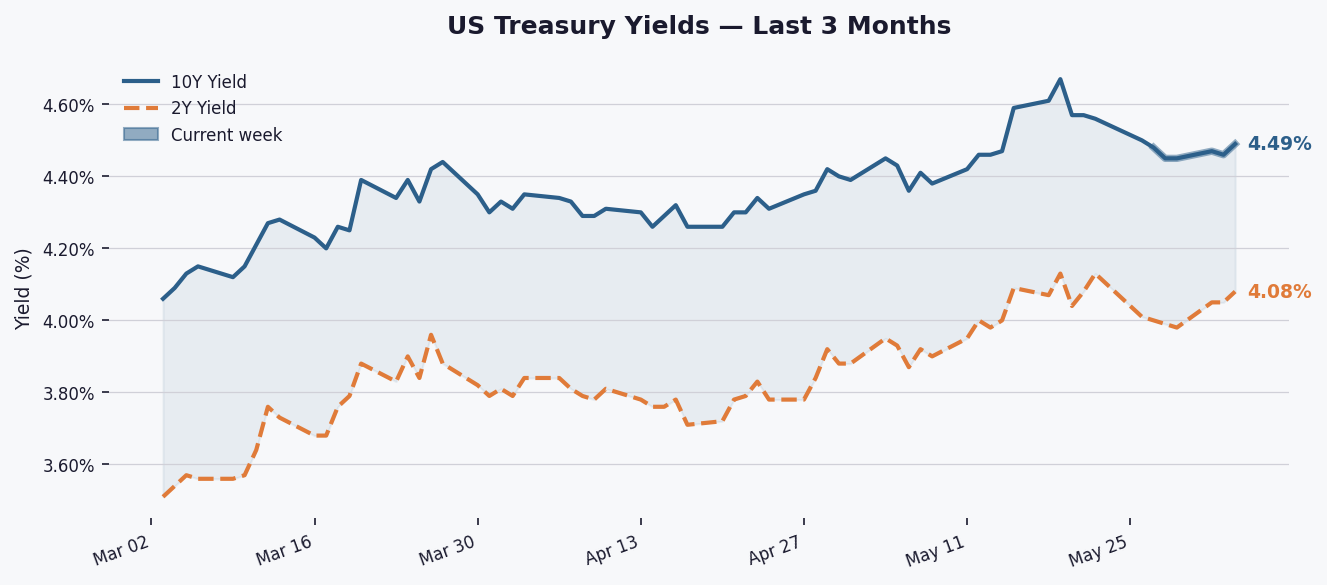
The 10-year Treasury yield closed at 4.490% on Friday, June 5, 2026, reflecting a modest week-on-week increase and signaling a positive economic outlook.
The 10-year yield rose by 1.0 bps this week, settling at 4.490%. This level is above both the 3-month average of 4.356% and the 1-year average of 4.240%. Over the past year, the yield has fluctuated between a high of 4.670% and a low of 3.970%, indicating a relatively volatile environment.

The 2-year to 10-year spread currently stands at +0.420% (42.0 bps), having decreased by 4.0 bps this week. This positive spread suggests a normal yield curve, which historically signals expectations of economic growth. However, the spread remains below its 52-week high of +0.740%, indicating some caution among investors.

Looking ahead, market participants should monitor upcoming economic data releases and Federal Reserve signals, particularly regarding inflation and interest rate policy, as these factors could influence yield movements in the coming week.
Key Statistics at a Glance
| Edition | Weekly Close |
| Date | Friday, June 05, 2026 |
| 10Y Yield | 4.49% |
| 10Y Day-on-day | ▲ 3.0 bps |
| 10Y Week-on-week | ▲ 1.0 bps |
| 10Y YTD change | +30.0 bps |
| 10Y 3-month avg | 4.36% |
| 10Y 1-year avg | 4.24% |
| 10Y 52-week high | 4.67% |
| 10Y 52-week low | 3.97% |
| 2Y Yield | 4.08% |
| 2Y–10Y Spread | +0.420% (+42.0 bps) |
| Spread WoW | ▼ 4.0 bps |
| Spread 52-week high | +0.740% |
| Spread 52-week low | +0.410% |
| Curve signal | Positive |