10Y Yield Drops 6 bps to 5.22% as Curve Holds Positive Slope
MarketsFN Data Team
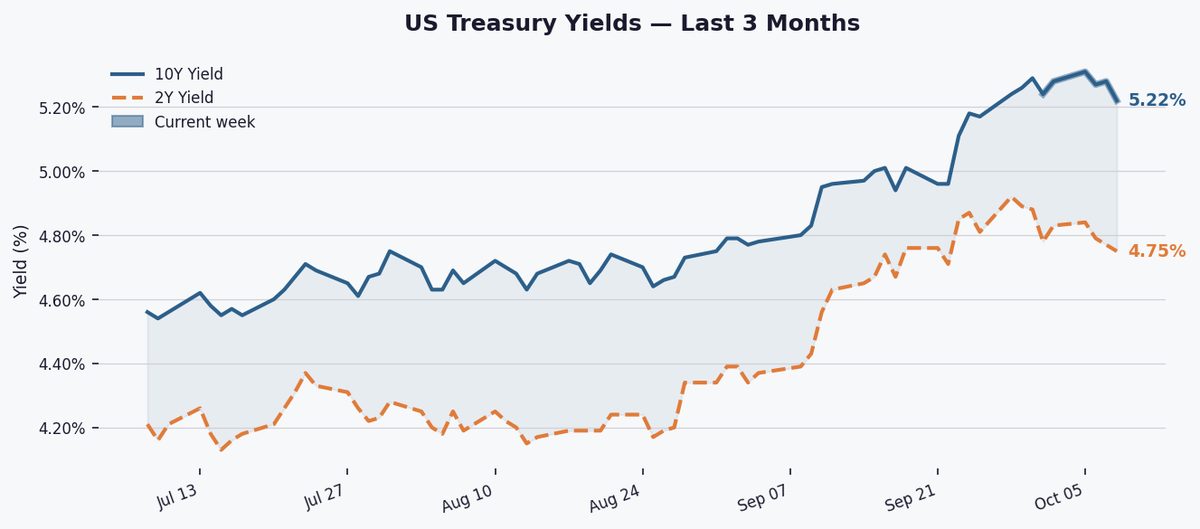
The 10-year Treasury yield fell 6 bps to 5.22% on Tuesday, extending its weekly decline while maintaining a positive spread over 2-year notes, signaling persistent growth expectations amid easing rate pressures.
The 10-year yield has declined 2 bps this week, trading 40 bps above its 3-month average (4.82%) and 82 bps higher than its 1-year average (4.40%). After hitting a 52-week high of 5.31% recently, it remains near the upper end of its yearly range (3.97%-5.31%), reflecting ongoing inflation and Fed policy recalibration.
The 2Y-10Y spread stands at +44 bps, narrowing 1 bp WoW but remaining positively sloped. While below its 52-week high of +74 bps, the curve's persistent steepness contrasts with 2023's inversion, suggesting markets anticipate economic resilience rather than imminent recession despite elevated policy rates.

Markets await Thursday's CPI data and Fed minutes for clues on inflation persistence. Any hawkish Fed rhetoric or upside price surprises could reverse the week's yield decline, while softer data may reinforce the dip toward 5.15% support.
Key Statistics at a Glance
| Edition | Mid-Week Update |
| Date | Tuesday, October 13, 2026 |
| 10Y Yield | 5.22% |
| 10Y Day-on-day | ▼ 6.0 bps |
| 10Y Week-on-week | ▼ 2.0 bps |
| 10Y YTD change | +103.0 bps |
| 10Y 3-month avg | 4.82% |
| 10Y 1-year avg | 4.40% |
| 10Y 52-week high | 5.31% |
| 10Y 52-week low | 3.97% |
| 2Y Yield | 4.75% |
| 2Y–10Y Spread | +0.440% (+44.0 bps) |
| Spread WoW | ▼ 1.0 bps |
| Spread 52-week high | +0.740% |
| Spread 52-week low | +0.200% |
| Curve signal | Positive |