MarketsFN
S&P 5005,963+0.54%
NASDAQ21,443+0.87%
DOW43,892+0.31%
DAX23,888+0.44%
FTSE 1008,721-0.12%
EUR/USD1.1465+0.07%
GBP/USD1.3220+0.14%
USD/JPY161.31-0.03%
Gold3,241+0.22%
WTI Oil76.40+0.81%
Bitcoin103,241+1.43%
10Y UST4.47%-9bp
S&P 5005,963+0.54%
NASDAQ21,443+0.87%
DOW43,892+0.31%
DAX23,888+0.44%
FTSE 1008,721-0.12%
EUR/USD1.1465+0.07%
GBP/USD1.3220+0.14%
USD/JPY161.31-0.03%
Gold3,241+0.22%
WTI Oil76.40+0.81%
Bitcoin103,241+1.43%
10Y UST4.47%-9bp
Economics

10-Year Yield Nears 52-Week High as Curve Steepens Further

MarketsFN Data Team
•4 min read
10-Year Yield Nears 52-Week High as Curve Steepens Further
Fixed Income · Treasury Yields · Mid-Week Update

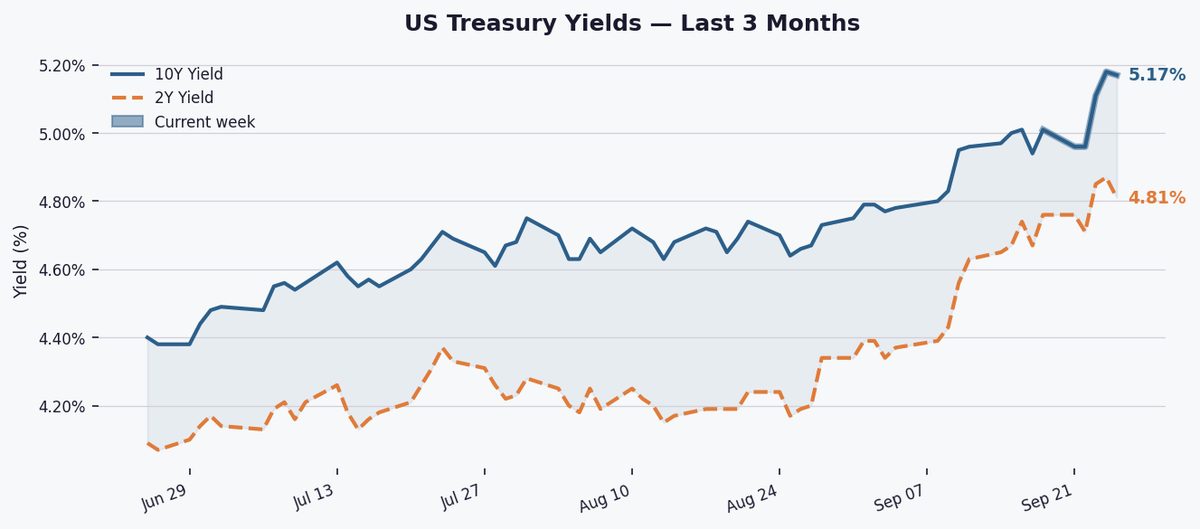
The 10-year Treasury yield edged down 1 bp to 5.17% Tuesday but remains up 16 bps this week, with the 2Y-10Y spread widening to +32 bps, signaling persistent growth expectations.

The 10-year yield at 5.17% hovers just below its 52-week high of 5.18%, up 98 bps YTD. It remains 46 bps above its 3-month average (4.71%) and 81 bps above its 1-year average (4.36%), reflecting a sustained upward shift in long-term rate expectations.

The 2Y-10Y spread widened 12 bps this week to +32 bps, reinforcing its positive slope. While still below its 52-week high of +74 bps, the curve’s steepening suggests markets anticipate resilient growth and delayed Fed cuts, contrasting with inversion’s typical recession signal.

36-month yield spread chart
Fig. 2 — 2Y–10Y Treasury spread over 36 months. Green fill = normal curve; red fill = inverted (recession warning signal). Grey shading marks NBER-defined recessions where applicable.

Markets await Friday’s PCE inflation data and Fed speakers for clues on rate path durability. A hot print could push 10Y toward 5.20%, while dovish hints may ease yields. Supply dynamics from upcoming auctions also bear watching.

Key Statistics at a Glance

EditionMid-Week Update
DateTuesday, September 29, 2026
10Y Yield5.17%
10Y Day-on-day▲ 1.0 bps
10Y Week-on-week▲ 16.0 bps
10Y YTD change+98.0 bps
10Y 3-month avg4.71%
10Y 1-year avg4.36%
10Y 52-week high5.18%
10Y 52-week low3.97%
2Y Yield4.81%
2Y–10Y Spread+0.320% (+32.0 bps)
Spread WoW▲ 12.0 bps
Spread 52-week high+0.740%
Spread 52-week low+0.200%
Curve signalPositive
Data: Federal Reserve Bank of St. Louis (FRED) · Series: DGS10, DGS2, T10Y2Y, USREC · Daily, business days only · Source: US Treasury / Federal Reserve.
#US Treasuries#Bond Market#Yield Curve#Interest Rates#10-Year Treasury#2-Year Treasury#2Y10Y Spread#Federal Reserve#Fixed Income#FRED

Related Articles

Inflation Expectations Steady at 2.34%, Target Regime Holds
Economics

Inflation Expectations Steady at 2.34%, Target Regime Holds

MarketsFN Data Team
4 minSep 29, 2026
HY spreads widen to 293bps as risk-off sentiment builds ahead of key data
Economics

HY spreads widen to 293bps as risk-off sentiment builds ahead of key data

MarketsFN Data Team
5 minSep 28, 2026
10-Year Yield Nears 5% as Curve Steepens; 2-Year Surge Drives Weekly Momentum
Economics

10-Year Yield Nears 5% as Curve Steepens; 2-Year Surge Drives Weekly Momentum

MarketsFN Data Team
4 minSep 15, 2026