MarketsFN
S&P 5005,963+0.54%
NASDAQ21,443+0.87%
DOW43,892+0.31%
DAX23,888+0.44%
FTSE 1008,721-0.12%
EUR/USD1.1465+0.07%
GBP/USD1.3220+0.14%
USD/JPY161.31-0.03%
Gold3,241+0.22%
WTI Oil76.40+0.81%
Bitcoin103,241+1.43%
10Y UST4.47%-9bp
S&P 5005,963+0.54%
NASDAQ21,443+0.87%
DOW43,892+0.31%
DAX23,888+0.44%
FTSE 1008,721-0.12%
EUR/USD1.1465+0.07%
GBP/USD1.3220+0.14%
USD/JPY161.31-0.03%
Gold3,241+0.22%
WTI Oil76.40+0.81%
Bitcoin103,241+1.43%
10Y UST4.47%-9bp
Economics

10-Year Yield Nears 5% as Curve Steepens; 2-Year Surge Drives Weekly Momentum

MarketsFN Data Team
4 min read
10-Year Yield Nears 5% as Curve Steepens; 2-Year Surge Drives Weekly Momentum
Fixed Income · Treasury Yields · Mid-Week Update

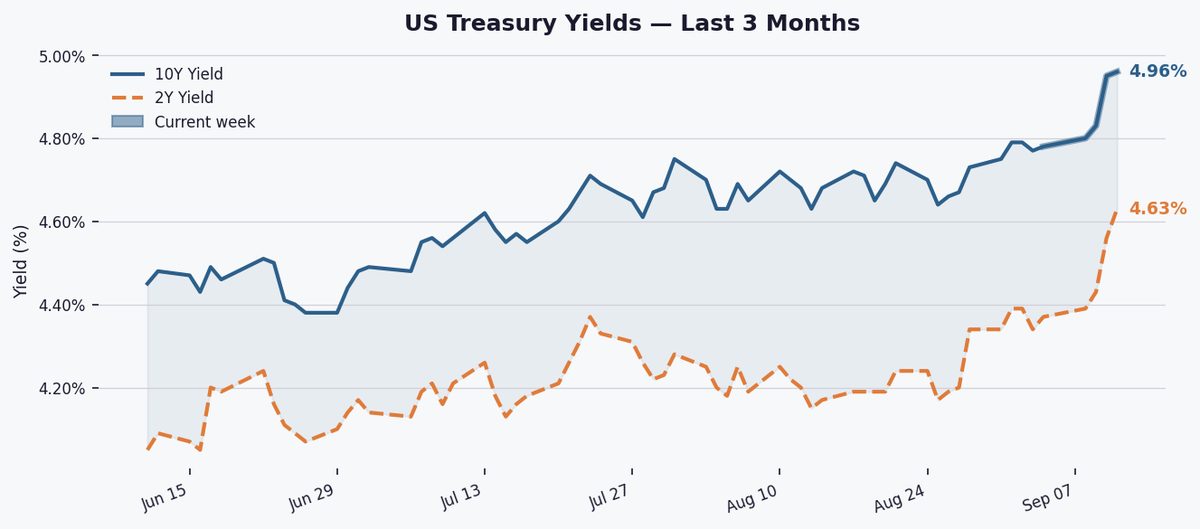
The 10-year Treasury yield rose 1 bp to 4.96%, flirting with a 52-week high, while the 2-10Y spread widened to +32 bps, signaling persistent growth expectations despite Fed tightening.

The 10-year yield has climbed 19 bps this week and now sits 34 bps above its 3-month average (4.625%) and 64 bps above its 1-year average (4.321%). At 4.96%, it matches its 52-week high, up 99 bps from the 52-week low of 3.97% set earlier this year.

The 2-10Y spread widened to +32 bps, though it remains 9 bps narrower than last week and well below its 52-week high of +74 bps. The positive slope reflects market confidence in economic resilience, though historically, spreads below 50 bps precede growth slowdowns.

36-month yield spread chart
Fig. 2 — 2Y–10Y Treasury spread over 36 months. Green fill = normal curve; red fill = inverted (recession warning signal). Grey shading marks NBER-defined recessions where applicable.

Markets await August retail sales (Thu) and industrial production (Fri) for demand clues. Fed speakers this week could cement or challenge expectations for one more 2026 hike, while oil price swings may influence inflation bets.

Key Statistics at a Glance

EditionMid-Week Update
DateTuesday, September 15, 2026
10Y Yield4.96%
10Y Day-on-day▲ 1.0 bps
10Y Week-on-week▲ 19.0 bps
10Y YTD change+77.0 bps
10Y 3-month avg4.63%
10Y 1-year avg4.32%
10Y 52-week high4.96%
10Y 52-week low3.97%
2Y Yield4.63%
2Y–10Y Spread+0.320% (+32.0 bps)
Spread WoW▼ 9.0 bps
Spread 52-week high+0.740%
Spread 52-week low+0.270%
Curve signalPositive
Data: Federal Reserve Bank of St. Louis (FRED) · Series: DGS10, DGS2, T10Y2Y, USREC · Daily, business days only · Source: US Treasury / Federal Reserve.
#US Treasuries#Bond Market#Yield Curve#Interest Rates#10-Year Treasury#2-Year Treasury#2Y10Y Spread#Federal Reserve#Fixed Income#FRED

Related Articles

10-Year Yield Hits 52-Week High at 4.83% as Curve Holds Positive
Economics

10-Year Yield Hits 52-Week High at 4.83% as Curve Holds Positive

MarketsFN Data Team
4 minSep 11, 2026
Inflation Expectations Hold Steady at 2.40%, Up 3.0 bps
Economics

Inflation Expectations Hold Steady at 2.40%, Up 3.0 bps

MarketsFN Data Team
4 minSep 11, 2026
Mortgage rates hit 6.71%, a 52-week high, squeezing homebuyer budgets
Economics

Mortgage rates hit 6.71%, a 52-week high, squeezing homebuyer budgets

MarketsFN Data Team
4 minSep 10, 2026
10-Year Yield Nears 5% as Curve Steepens; 2-Year Surge Drives Weekly Momentum | MarketsFN