S&P 5005,963+0.54%
NASDAQ21,443+0.87%
DOW43,892+0.31%
DAX23,888+0.44%
FTSE 1008,721-0.12%
EUR/USD1.1465+0.07%
GBP/USD1.3220+0.14%
USD/JPY161.31-0.03%
Gold3,241+0.22%
WTI Oil76.40+0.81%
Bitcoin103,241+1.43%
10Y UST4.47%-9bp
S&P 5005,963+0.54%
NASDAQ21,443+0.87%
DOW43,892+0.31%
DAX23,888+0.44%
FTSE 1008,721-0.12%
EUR/USD1.1465+0.07%
GBP/USD1.3220+0.14%
USD/JPY161.31-0.03%
Gold3,241+0.22%
WTI Oil76.40+0.81%
Bitcoin103,241+1.43%
10Y UST4.47%-9bp
MarketsFN
Economics

10Y Treasury Yield Dips to 4.470% Amid Positive Curve Signal

MarketsFN Data Team
4 min read
10Y Treasury Yield Dips to 4.470% Amid Positive Curve Signal
Fixed Income · Treasury Yields · Mid-Week Update

10Y Treasury Yield Dips to 4.470% Amid Positive Curve Signal

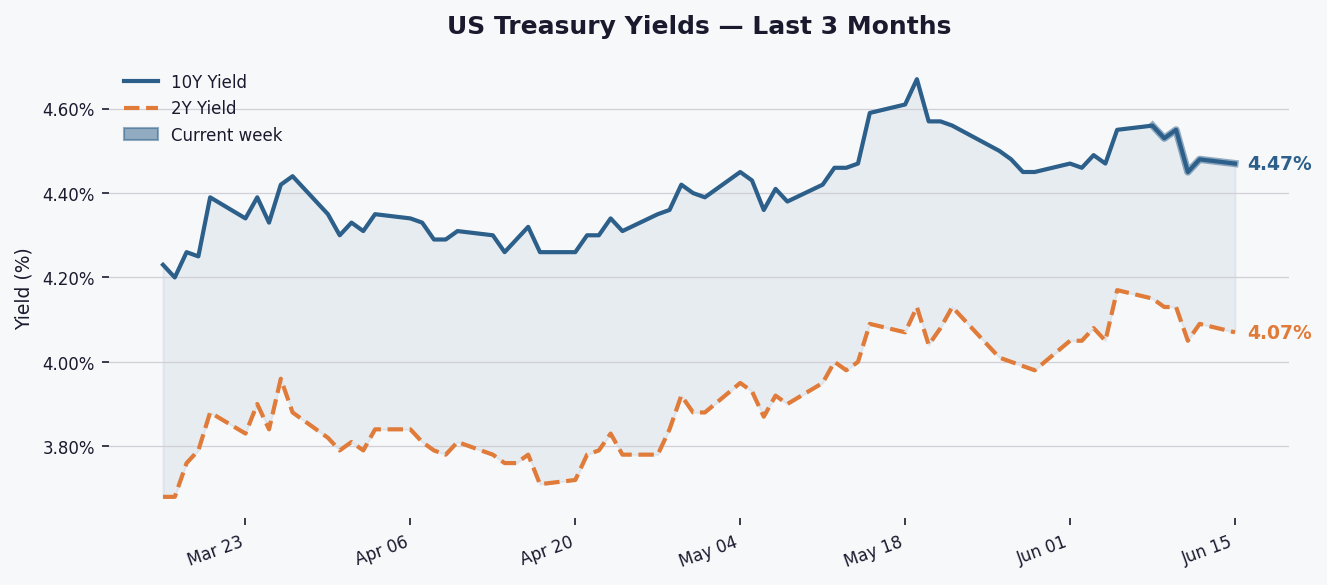
The 10-year Treasury yield has decreased by 1.0 bps to 4.470%, reflecting recent market momentum and a positive yield curve signal.

The 10-year yield has seen a week-on-week decline of 9.0 bps, positioning it above its 3-month average of 4.401% and significantly higher than the 1-year average of 4.242%. Over the past year, the yield has fluctuated between a high of 4.670% and a low of 3.970%.

3-month Treasury yields chart
Fig. 1 — US 10Y (blue) and 2Y (orange, dashed) Treasury yields, last 3 months. Shaded band shows spread between the two maturities. Bold segment highlights the current week's moves.

Currently, the 2Y–10Y spread stands at +0.380%, down 2.0 bps week-on-week. This spread indicates a positive curve signal, suggesting that the yield curve is not inverted, which historically can be a sign of economic growth expectations.

36-month yield spread chart
Fig. 2 — 2Y–10Y Treasury spread over 36 months. Green fill = normal curve; red fill = inverted (recession warning signal). Grey shading marks NBER-defined recessions where applicable.

Investors should keep an eye on upcoming economic data releases, particularly inflation and employment figures, as well as any signals from the Federal Reserve that could influence yield movements by the end of the week.

Key Statistics at a Glance

EditionMid-Week Update
DateWednesday, June 17, 2026
10Y Yield4.47%
10Y Day-on-day▼ 1.0 bps
10Y Week-on-week▼ 9.0 bps
10Y YTD change+28.0 bps
10Y 3-month avg4.40%
10Y 1-year avg4.24%
10Y 52-week high4.67%
10Y 52-week low3.97%
2Y Yield4.07%
2Y–10Y Spread+0.380% (+38.0 bps)
Spread WoW▼ 2.0 bps
Spread 52-week high+0.740%
Spread 52-week low+0.380%
Curve signalPositive
Data: Federal Reserve Bank of St. Louis (FRED) · Series: DGS10, DGS2, T10Y2Y, USREC · Daily, business days only · Source: US Treasury / Federal Reserve.

Related Articles

Mortgage Rates Edge Up to 6.58%, Pushing Monthly Payments $65 Higher Than Last Year
Economics

Mortgage Rates Edge Up to 6.58%, Pushing Monthly Payments $65 Higher Than Last Year

MarketsFN Data Team
4 minJul 30, 2026
US jobless claims rise to 197,000 but remain near historic lows
Economics

US jobless claims rise to 197,000 but remain near historic lows

MarketsFN Data Team
4 minJul 30, 2026
Inflation Expectations Hit 2.26%, Up 6bps—On Target
Economics

Inflation Expectations Hit 2.26%, Up 6bps—On Target

MarketsFN Data Team
4 minJul 30, 2026