Solana Nears Oversold as Price Dips Below $104, RSI at 21.1
QuoteReporter
•2 min read
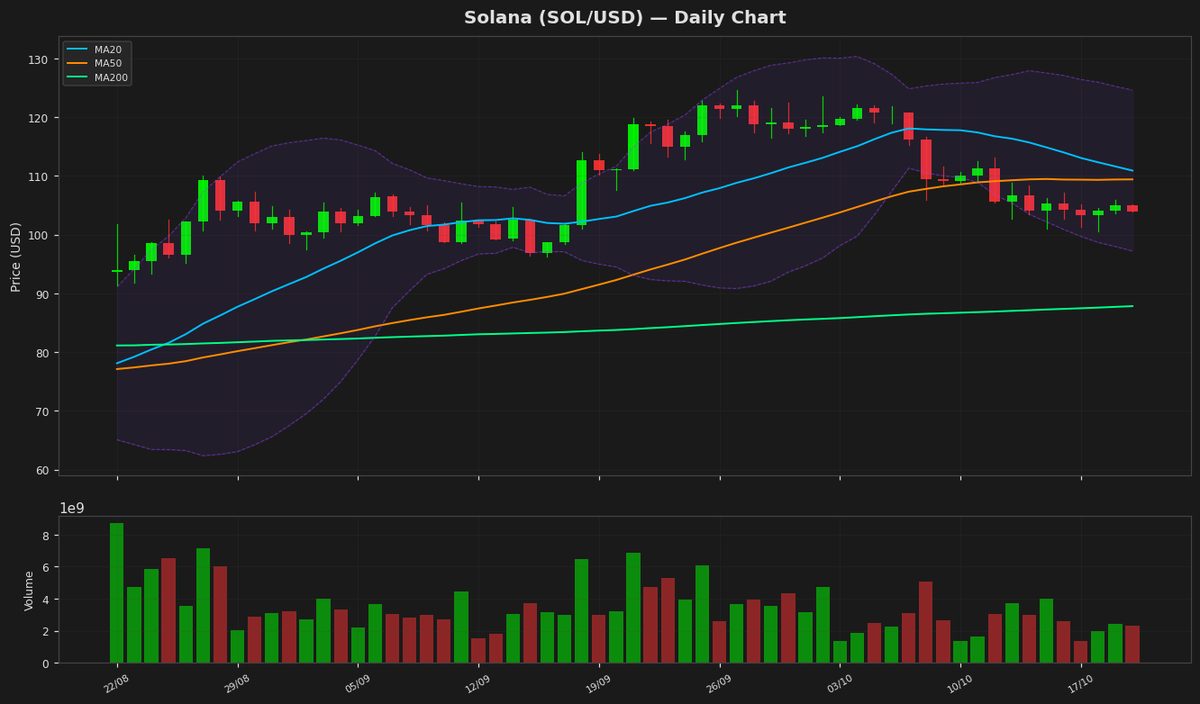
Solana (SOL/USD) | October 20, 2026 $103.9200 -0.96%
🔍 Technical Analysis
**Technical Analysis of Solana (SOL)**
Solana (SOL) is currently trading at $103.92, down 0.96% on the day, reflecting short-term bearish pressure. The price is below all key moving averages—20-day ($110.90), 50-day ($109.40), and 200-day ($87.82)—indicating a weak near-term trend despite the long-term bullish structure supported by the rising 200MA. The Bollinger Bands show widening volatility, with the upper band at $124.59 and the lower band at $97.20, suggesting potential for further downside if the price fails to hold above the lower band.
The RSI at 21.07 is deeply oversold, hinting at a possible near-term rebound or consolidation. However, the MACD remains bearish, with the histogram (-2.23) below the signal line (-1.07), reinforcing downward momentum. Key support levels to watch are $97.20 (lower Bollinger Band) and the psychological $90 level. Resistance lies at the 20MA ($110.90) and the mid-Bollinger Band near $110.90. A break above $110.90 could signal a short-term recovery, while failure to hold $97.20 may extend declines toward $90.
Given the oversold RSI, traders should watch for a potential bounce, but confirmation from MACD and moving averages is needed for a sustained reversal. The 52-week range ($60.41 - $124.62) highlights Solana's volatility, with the current price near the lower half of this range.
Technical Metrics
| Metric | Value |
|---|---|
| Current Price | $103.9200 |
| Daily Change | -0.96% |
| MA 20 | $110.8988 |
| % from MA20 | -6.29% |
| MA 50 | $109.3966 |
| % from MA50 | -5.01% |
| MA 200 | $87.8215 |
| % from MA200 | +18.33% |
| BB Upper | $124.5932 |
| % from BB Upper | -16.59% |
| BB Lower | $97.2044 |
| % from BB Lower | +6.91% |
| RSI (14) | 21.07 |
| MACD | -2.233501 |
| MACD Signal | -1.068299 |
| ATR (14) | 4.607286 |
| 3-Day High | $105.9083 |
| 3-Day Low | $100.5079 |
| 52-Week High | $124.6174 |
| % from 52W High | -16.61% |
| 52-Week Low | $60.4147 |
| % from 52W Low | +72.01% |
| YTD High | $148.2160 |
| % from YTD High | -29.89% |
| YTD Low | $60.4147 |
| % from YTD Low | +72.01% |
📊 Market Commentary
Solana (SOL) is currently trading at $103.92, down 0.96% today, as the broader crypto market shows mixed signals. The Relative Strength Index (RSI) at 21.1 indicates SOL is deeply oversold, which could attract buyers looking for a potential rebound. However, market sentiment remains cautious due to recent volatility and macroeconomic uncertainties affecting risk assets.
SOL’s 52-week range of $60.41 to $124.61 highlights its resilience and volatility. The current price sits near the lower end of this range, with traders watching key support around $100, a psychological level that could trigger further downside if broken. On the upside, resistance near $110 and $120 may cap short-term gains unless buying pressure intensifies.
Traders are closely monitoring network activity, particularly transaction volumes and developer engagement, as Solana’s ecosystem continues to expand despite past outages. Institutional interest and Bitcoin’s price movements also influence SOL’s direction. The oversold RSI suggests a possible near-term bounce, but sustained recovery depends on broader market conditions and Solana’s ability to maintain its competitive edge in the smart contract space. For now, caution prevails as participants weigh technical signals against macroeconomic headwinds.
Disclaimer
The content on MarketsFN.com is provided for educational and informational purposes only. It does not constitute financial advice or investment recommendations. All investments involve risk. Cryptocurrency markets are highly volatile. Past performance does not guarantee future results.