MarketsFN
S&P 5005,963+0.54%
NASDAQ21,443+0.87%
DOW43,892+0.31%
DAX23,888+0.44%
FTSE 1008,721-0.12%
EUR/USD1.1465+0.07%
GBP/USD1.3220+0.14%
USD/JPY161.31-0.03%
Gold3,241+0.22%
WTI Oil76.40+0.81%
Bitcoin103,241+1.43%
10Y UST4.47%-9bp
S&P 5005,963+0.54%
NASDAQ21,443+0.87%
DOW43,892+0.31%
DAX23,888+0.44%
FTSE 1008,721-0.12%
EUR/USD1.1465+0.07%
GBP/USD1.3220+0.14%
USD/JPY161.31-0.03%
Gold3,241+0.22%
WTI Oil76.40+0.81%
Bitcoin103,241+1.43%
10Y UST4.47%-9bp
Economics

10Y Treasury Yields Fall 8 Bps to 5.19% as Curve Steepens

MarketsFN Data Team
•4 min read
10Y Treasury Yields Fall 8 Bps to 5.19% as Curve Steepens
Fixed Income · Treasury Yields · Weekly Close

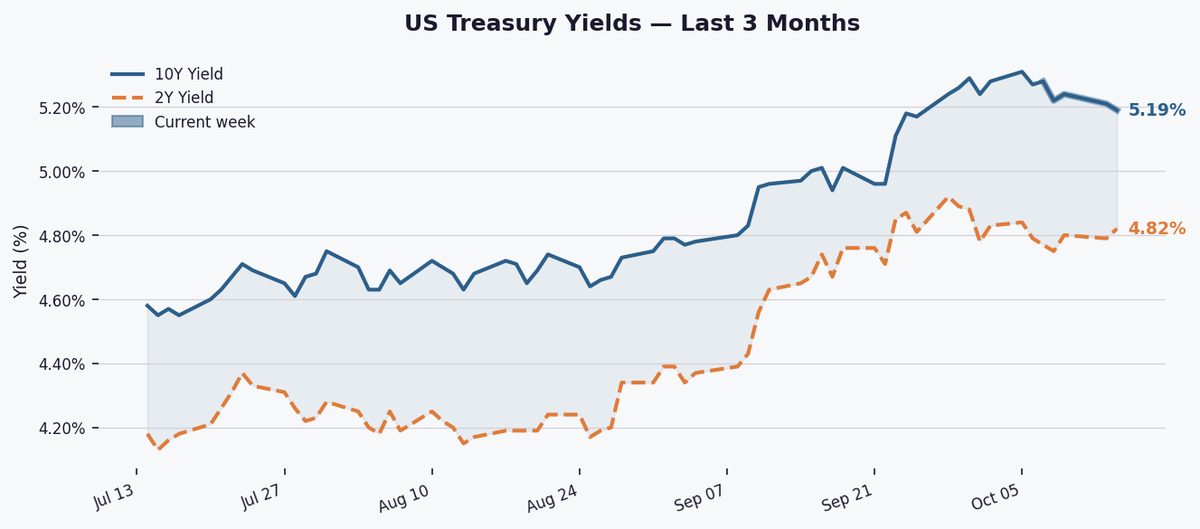
The 10-year Treasury yield settled at 5.19%, down 8 bps for the week, while the 2Y-10Y spread widened to 33 bps, signaling a modestly steeper curve.

The 10-year yield declined 8 bps this week to 5.19%, remaining above its 3-month (4.85%) and 1-year (4.41%) averages. It sits 100 bps higher year-to-date but below its 52-week high of 5.31%, reflecting persistent inflation and Fed policy pressures despite the weekly dip.

The 2Y-10Y spread widened 18 bps this week to 33 bps, maintaining a positive slope. While still narrow historically (52-week high: 74 bps), the steepening suggests reduced near-term recession fears, though prolonged inversion risks linger if Fed hikes exceed expectations.

36-month yield spread chart
Fig. 2 — 2Y–10Y Treasury spread over 36 months. Green fill = normal curve; red fill = inverted (recession warning signal). Grey shading marks NBER-defined recessions where applicable.

Markets will watch September retail sales and industrial production data, along with Fed speakers’ tone on inflation, to gauge whether yields retest recent highs or extend the pullback.

Key Statistics at a Glance

EditionWeekly Close
DateFriday, October 16, 2026
10Y Yield5.19%
10Y Day-on-day▼ 2.0 bps
10Y Week-on-week▼ 8.0 bps
10Y YTD change+100.0 bps
10Y 3-month avg4.85%
10Y 1-year avg4.41%
10Y 52-week high5.31%
10Y 52-week low3.97%
2Y Yield4.82%
2Y–10Y Spread+0.330% (+33.0 bps)
Spread WoW▼ 18.0 bps
Spread 52-week high+0.740%
Spread 52-week low+0.200%
Curve signalPositive
Data: Federal Reserve Bank of St. Louis (FRED) · Series: DGS10, DGS2, T10Y2Y, USREC · Daily, business days only · Source: US Treasury / Federal Reserve.
#US Treasuries#Bond Market#Yield Curve#Interest Rates#10-Year Treasury#2-Year Treasury#2Y10Y Spread#Federal Reserve#Fixed Income#FRED

Related Articles

Fed balance sheet shrinks 24.7% to $6.75T as reserves hit critical $333.7B
Economics

Fed balance sheet shrinks 24.7% to $6.75T as reserves hit critical $333.7B

MarketsFN Data Team
5 minOct 15, 2026
HY spreads hold at 311 bps as credit markets pause amid mixed risk signals
Economics

HY spreads hold at 311 bps as credit markets pause amid mixed risk signals

MarketsFN Data Team
5 minOct 14, 2026
10Y Inflation Outlook Holds Steady at 2.33%
Economics

10Y Inflation Outlook Holds Steady at 2.33%

MarketsFN Data Team
4 minOct 14, 2026
10Y Treasury Yields Fall 8 Bps to 5.19% as Curve Steepens | MarketsFN