S&P 500 52-Week Highs & Lows Radar: Waters (WAT), Netflix (NFLX) and more
MarketsFN Team

Screening all 503 S&P 500 constituents for stocks nearest to their 52-week high and their 52-week low. Data as of October 27, 2026. % Realized = 52-week total return.
Legend: RSI > 70 = overbought · RSI < 30 = oversold · Green % Realized = positive 52W return · Red = negative.
📈 Nearest to 52-Week High
Sectors represented: Healthcare (5)
| Ticker | Company | Sector | Price Last | % Realized | 52-Week High Date | RSI | % above MA200 | Trend |
|---|---|---|---|---|---|---|---|---|
| WAT | Waters Corp | Healthcare | $460.65 | +30.96% | 2026-10-27 | 66.3 | +25.1% | Above MA20, MA50, MA200 |
| VTRS | Viatris Inc | Healthcare | $18.68 | +79.32% | 2026-10-27 | 62.0 | +18.2% | Above MA20, MA50, MA200 |
| RVTY | Revvity Inc | Healthcare | $161.08 | +65.79% | 2026-10-27 | 68.4 | +45.0% | Above MA20, MA50, MA200 |
| TECH | Bio-Techne Corp | Healthcare | $72.71 | +13.18% | 2026-10-27 | 61.5 | +15.3% | Above MA20, MA50, MA200 |
| WST | West Pharmaceutical Services, Inc | Healthcare | $394.68 | +37.41% | 2026-10-26 | 70.4 | +26.8% | Above MA20, MA50, MA200 |
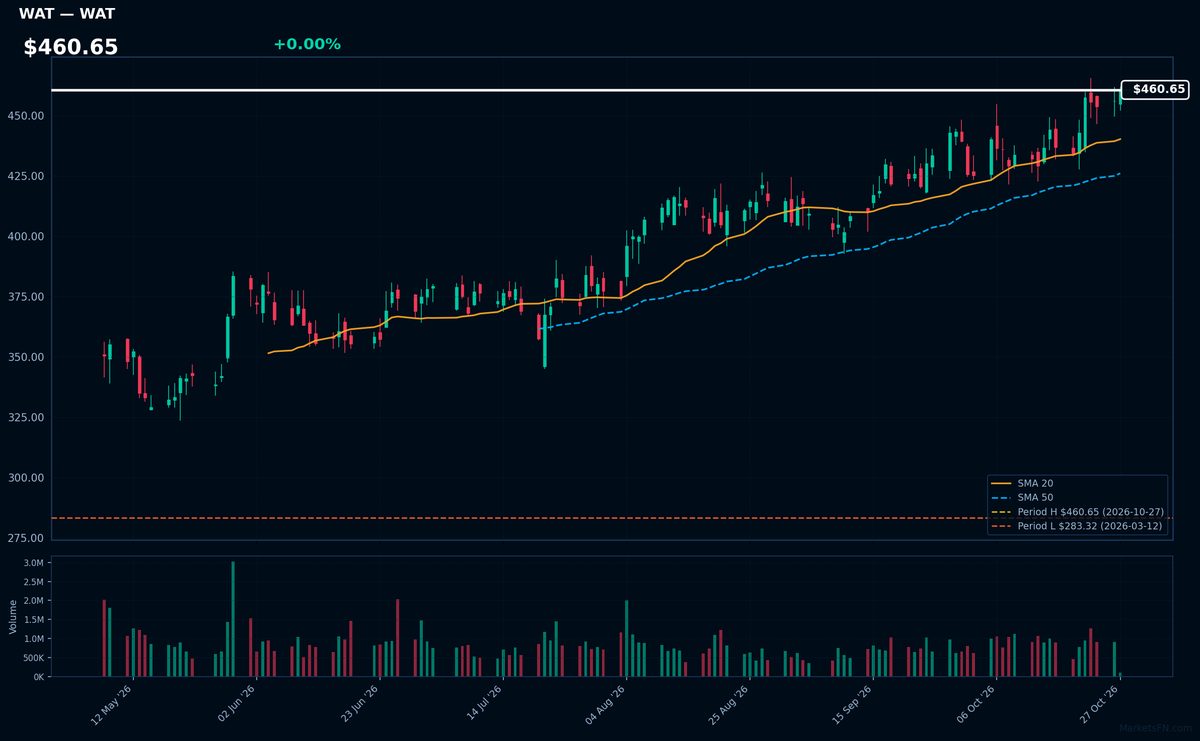
WAT | Waters Corp | Healthcare | Price Last: $460.65 | % Realized: +30.96% | RSI: 66.3 | % above MA200: +25.1% | Trend: Above MA20, MA50, MA200
Waters Corp specializes in analytical instruments (chromatography, mass spectrometry) and software for life sciences, pharmaceuticals, and industrial labs. Investors care due to its critical role in drug development, quality control, and regulatory compliance — sectors with steady demand and high margins.
Technically bullish: RSI(14) at 66.3 shows strong momentum without overbought conditions, while the price ($460.65) sits above a stacked MA20>MA50>MA200 — confirming the 31.0% 52-week uptrend. Near 52-week highs, but no divergence yet.
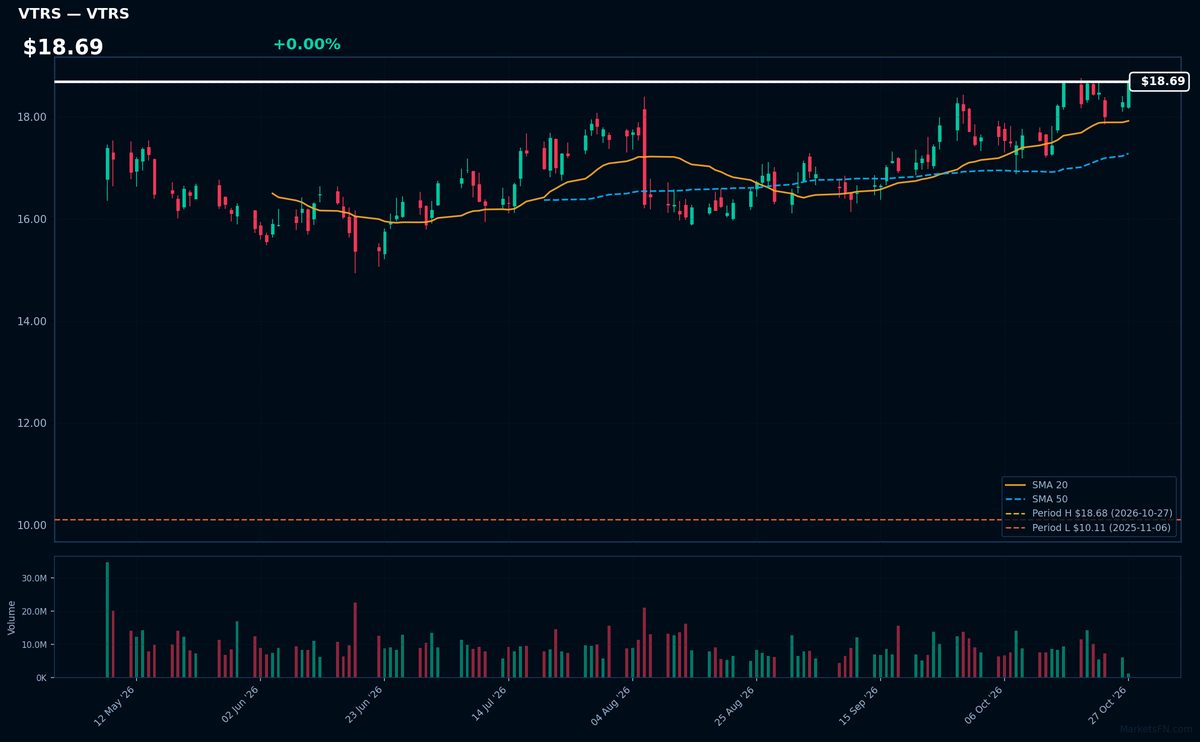
VTRS | Viatris Inc | Healthcare | Price Last: $18.68 | % Realized: +79.32% | RSI: 62.0 | % above MA200: +18.2% | Trend: Above MA20, MA50, MA200
Viatris (VTRS) is a global pharmaceutical company specializing in off-patent branded and generic drugs, biosimilars, and active pharmaceutical ingredients. Investors care for its stable cash flows from essential medicines and strategic focus on expanding access in emerging markets.
Technically bullish with RSI(14) at 62.0 and price > MA20 > MA50 > MA200. The 79.3% 52-week return and 0.0% below 52-week high suggest strong momentum, though RSI nears overbought territory.
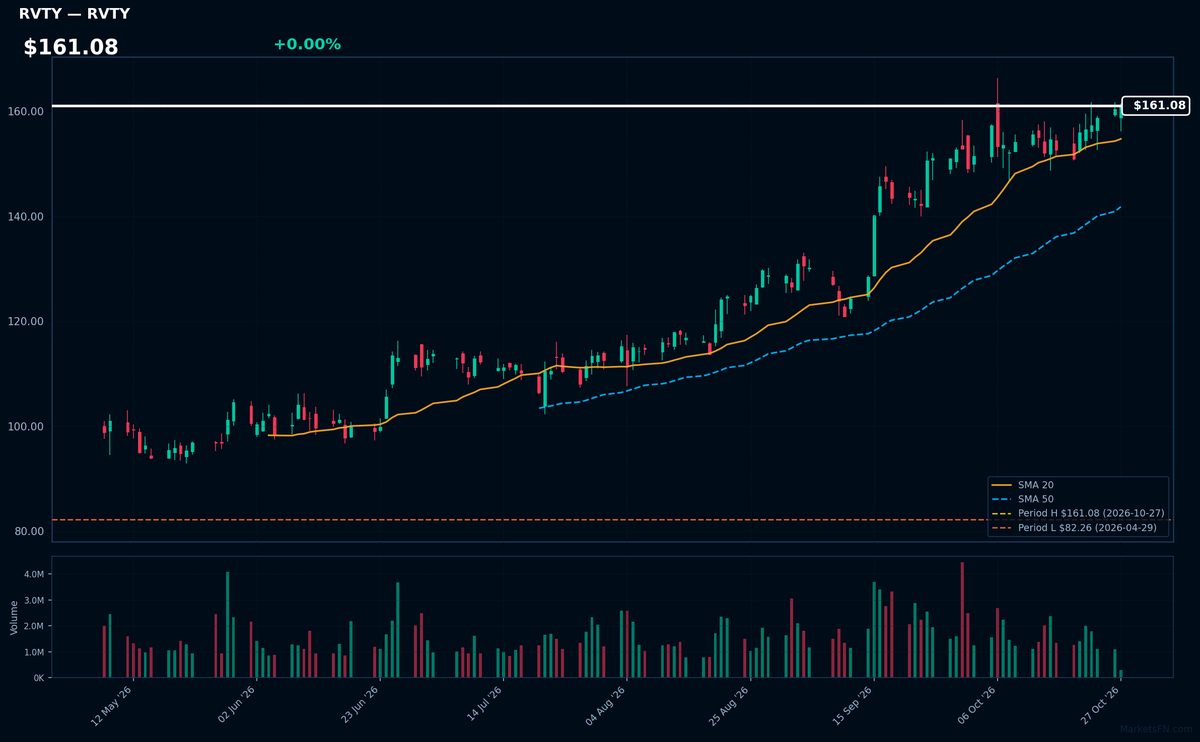
RVTY | Revvity Inc | Healthcare | Price Last: $161.08 | % Realized: +65.79% | RSI: 68.4 | % above MA200: +45.0% | Trend: Above MA20, MA50, MA200
Revvity Inc specializes in life sciences and diagnostics technologies, providing tools for drug discovery, genetic analysis, and diagnostics. Investors care due to its exposure to high-growth healthcare R&D and precision medicine markets.
Technically, RVTY shows strong momentum with bullish MA alignment (price > MA20 > MA50 > MA200) and RSI(14) at 68.4, nearing overbought. The stock is 0.0% below its 52-week high after a 65.8% rally, suggesting continuation potential but requiring caution at extended levels.
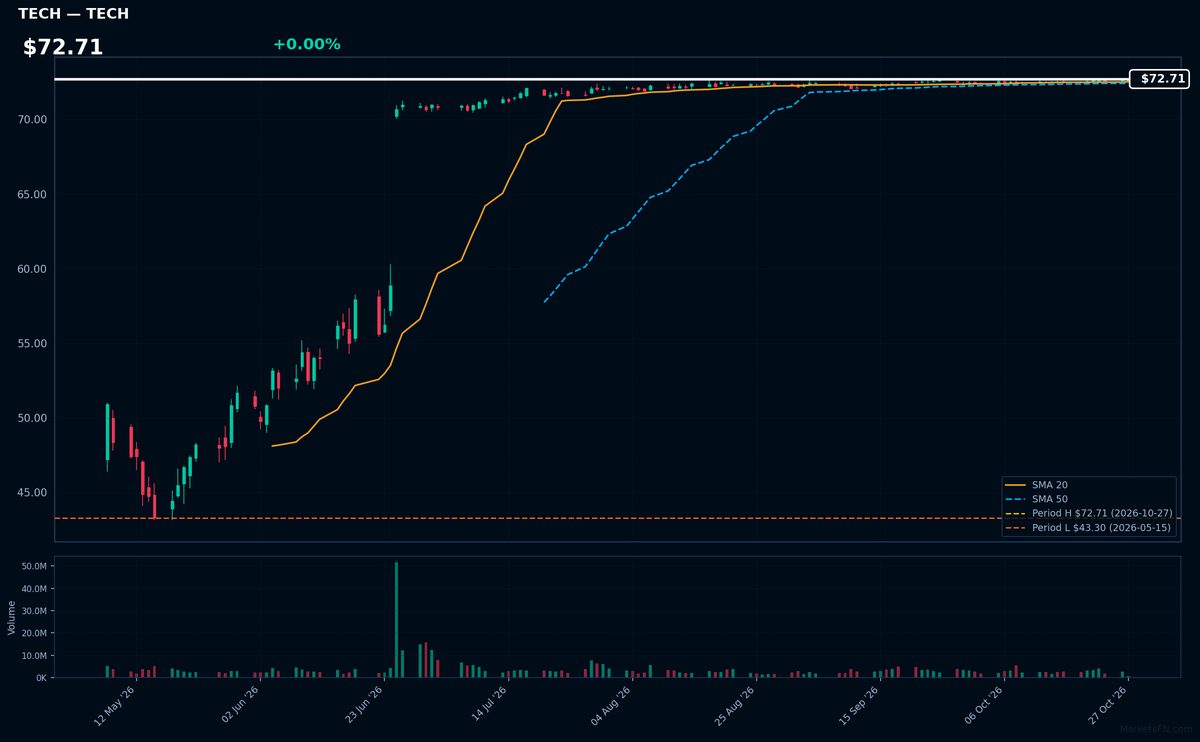
TECH | Bio-Techne Corp | Healthcare | Price Last: $72.71 | % Realized: +13.18% | RSI: 61.5 | % above MA200: +15.3% | Trend: Above MA20, MA50, MA200
Bio-Techne develops specialized reagents, instruments, and diagnostic tools for life science research and clinical labs. Investors should note its critical role in biopharma workflows, particularly in protein analysis and cell biology, supporting drug development and precision medicine.
Technically bullish: $72.71 price holds above rising MAs (20/50/200), RSI(14) at 61.5 suggests controlled momentum. At 52-week highs (+13.2% YoY), watch for breakout confirmation.
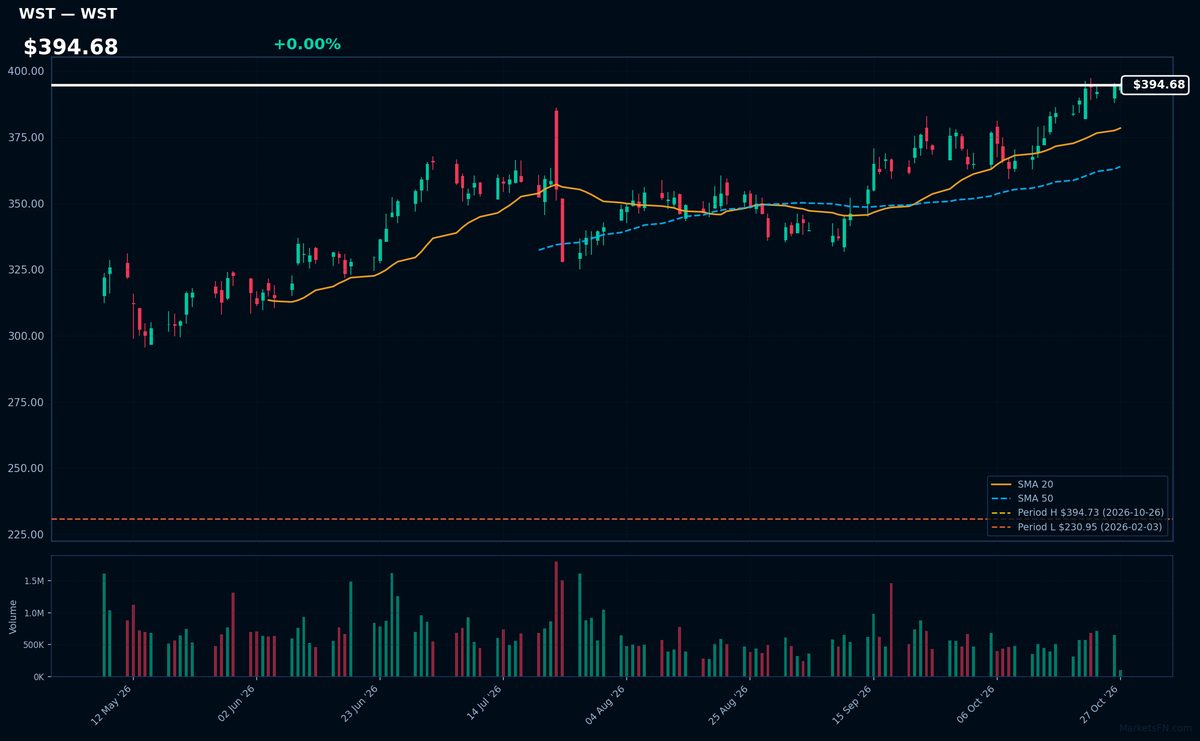
WST | West Pharmaceutical Services, Inc | Healthcare | Price Last: $394.68 | % Realized: +37.41% | RSI: 70.4 | % above MA200: +26.8% | Trend: Above MA20, MA50, MA200
West Pharmaceutical Services designs high-value containment and delivery systems for injectable drugs, including COVID-19 vaccines. Investors care because its proprietary packaging solutions dominate biologics and generics markets, with recurring revenue from consumables driving 37.4% annual returns.
Technically bullish with RSI(14) at 70.4 and price > MA20 > MA50 > MA200. The stock tests its 52-week high (0.0% below), suggesting momentum but overbought risk. The 37.4% annual return confirms strength but warrants caution near extremes.
📉 Nearest to 52-Week Low
Sectors represented: Communication Services (1), Technology (1), Consumer Cyclical (1), Industrials (1), Real Estate (1)
| Ticker | Company | Sector | Price Last | % Realized | 52-Week Low Date | RSI | % above MA200 | Trend |
|---|---|---|---|---|---|---|---|---|
| NFLX | Netflix Inc | Communication Services | $63.06 | -42.39% | 2026-10-27 | 32.0 | -23.1% | Below MA20, MA50, MA200 |
| UBER | Uber Technologies Inc | Technology | $65.82 | -31.74% | 2026-10-27 | 36.4 | -10.6% | Below MA20, MA50, MA200 |
| BKNG | Booking Holdings Inc | Consumer Cyclical | $151.65 | -27.84% | 2026-10-27 | 33.9 | -14.7% | Below MA20, MA50, MA200 |
| BA | Boeing Co | Industrials | $171.31 | -23.18% | 2026-10-27 | 27.1 | -21.4% | Below MA20, MA50, MA200 |
| CBRE | CBRE Group Inc | Real Estate | $122.41 | -24.03% | 2026-10-27 | 34.2 | -14.0% | Below MA20, MA50, MA200 |
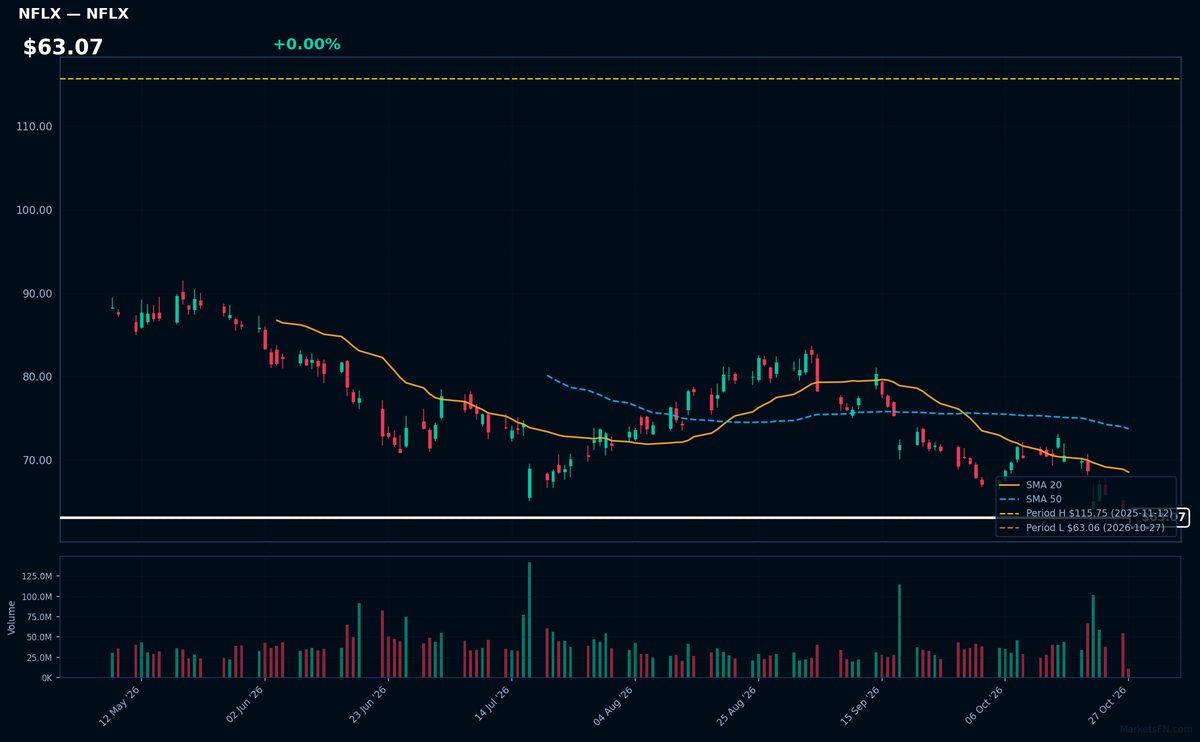
NFLX | Netflix Inc | Communication Services | Price Last: $63.06 | % Realized: -42.39% | RSI: 32.0 | % above MA200: -23.1% | Trend: Below MA20, MA50, MA200
Netflix Inc operates a global streaming platform with 220M+ subscribers, pioneering direct-to-consumer entertainment. Investors care because its scale and content spend ($17B annually) create durable advantages in the shift from linear TV to on-demand viewing, though profitability remains pressured by competition.
Netflix shows extreme technical weakness: RSI(14) at 32.0 (nearing oversold) with bearish MA alignment (price < MA20 < MA50 < MA200). The stock tests 52-week lows (-42.4% return) — a warning sign unless fundamentals reverse.
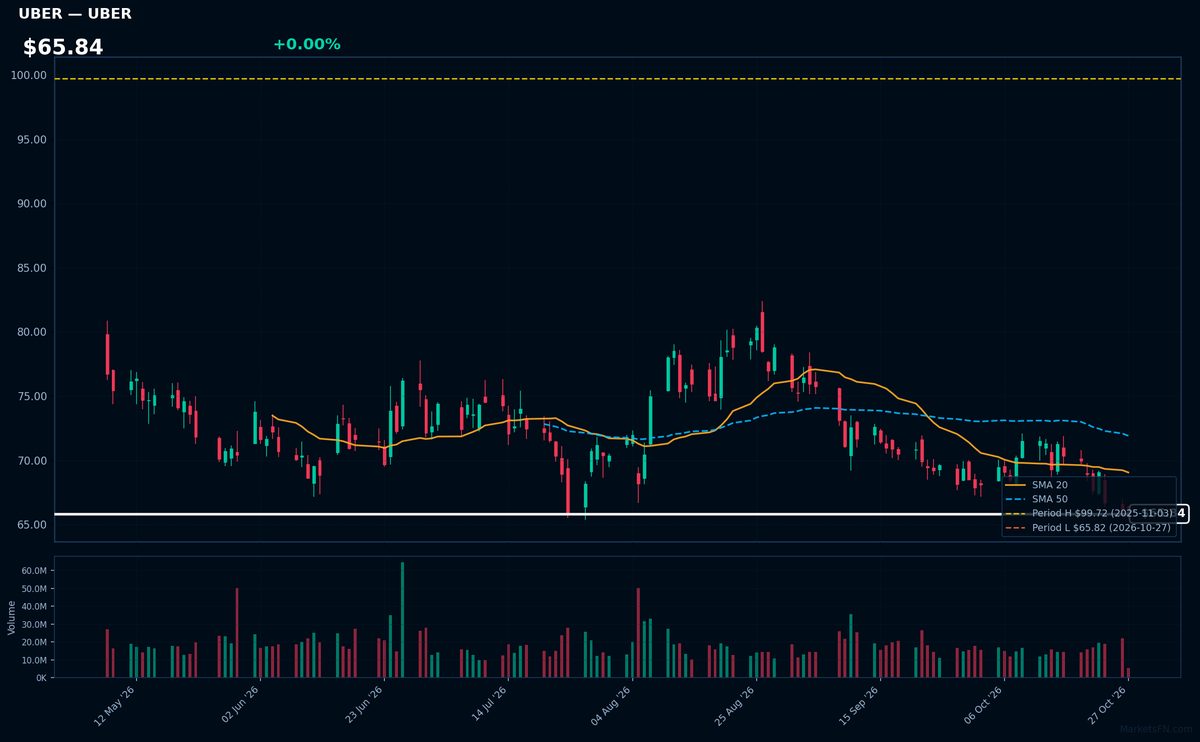
UBER | Uber Technologies Inc | Technology | Price Last: $65.82 | % Realized: -31.74% | RSI: 36.4 | % above MA200: -10.6% | Trend: Below MA20, MA50, MA200
Uber operates a global mobility platform connecting riders with drivers and a delivery network for restaurants/groceries. Investors care about its dominant market share in ride-hailing, expanding delivery margins, and path to profitability as urban mobility recovers post-pandemic.
Technically concerning with RSI(14) at 36.4 and bearish MA alignment (price < MA20 < MA50 < MA200). Stock tests 52-week lows, down 31.7% — clear warning sign of sustained downtrend.
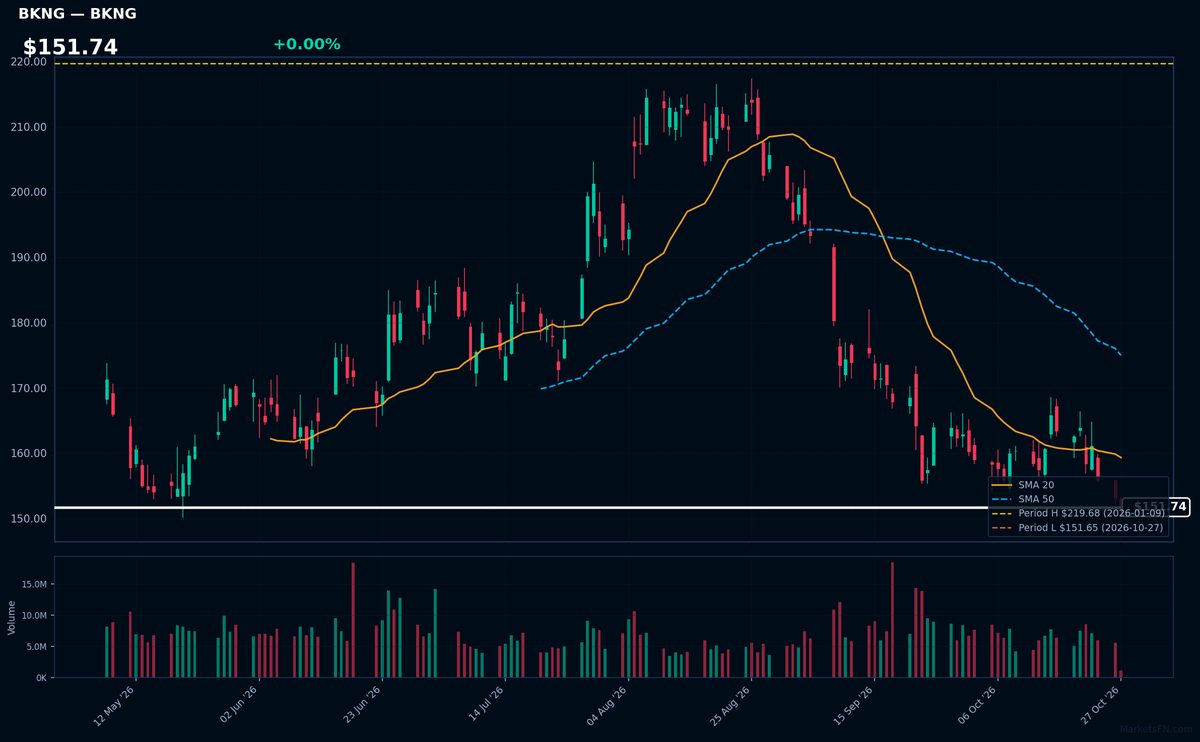
BKNG | Booking Holdings Inc | Consumer Cyclical | Price Last: $151.65 | % Realized: -27.84% | RSI: 33.9 | % above MA200: -14.7% | Trend: Below MA20, MA50, MA200
Booking Holdings operates leading online travel platforms (Booking.com, Priceline, Kayak) connecting travelers with accommodations, flights, and rental cars. Investors care due to its global scale in the high-margin travel sector, though cyclical demand exposes it to economic downturns.
Technically concerning: RSI(14) at 33.9 shows near-oversold conditions, but bearish MA alignment (price < MA20 < MA50 < MA200) confirms sustained downtrend. Stock tests 52-week low support after a -27.8% annual decline.
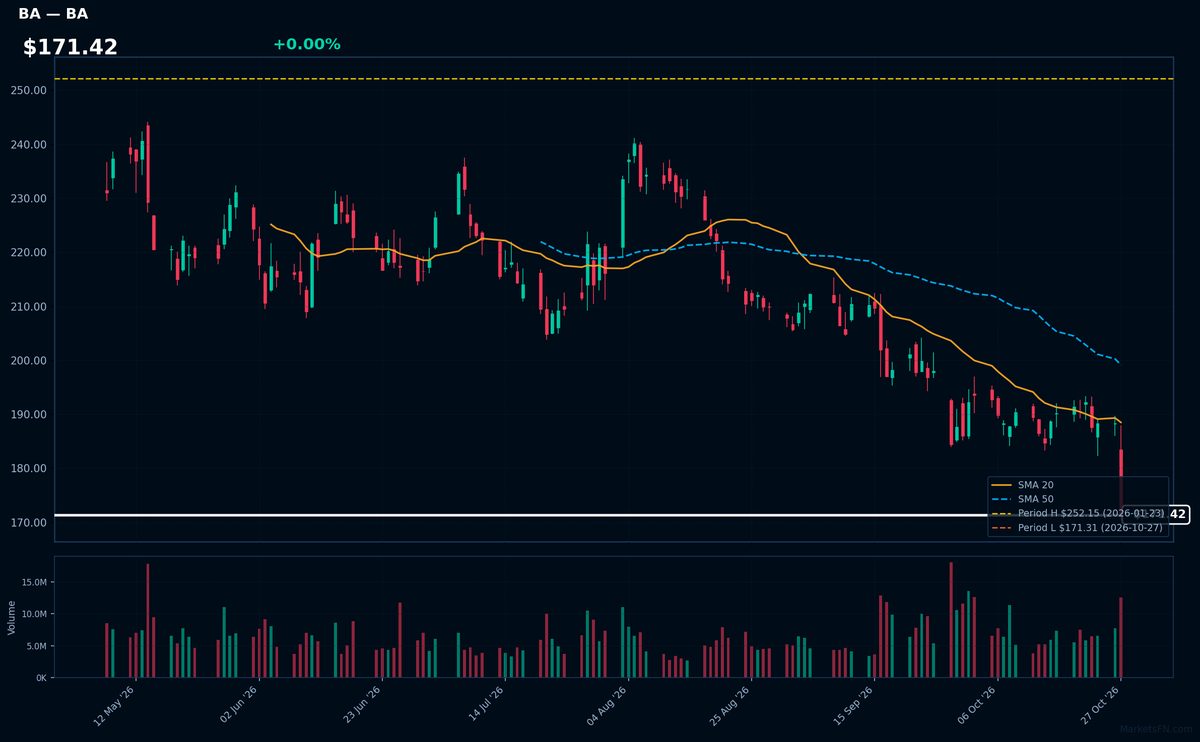
BA | Boeing Co | Industrials | Price Last: $171.31 | % Realized: -23.18% | RSI: 27.1 | % above MA200: -21.4% | Trend: Below MA20, MA50, MA200
Boeing designs and manufactures commercial jetliners, defense systems, and space technologies. Investors watch BA as a proxy for global aerospace demand, airline industry health, and defense spending, though its 737 MAX crises and supply chain issues create volatility.
Technically distressed: RSI(14) at 27.1 (oversold) with bearish MA alignment (price < MA20 < MA50 < MA200). Testing 52-week lows after -23.2% annual decline signals capitulation, not momentum.
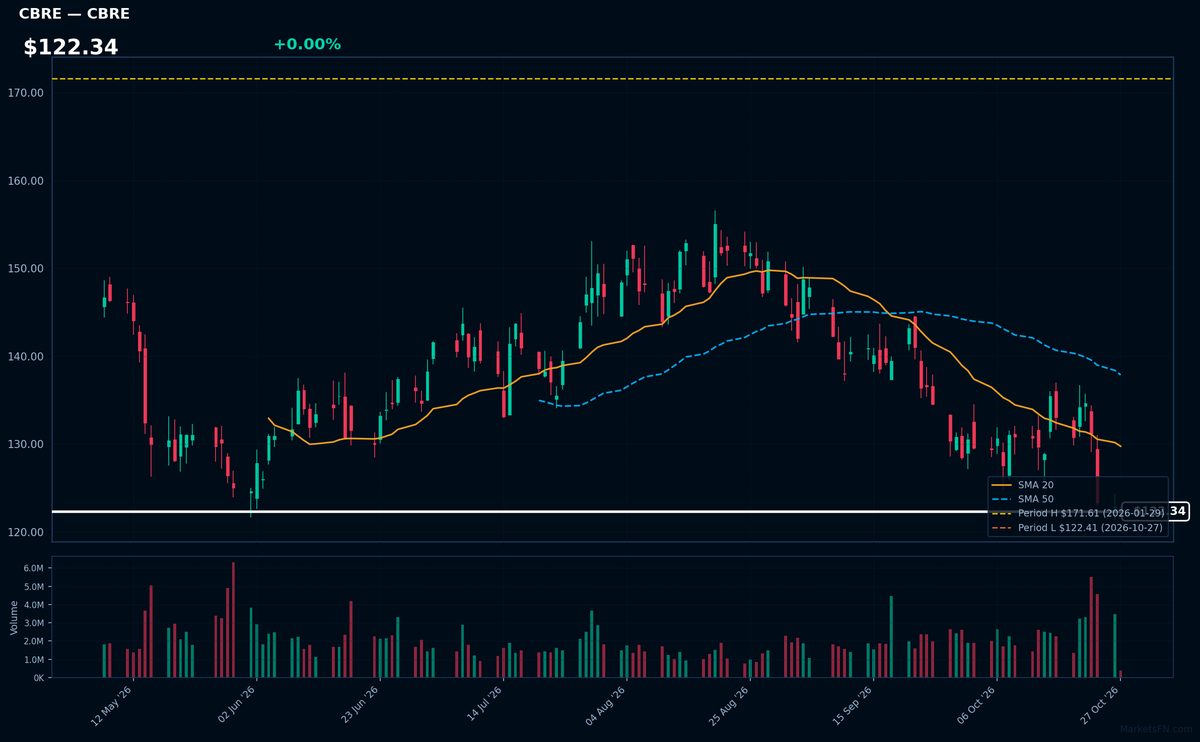
CBRE | CBRE Group Inc | Real Estate | Price Last: $122.41 | % Realized: -24.03% | RSI: 34.2 | % above MA200: -14.0% | Trend: Below MA20, MA50, MA200
CBRE Group Inc is a global commercial real estate services firm offering advisory, property management, and investment management. Investors care because its performance reflects commercial real estate health—a key economic indicator with direct ties to corporate expansion, retail trends, and office demand.
CBRE shows bearish momentum: RSI(14) at 34.2 (near oversold), with price ($122.34) below MA20/50/200 in sustained downtrend. At 0.0% above 52-week lows after -24.0% annual return, it tests critical support—a warning sign absent fundamental catalysts.
Market Commentary
The clustering of S&P 500 stocks at 52-week extremes reflects heightened market polarization, with healthcare/life sciences names (WAT, RVTY, TECH, WST) and VTRS at peak valuations while cyclical/consumer discretionary stocks (NFLX, UBER, BKNG, BA, CBRE) languish near troughs. This divergence suggests investor preference for defensive growth sectors amid macroeconomic uncertainty, with biotech tools and pharma services perceived as resilient, while travel, streaming, and aerospace face demand concerns.
Sector rotation trends reveal a risk-off tilt favoring stable cash flows in life sciences (Waters Corp, West Pharma) and generics (Viatris), while pandemic-reopening beneficiaries (Booking, Uber) and Boeing's operational challenges weigh on their cohorts. The uniformity of these extremes—all within 0.0% of their bounds—indicates technical momentum may be nearing exhaustion, particularly for healthcare stocks trading at peak multiples.
Key levels to monitor are the 52-week highs ($WAT, $VTRS, $RVTY, $TECH, $WST) for breakout confirmations or reversals, and the 52-week lows ($NFLX, $UBER, $BKNG, $BA, $CBRE) for either breakdowns or mean-reversion bounces. Near-term catalysts include earnings revisions for biotech tools firms and travel demand indicators for discretionary names. Any macro shift in interest rate expectations could force a rotation between these groups.
Methodology: All 503 S&P 500 constituents screened. 52-week high = highest daily close over the past 252 trading days (approx. 1 year). 52-week low = lowest daily close over the same period. Distance = (current price / extreme − 1) × 100. Technical indicators computed on up to 1 year of daily OHLCV data.
Disclaimer: For informational purposes only. Not investment advice. Past performance is not indicative of future results.