S&P 500 2026 YTD Highs & Lows Radar: Berkshire Hathaway (BRK-B), Netflix (NFLX) and more
MarketsFN Team

Screening all 503 S&P 500 constituents for stocks nearest to their 2026 year-to-date high and their 2026 YTD low. Data as of October 27, 2026. % Realized = total return since Jan 1 2026.
Legend: RSI > 70 = overbought · RSI < 30 = oversold · Green % Realized = positive YTD return · Red = negative.
📈 Nearest to 2026 High
Sectors represented: Energy (2), Financial (1), Healthcare (1), Industrials (1)
| Ticker | Company | Sector | Price Last | % Realized | 2026 YTD High Date | RSI | % above MA200 | Trend |
|---|---|---|---|---|---|---|---|---|
| BRK-B | Berkshire Hathaway Inc | Financial | $548.56 | +10.41% | 2026-10-26 | 69.5 | +10.8% | Above MA20, MA50, MA200 |
| XOM | Exxon Mobil Corp | Energy | $184.54 | +50.46% | 2026-10-26 | 70.7 | +20.0% | Above MA20, MA50, MA200 |
| GILD | Gilead Sciences, Inc | Healthcare | $158.69 | +30.50% | 2026-10-26 | 59.0 | +14.0% | Above MA20, MA50, MA200 |
| COP | Conoco Phillips | Energy | $151.37 | +56.54% | 2026-10-26 | 70.5 | +25.6% | Above MA20, MA50, MA200 |
| CTAS | Cintas Corporation | Industrials | $225.93 | +22.20% | 2026-10-26 | 51.9 | +19.0% | Above MA20, MA50, MA200 |
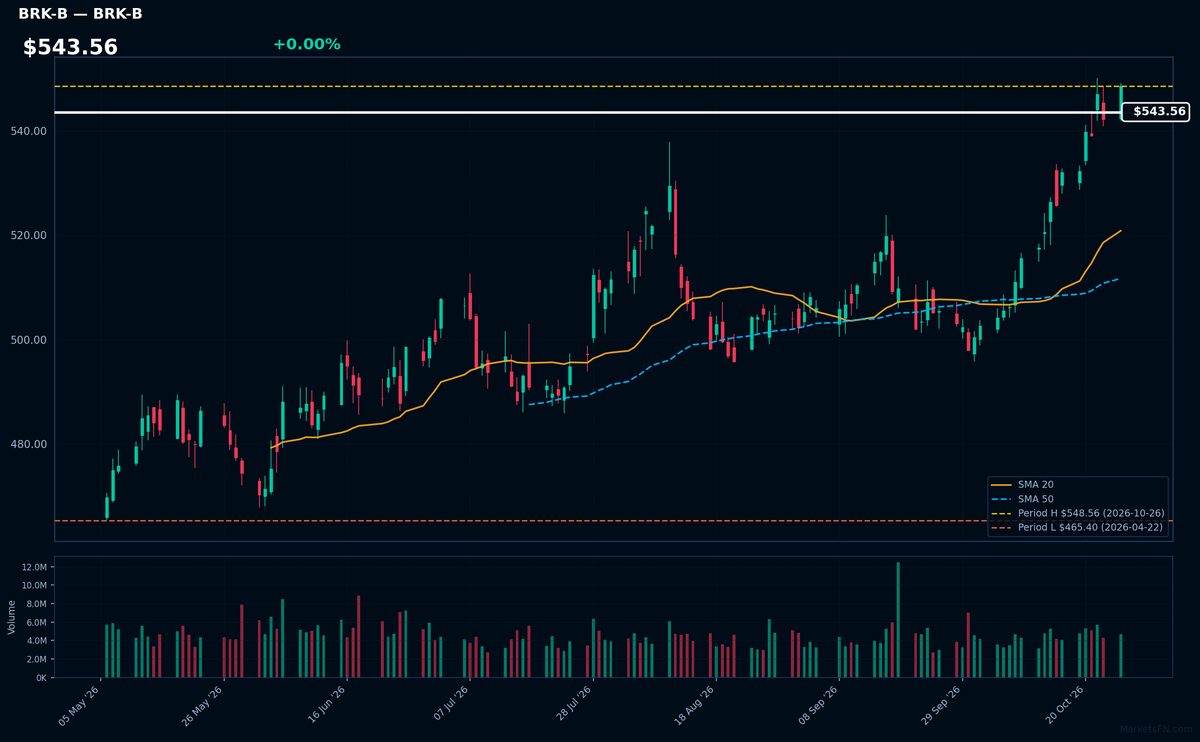
BRK-B | Berkshire Hathaway Inc | Financial | Price Last: $548.56 | % Realized: +10.41% | RSI: 69.5 | % above MA200: +10.8% | Trend: Above MA20, MA50, MA200
Berkshire Hathaway is a diversified holding company with major insurance operations (GEICO, reinsurance) and wholly owned businesses across railroads (BNSF), energy, manufacturing, and retail. Investors care for its unique capital allocation under Warren Buffett and now Greg Abel, compounding value through acquisitions and public equities like Apple.
Technically bullish with RSI(14) at 69.5 (near overbought) and price > MA20 > MA50 > MA200. The stock is flat YTD (+10.4%) but testing 2026 highs—watch for breakout confirmation or pullback given elevated RSI.
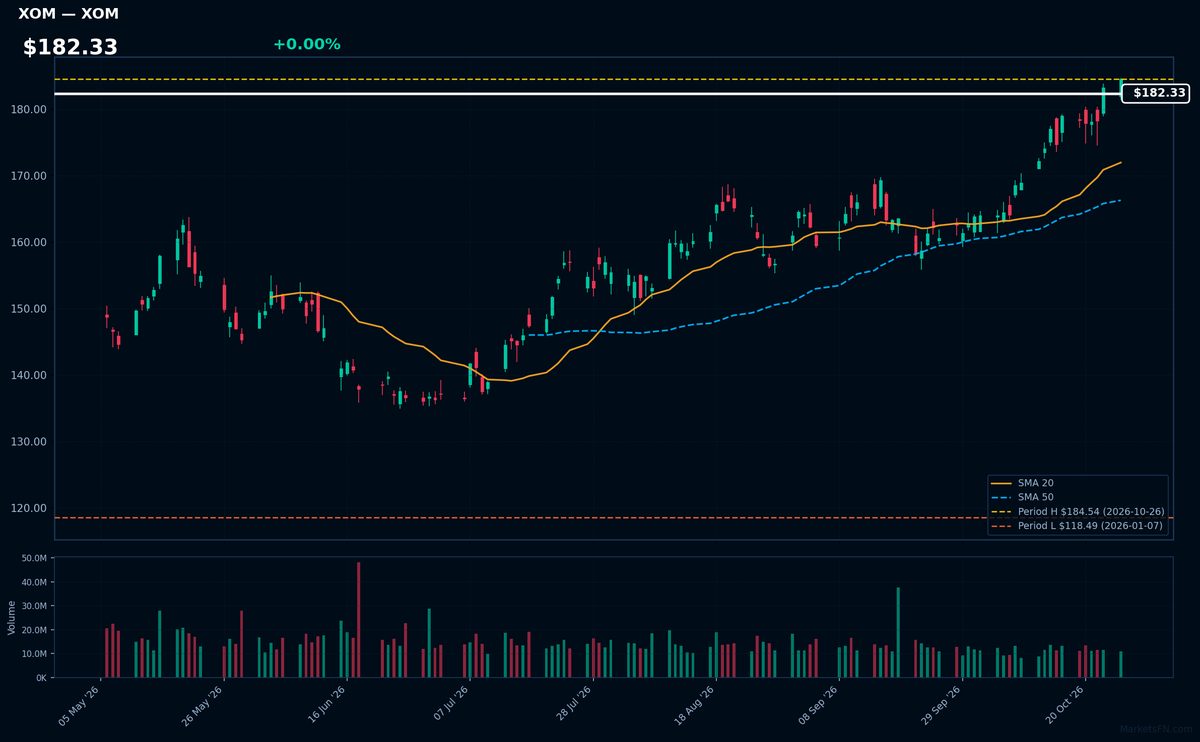
XOM | Exxon Mobil Corp | Energy | Price Last: $184.54 | % Realized: +50.46% | RSI: 70.7 | % above MA200: +20.0% | Trend: Above MA20, MA50, MA200
Exxon Mobil Corp explores, produces, and refines oil/gas globally. Investors care because its integrated model (upstream to downstream) provides stability during price swings, and its scale enables massive cash flows for dividends/buybacks—critical in energy investing where capital discipline separates winners.
Technically bullish (price $182.33 > MA20 > MA50 > MA200) with extreme momentum (RSI 70.7, YTD +50.5%). Near 2026 highs (0.0% below), this suggests overbought conditions that could precede either continuation or pullback—watch for breakout confirmation.
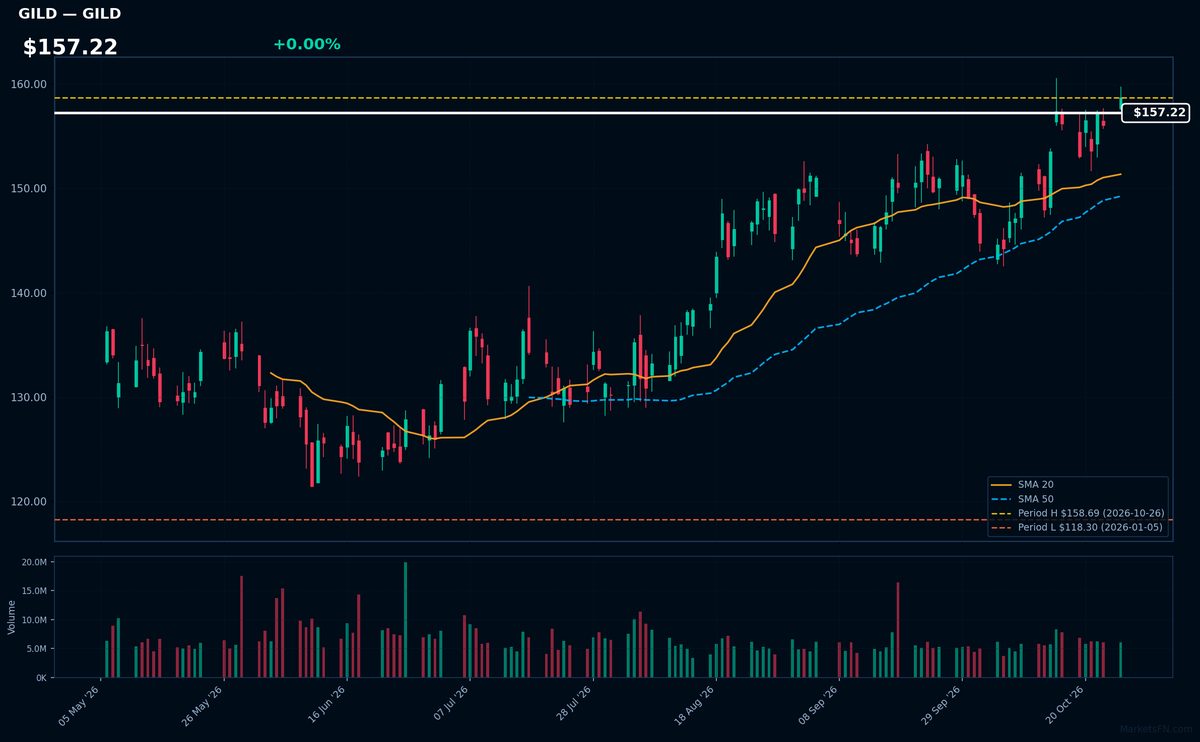
GILD | Gilead Sciences, Inc | Healthcare | Price Last: $158.69 | % Realized: +30.50% | RSI: 59.0 | % above MA200: +14.0% | Trend: Above MA20, MA50, MA200
Gilead Sciences develops antiviral drugs (notably HIV/hepatitis C treatments) and oncology therapies. Investors care because its specialty pharmaceuticals command premium pricing with durable demand, offsetting patent cliffs through pipeline innovation in cell therapies and inflammation drugs.
Technically bullish with RSI(14) at 59.0 and price > MA20 > MA50 > MA200 — sustained uptrend at YTD highs (+30.5% YTD). The 0.0% gap to YTD peak suggests breakout potential, though RSI nears overbought territory.
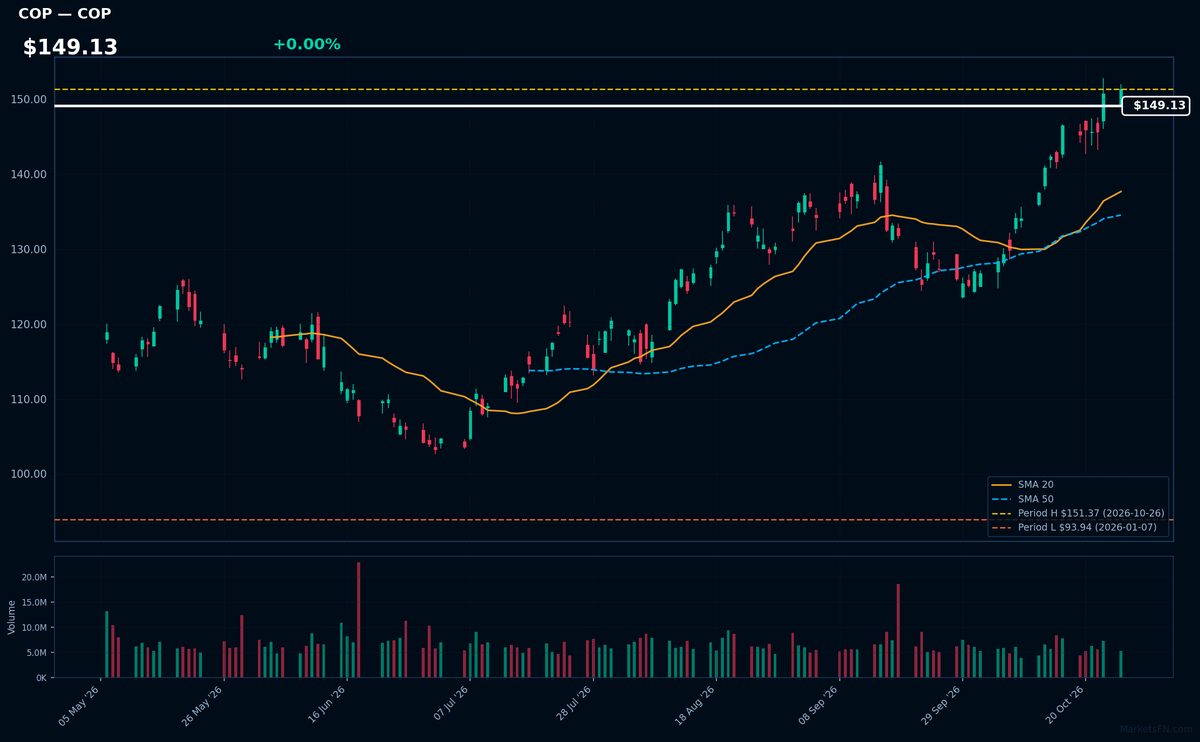
COP | Conoco Phillips | Energy | Price Last: $151.37 | % Realized: +56.54% | RSI: 70.5 | % above MA200: +25.6% | Trend: Above MA20, MA50, MA200
ConocoPhillips (COP) explores and produces crude oil/natural gas globally, with major US shale operations. Investors care because its 56.5% YTD return reflects direct leverage to energy prices and efficient operations in volatile markets.
Technically overbought (RSI 70.5) but bullish MA alignment (price > MA20 > MA50 > MA200) suggests sustained momentum. At 0.0% below YTD highs, watch for breakout confirmation.
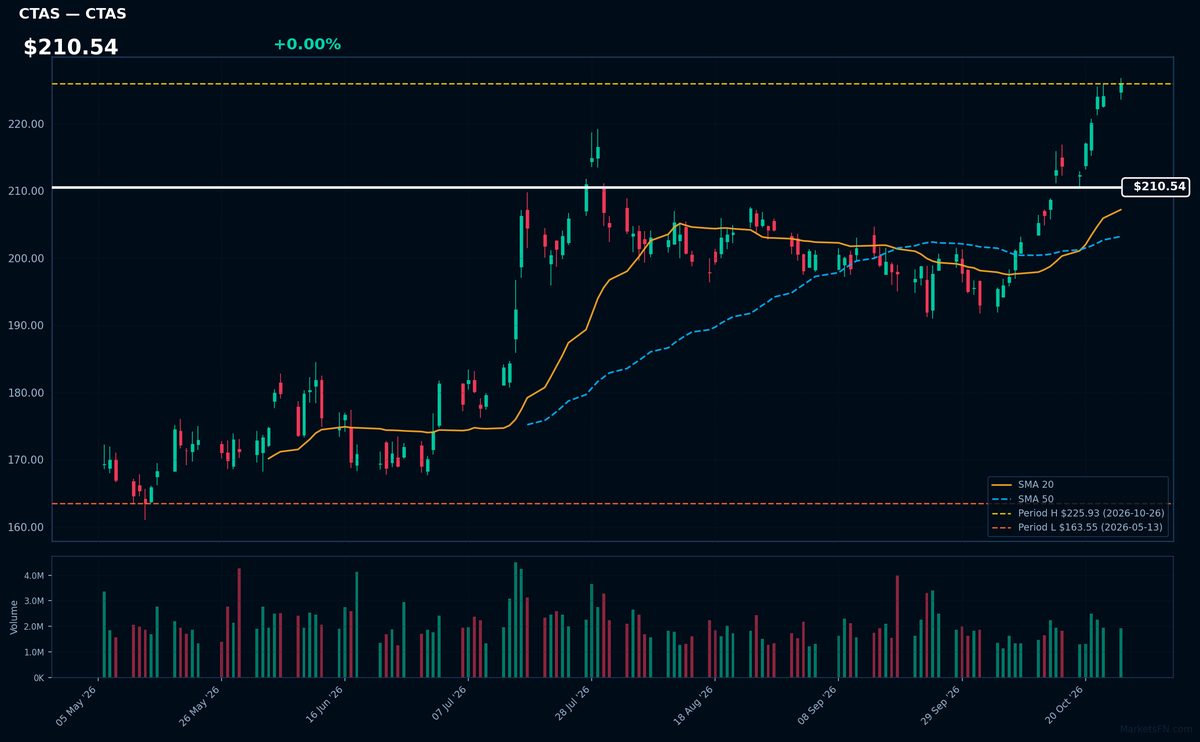
CTAS | Cintas Corporation | Industrials | Price Last: $225.93 | % Realized: +22.20% | RSI: 51.9 | % above MA200: +19.0% | Trend: Above MA20, MA50, MA200
Cintas Corporation provides corporate uniforms and business services, including facility supplies and safety products, with high recurring revenue and strong margins, making it a stable growth investment.
CTAS shows bullish momentum: RSI(14) at 51.9 (neutral), price > MA20 > MA50 > MA200 in a 22.2% YTD uptrend, now 0.0% below its 2026 high—a potential breakout setup.
📉 Nearest to 2026 Low
Sectors represented: Communication Services (2), Consumer Cyclical (1), Industrials (1), Real Estate (1)
| Ticker | Company | Sector | Price Last | % Realized | 2026 YTD Low Date | RSI | % above MA200 | Trend |
|---|---|---|---|---|---|---|---|---|
| NFLX | Netflix Inc | Communication Services | $63.90 | -29.77% | 2026-10-26 | 32.1 | -22.1% | Below MA20, MA50, MA200 |
| BKNG | Booking Holdings Inc | Consumer Cyclical | $153.14 | -28.08% | 2026-10-26 | 33.6 | -13.9% | Below MA20, MA50, MA200 |
| PCAR | Paccar Inc | Industrials | $104.37 | -6.44% | 2026-10-26 | 32.9 | -13.3% | Below MA20, MA50, MA200 |
| CBRE | CBRE Group Inc | Real Estate | $122.88 | -23.29% | 2026-10-26 | 34.4 | -13.6% | Below MA20, MA50, MA200 |
| CHTR | Charter Communications Inc | Communication Services | $102.18 | -51.18% | 2026-10-26 | 39.9 | -38.6% | Below MA20, MA50, MA200 |
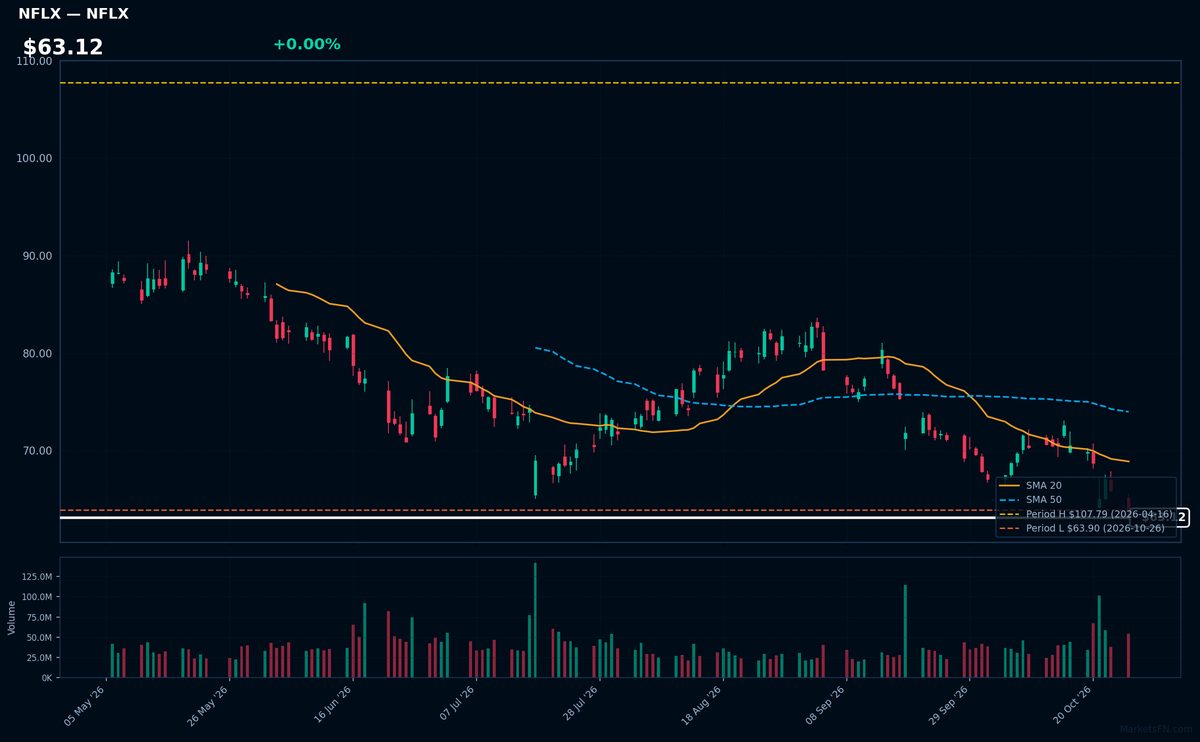
NFLX | Netflix Inc | Communication Services | Price Last: $63.90 | % Realized: -29.77% | RSI: 32.1 | % above MA200: -22.1% | Trend: Below MA20, MA50, MA200
Netflix Inc dominates global streaming with 247M subscribers, monetizing content through subscriptions. Investors care due to its pricing power, original content moat, and international growth potential in an increasingly digital entertainment landscape.
Netflix shows severe technical weakness: RSI(14) at 32.1 signals near-oversold, while the bearish MA alignment (price < MA20 < MA50 < MA200) confirms sustained downtrend. The stock tests critical support after plunging 29.8% YTD.
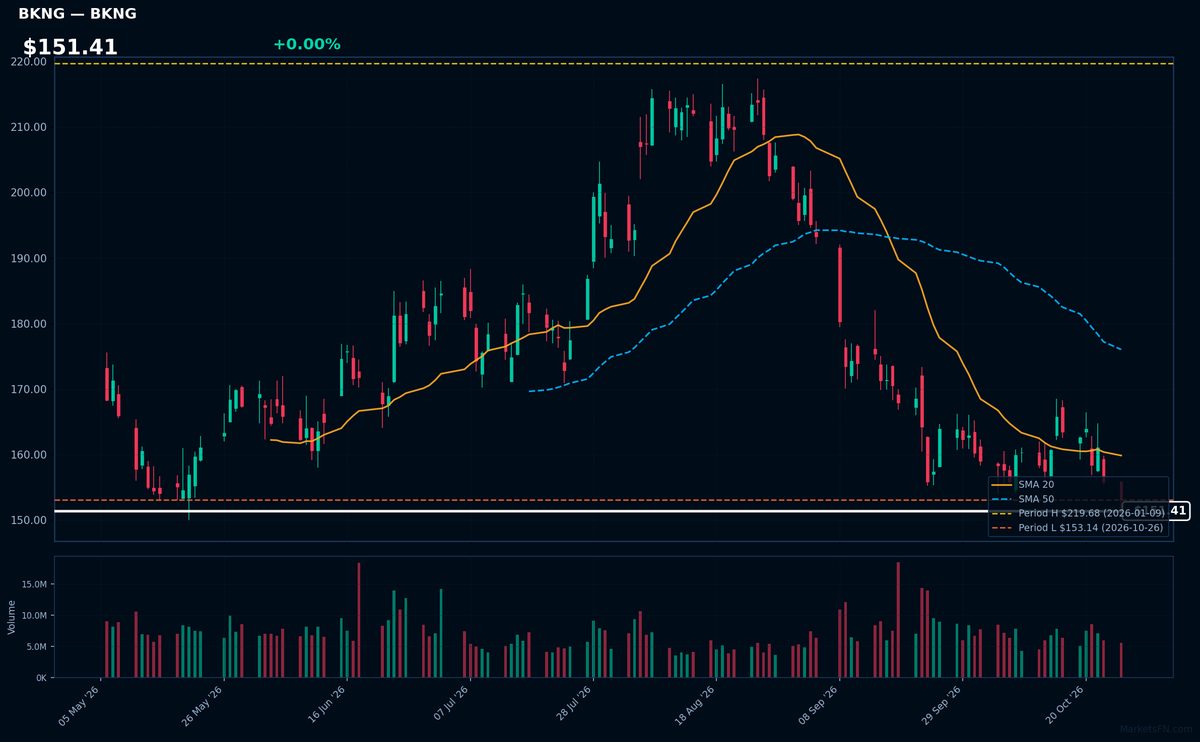
BKNG | Booking Holdings Inc | Consumer Cyclical | Price Last: $153.14 | % Realized: -28.08% | RSI: 33.6 | % above MA200: -13.9% | Trend: Below MA20, MA50, MA200
Booking Holdings operates leading online travel platforms (Booking.com, Priceline, Kayak) connecting travelers with accommodations, flights, and rental cars. Investors care because it dominates global online travel with high-margin agency/merchant models, though cyclical exposure remains.
Severe technical warning: RSI(14) at 33.6 shows oversold conditions amid bearish MA alignment (price < MA20 < MA50 < MA200). Stock tests 2026 lows (-28.1% YTD) with 0.0% buffer above YTD low — breakdown risk elevated.
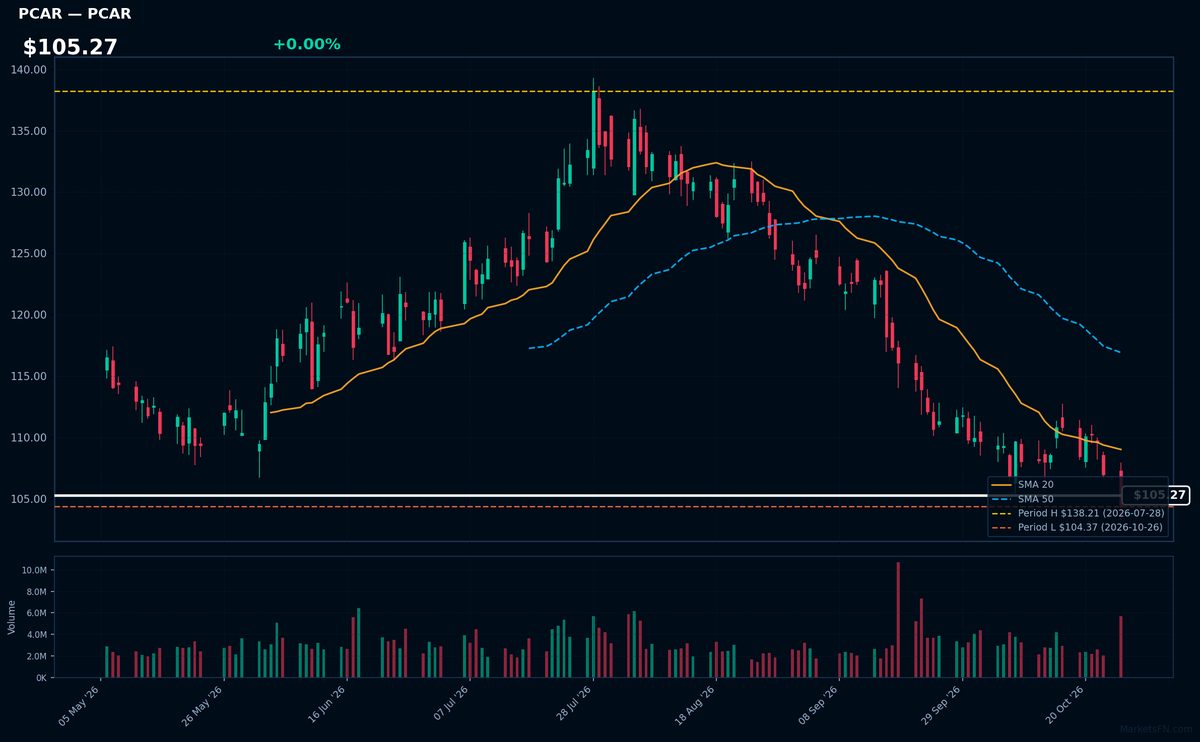
PCAR | Paccar Inc | Industrials | Price Last: $104.37 | % Realized: -6.44% | RSI: 32.9 | % above MA200: -13.3% | Trend: Below MA20, MA50, MA200
Paccar Inc designs/manufactures premium trucks under Kenworth, Peterbilt, and DAF brands, serving commercial freight markets. Investors watch PCAR as a cyclical bellwether for North American/European transport demand and manufacturing margins.
PCAR shows bearish momentum: RSI(14) at 32.9 signals near-oversold conditions, while sustained downtrend (price < MA20 < MA50 < MA200) and -6.4% YTD decline test critical support at 2026 lows.
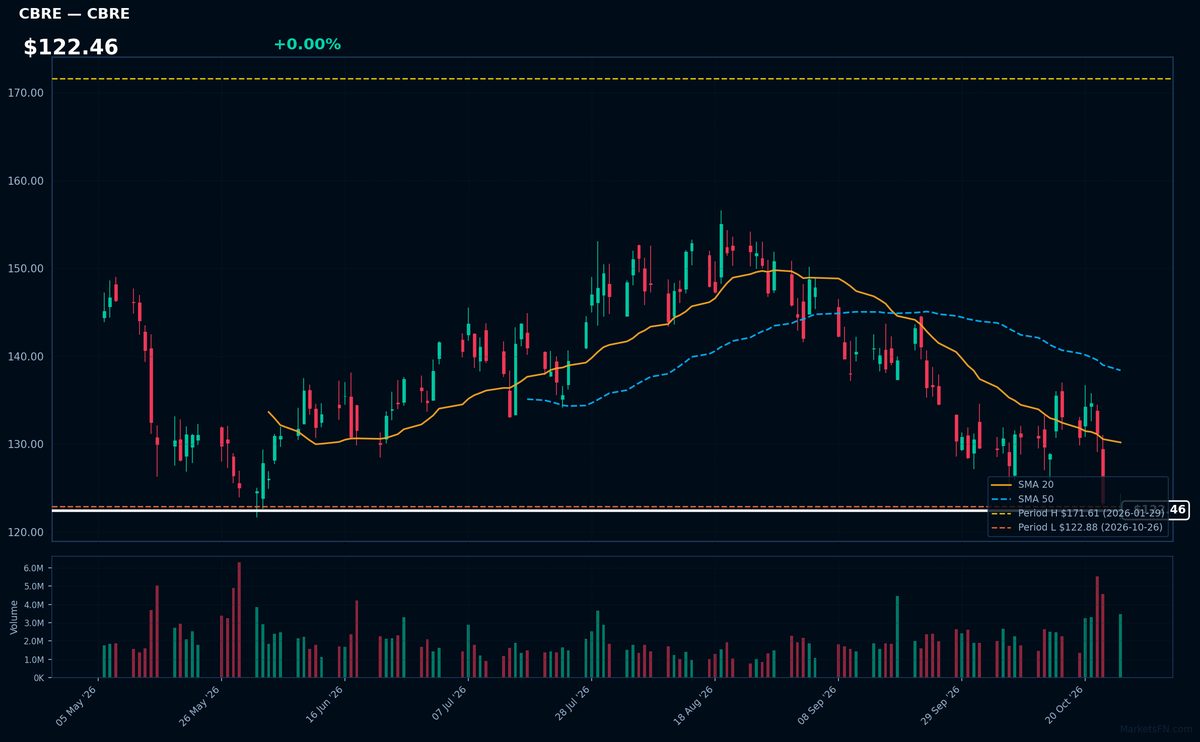
CBRE | CBRE Group Inc | Real Estate | Price Last: $122.88 | % Realized: -23.29% | RSI: 34.4 | % above MA200: -13.6% | Trend: Below MA20, MA50, MA200
CBRE Group Inc provides commercial real estate services including property sales, leasing, and advisory. Investors care because its global scale and cyclical exposure make it a bellwether for commercial property markets, with revenue tied to transaction volumes and asset values.
CBRE shows severe technical weakness: RSI(14) at 34.4 confirms oversold conditions amid a bearish MA alignment (price < MA20 < MA50 < MA200). The stock tests 2026 lows after a 23.3% YTD plunge — a clear warning sign lacking fundamental support in this data.
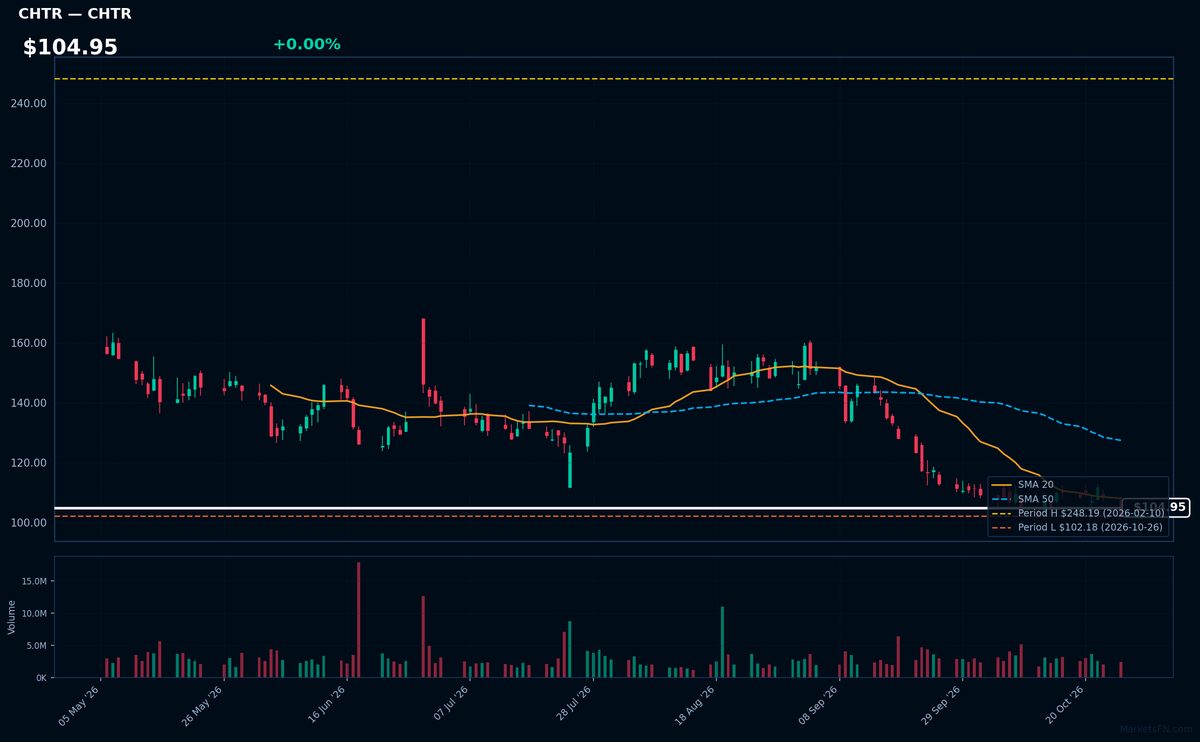
CHTR | Charter Communications Inc | Communication Services | Price Last: $102.18 | % Realized: -51.18% | RSI: 39.9 | % above MA200: -38.6% | Trend: Below MA20, MA50, MA200
Charter Communications Inc provides cable TV, broadband internet, and telephone services to residential/commercial customers under the Spectrum brand. Investors watch CHTR as a leading US broadband provider with recurring revenue streams, though facing cord-cutting pressures and high debt.
CHTR shows extreme technical weakness: RSI(14) at 39.9, bearish MA alignment (price < MA20 < MA50 < MA200), and down 51.2% YTD — testing critical support at YTD lows. Clear warning sign.
Market Commentary
The S&P 500 stocks trading at their 2026 highs (BRK-B, XOM, GILD, COP, CTAS) and lows (NFLX, BKNG, PCAR, CBRE, CHTR) reflect divergent market leadership. Stocks at highs suggest strong investor confidence in energy (XOM, COP), healthcare (GILD), and industrial services (CTAS), while those near lows indicate pressure on consumer discretionary (NFLX, BKNG) and communications (CHTR) names. These extremes highlight selective risk appetite favoring stable cash flows over growth-dependent sectors.
Sector themes reveal a defensive tilt, with energy and healthcare benefiting from resilient demand and pricing power. Meanwhile, consumer-facing stocks face headwinds from discretionary spending pullbacks or competitive pressures. The industrial strength in CTAS points to steady corporate spending, while real estate services (CBRE) and truck manufacturing (PCAR) may reflect cyclical softness. Market conditions appear bifurcated, rewarding fundamentals over momentum.
Investors should monitor earnings revisions for these extremes—particularly energy margins and streaming subscriber trends—as confirmation of sustained trends. Any rotation into beaten-down sectors would signal shifting sentiment. Macro data on consumer resilience and industrial demand will be key to validating current positioning.
Methodology: All 503 S&P 500 constituents screened. Close prices downloaded from 2026-01-01. Period high = highest close since Jan 1 2026; period low = lowest close since Jan 1 2026. Distance = (current price / period extreme − 1) × 100. Technical indicators computed on up to 1 year of daily OHLCV data.
Disclaimer: For informational purposes only. Not investment advice. Past performance is not indicative of future results.