Nasdaq 100 2026 YTD Highs & Lows Radar: Gilead Sciences, (GILD), Netflix (NFLX) and more
MarketsFN Team

Screening all 101 Nasdaq 100 constituents for stocks nearest to their 2026 year-to-date high and their 2026 YTD low. Data as of October 27, 2026. % Realized = total return since Jan 1 2026.
Legend: RSI > 70 = overbought · RSI < 30 = oversold · Green % Realized = positive YTD return · Red = negative.
📈 Nearest to 2026 High
Sectors represented: Industrials (2), Technology (2), Healthcare (1)
| Ticker | Company | Sector | Price Last | % Realized | 2026 YTD High Date | RSI | % above MA200 | Trend |
|---|---|---|---|---|---|---|---|---|
| GILD | Gilead Sciences, Inc | Healthcare | $158.69 | +30.50% | 2026-10-26 | 59.5 | +14.0% | Above MA20, MA50, MA200 |
| CTAS | Cintas Corporation | Industrials | $225.93 | +22.20% | 2026-10-26 | 55.7 | +19.0% | Above MA20, MA50, MA200 |
| ROP | Roper Technologies Inc | Technology | $441.65 | +1.64% | 2026-10-26 | 75.8 | +21.2% | Above MA20, MA50, MA200 |
| ZS | Zscaler Inc | Technology | $260.45 | +18.08% | 2026-10-26 | 71.4 | +56.5% | Above MA20, MA50, MA200 |
| FAST | Fastenal Co | Industrials | $52.47 | +29.75% | 2026-10-22 | 52.0 | +11.5% | Above MA20, MA50, MA200 |
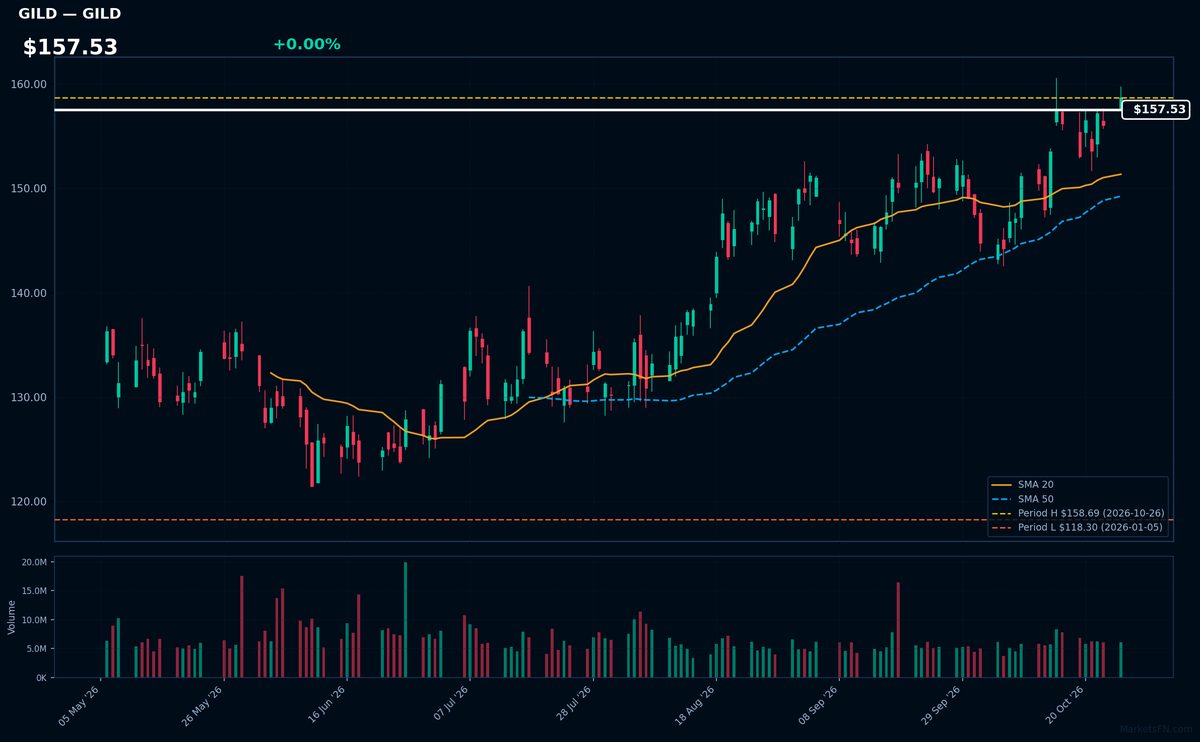
GILD | Gilead Sciences, Inc | Healthcare | Price Last: $158.69 | % Realized: +30.50% | RSI: 59.5 | % above MA200: +14.0% | Trend: Above MA20, MA50, MA200
Gilead Sciences develops antiviral drugs (notably HIV/hepatitis treatments) and oncology therapies. Investors care because its HIV franchise generates stable cash flow while its cancer drug pipeline offers growth potential, creating a rare biotech balance of income and innovation.
Technically bullish: RSI(14) at 59.5 shows controlled momentum, with price > MA20 > MA50 > MA200 confirming the uptrend. At 0.0% below YTD highs after 30.5% YTD gains, this suggests fundamental strength rather than overheating.
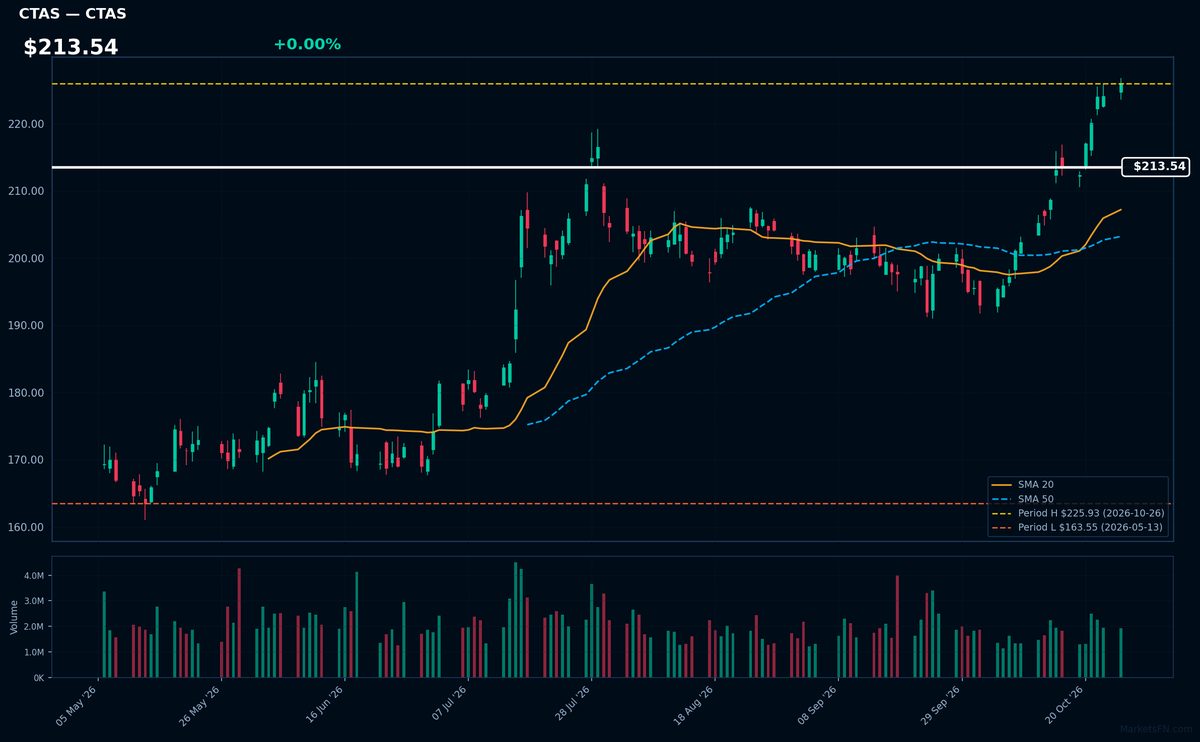
CTAS | Cintas Corporation | Industrials | Price Last: $225.93 | % Realized: +22.20% | RSI: 55.7 | % above MA200: +19.0% | Trend: Above MA20, MA50, MA200
Cintas provides corporate identity uniforms, facility services, and safety supplies to businesses. Investors should care because its recurring revenue model and essential services create stable cash flows across economic cycles.
CTAS shows bullish momentum with price above all key MAs (20/50/200) and RSI(14) at 55.7 — neither overbought nor oversold. The 22.2% YTD gain suggests sustained uptrend strength, now testing yearly highs.
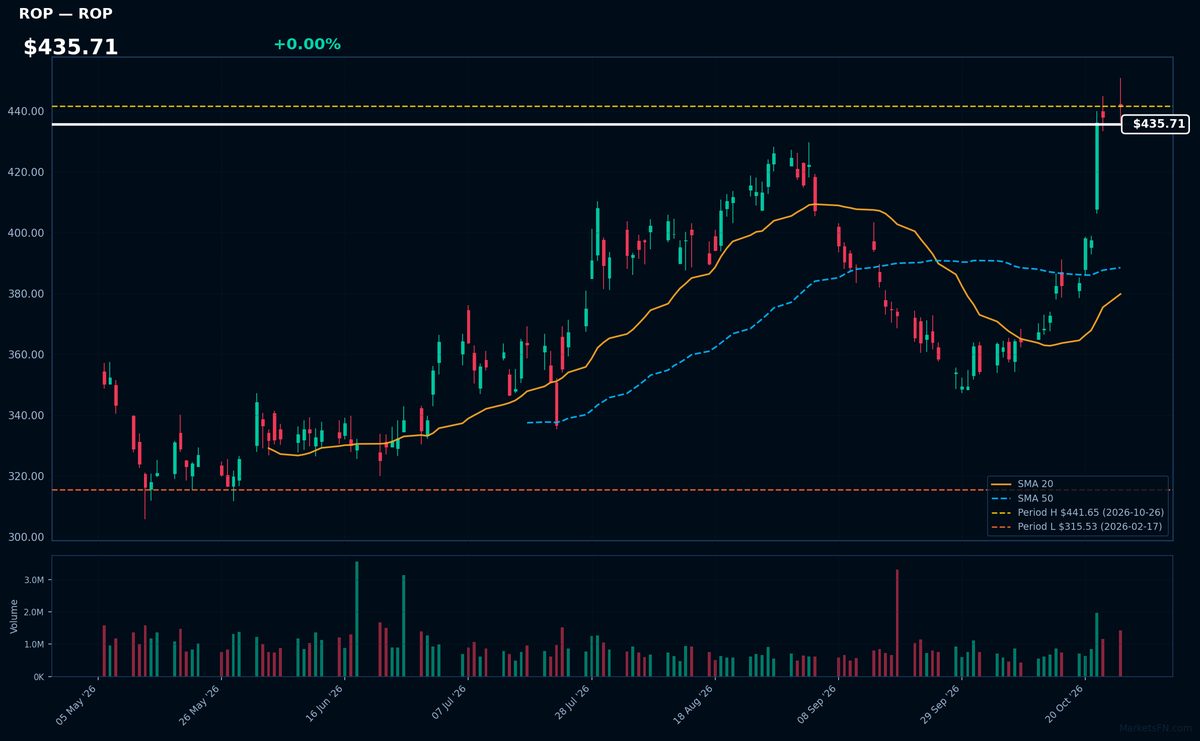
ROP | Roper Technologies Inc | Technology | Price Last: $441.65 | % Realized: +1.64% | RSI: 75.8 | % above MA200: +21.2% | Trend: Above MA20, MA50, MA200
Roper Technologies specializes in asset-light software (SaaS, healthcare IT) and engineered products with high recurring revenue. Investors care for its 90%+ gross margins, predictable cash flows, and disciplined M&A strategy that compounds value without heavy R&D spend.
Technically overbought (RSI 75.8) with mixed MA alignment (above MA20/50/200). At YTD highs (+1.6% YTD), this suggests stretched momentum rather than fundamental breakout — watch for mean reversion.
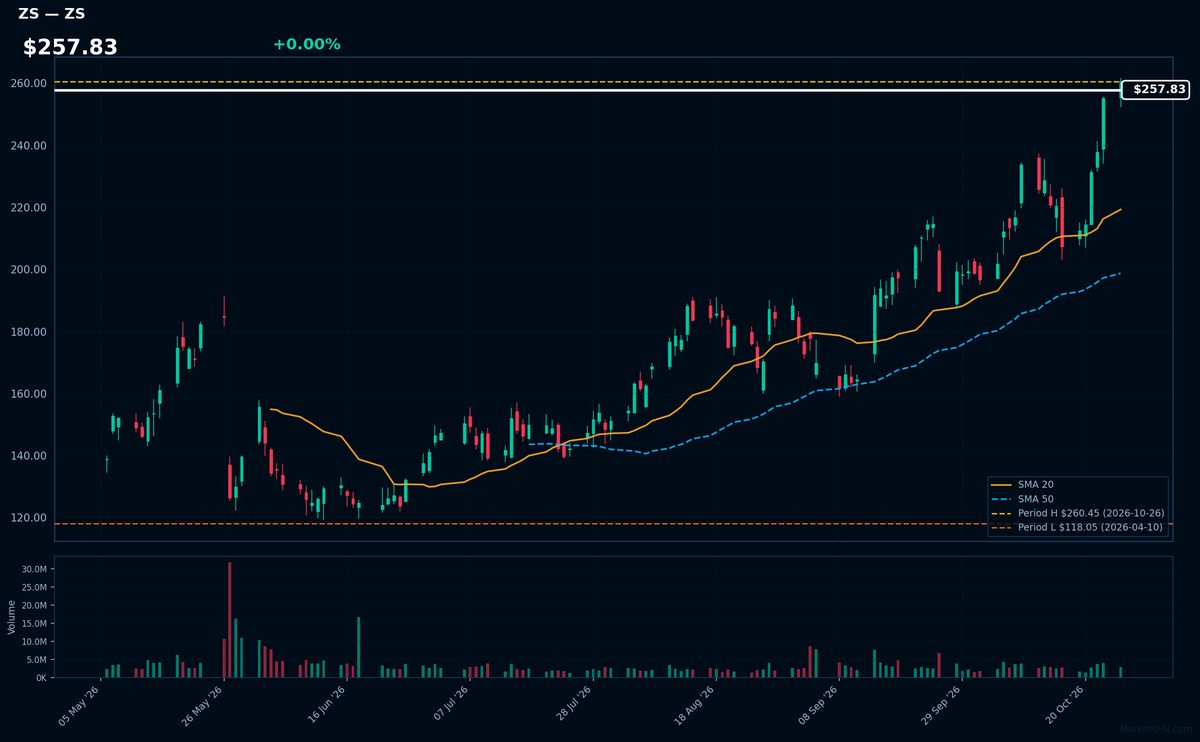
ZS | Zscaler Inc | Technology | Price Last: $260.45 | % Realized: +18.08% | RSI: 71.4 | % above MA200: +56.5% | Trend: Above MA20, MA50, MA200
Zscaler provides cloud-based cybersecurity solutions, specializing in zero-trust network access that replaces traditional VPNs. Investors care as enterprises prioritize secure remote work, with ZS's platform reducing attack surfaces and consolidating security tools — a structural growth driver in the $100B+ security market.
Technically overbought (RSI 71.4) but in strong uptrend (price > MA20 > MA50 > MA200). At YTD highs after 18.1% YTD gain, this reflects momentum but risks short-term pullback. Watch for breakout confirmation or RSI reversal.
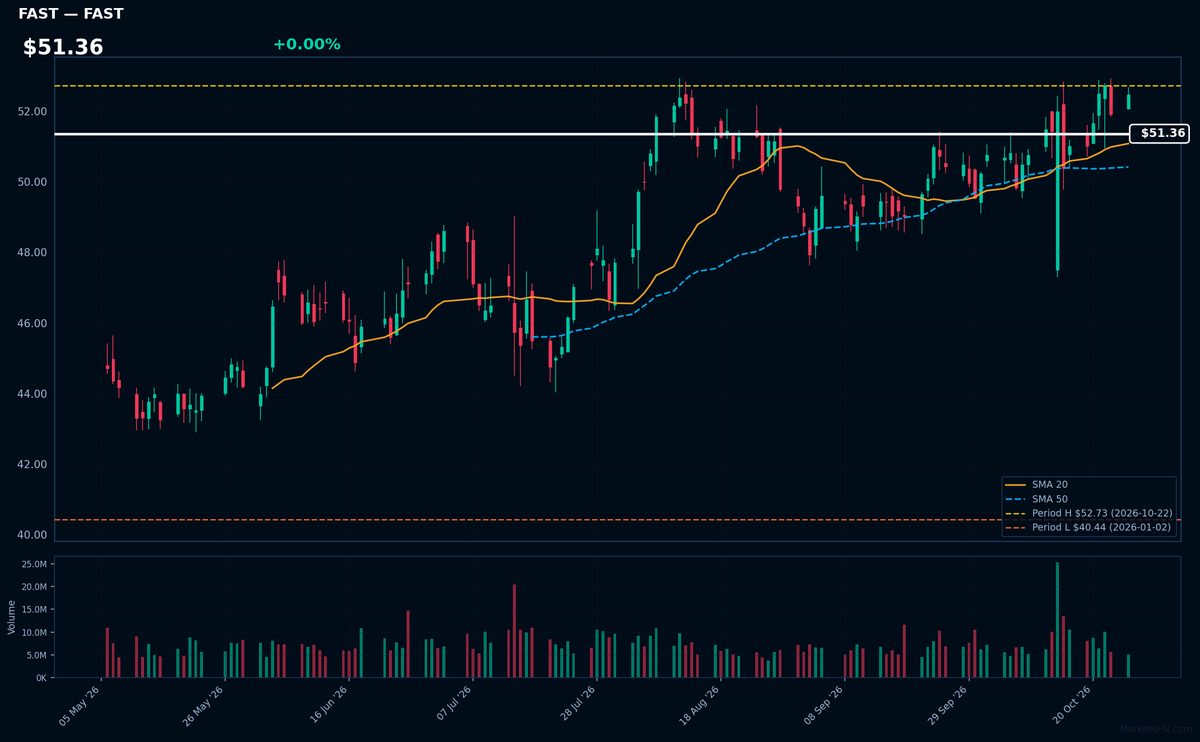
FAST | Fastenal Co | Industrials | Price Last: $52.47 | % Realized: +29.75% | RSI: 52.0 | % above MA200: +11.5% | Trend: Above MA20, MA50, MA200
Fastenal supplies industrial and construction fasteners, safety gear, and maintenance supplies through 3,300+ branches. Investors care because its vast distribution network serves cyclical sectors, making it a proxy for manufacturing/construction activity with consistent cash flows.
FAST shows bullish momentum (RSI 52, price > MA20 > MA50 > MA200) after a 29.7% YTD rally. The 0.5% gap below YTD highs suggests breakout potential, but RSI neutrality warrants caution near resistance.
📉 Nearest to 2026 Low
Sectors represented: Communication Services (3), Consumer Cyclical (1), Industrials (1)
| Ticker | Company | Sector | Price Last | % Realized | 2026 YTD Low Date | RSI | % above MA200 | Trend |
|---|---|---|---|---|---|---|---|---|
| NFLX | Netflix Inc | Communication Services | $63.90 | -29.77% | 2026-10-26 | 32.1 | -22.1% | Below MA20, MA50, MA200 |
| BKNG | Booking Holdings Inc | Consumer Cyclical | $153.14 | -28.08% | 2026-10-26 | 33.6 | -13.9% | Below MA20, MA50, MA200 |
| PCAR | Paccar Inc | Industrials | $104.37 | -6.44% | 2026-10-26 | 33.4 | -13.3% | Below MA20, MA50, MA200 |
| CHTR | Charter Communications Inc | Communication Services | $102.18 | -51.18% | 2026-10-26 | 40.6 | -38.6% | Below MA20, MA50, MA200 |
| APP | Applovin Corp | Communication Services | $260.74 | -57.83% | 2026-10-23 | 36.6 | -38.2% | Below MA20, MA50, MA200 |
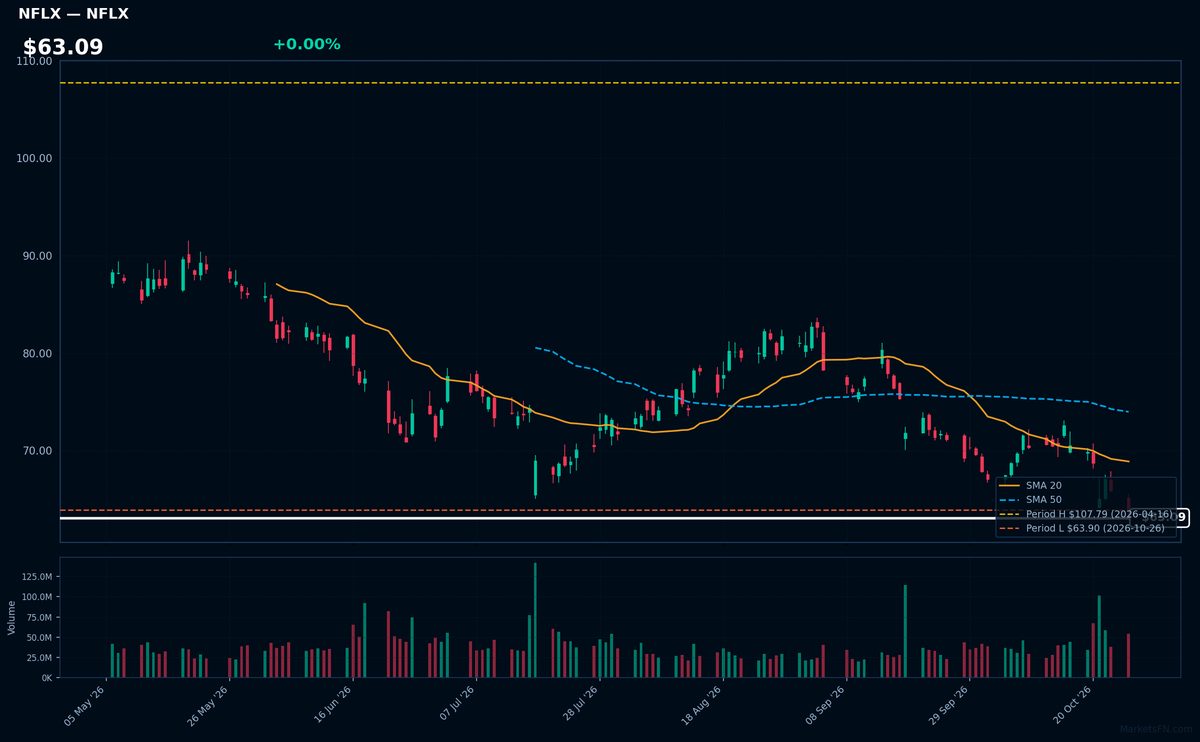
NFLX | Netflix Inc | Communication Services | Price Last: $63.90 | % Realized: -29.77% | RSI: 32.1 | % above MA200: -22.1% | Trend: Below MA20, MA50, MA200
Netflix Inc dominates global streaming with 260M+ subscribers, monetizing content through subscriptions and ads. Investors care due to its pricing power, original content moat, and high-margin scalability as streaming penetration grows worldwide.
NFLX shows severe technical stress: RSI(14) at 32.1 signals oversold conditions amid a sustained downtrend (price < MA20 < MA50 < MA200). The stock tests 2026 lows after a 29.8% YTD plunge—a clear warning sign.
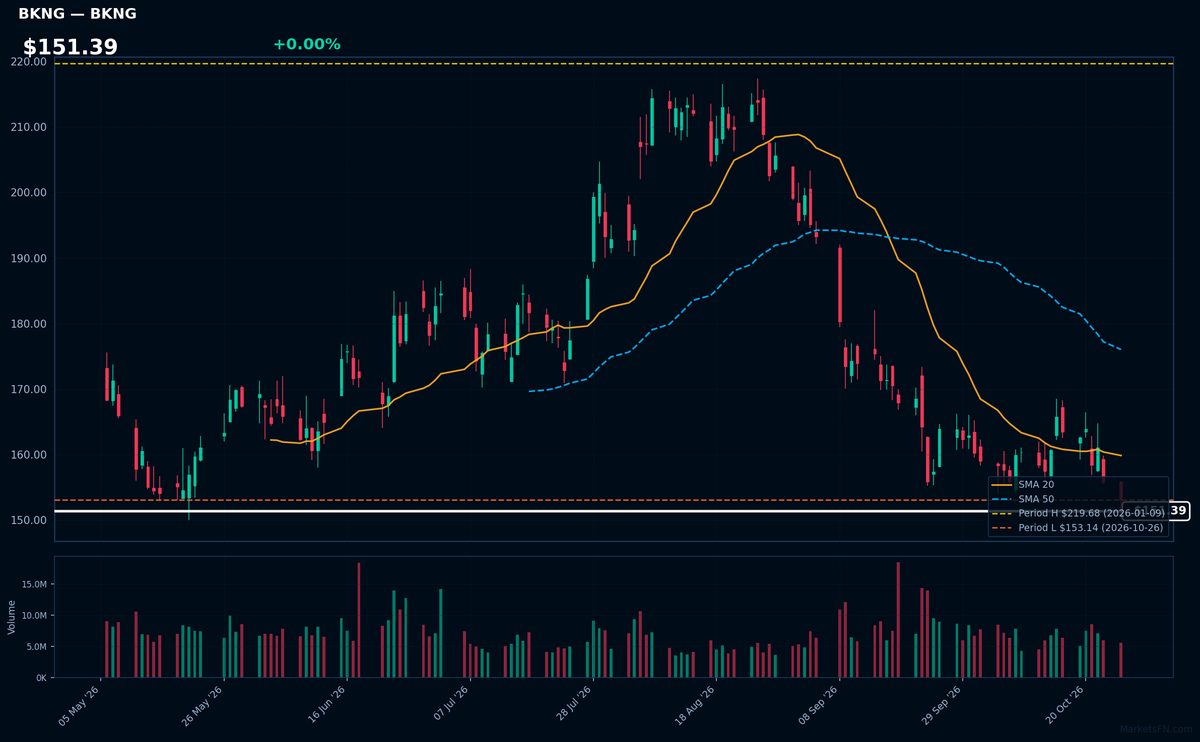
BKNG | Booking Holdings Inc | Consumer Cyclical | Price Last: $153.14 | % Realized: -28.08% | RSI: 33.6 | % above MA200: -13.9% | Trend: Below MA20, MA50, MA200
Booking Holdings operates leading online travel platforms (Booking.com, Priceline, Kayak) that dominate global accommodation reservations. Investors care because its asset-light model generates high-margin recurring revenue from travel's structural growth, though cyclical exposure remains.
Severe technical deterioration: RSI(14) at 33.6 shows oversold conditions amid bearish MA alignment (price < MA20 < MA50 < MA200). Testing YTD lows after -28.1% decline warns of breakdown risk.
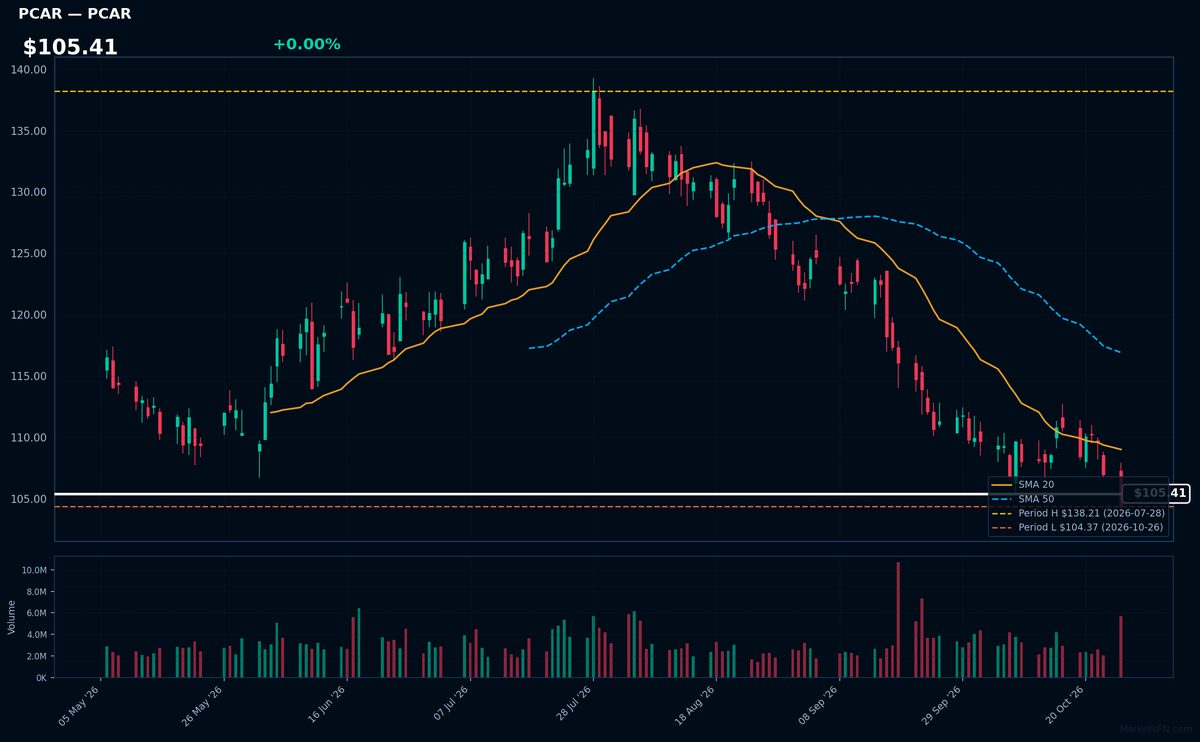
PCAR | Paccar Inc | Industrials | Price Last: $104.37 | % Realized: -6.44% | RSI: 33.4 | % above MA200: -13.3% | Trend: Below MA20, MA50, MA200
Paccar Inc designs/manufactures premium trucks under Kenworth, Peterbilt, and DAF brands, serving commercial freight and construction markets. Investors track PCAR as a cyclical bellwether for North American/European freight demand and heavy equipment capex cycles.
Technically concerning: RSI(14) at 33.4 shows oversold conditions amid bearish MA alignment (price < MA20 < MA50 < MA200). Testing YTD lows after -6.4% 2026 decline warns of sustained downtrend unless support holds.
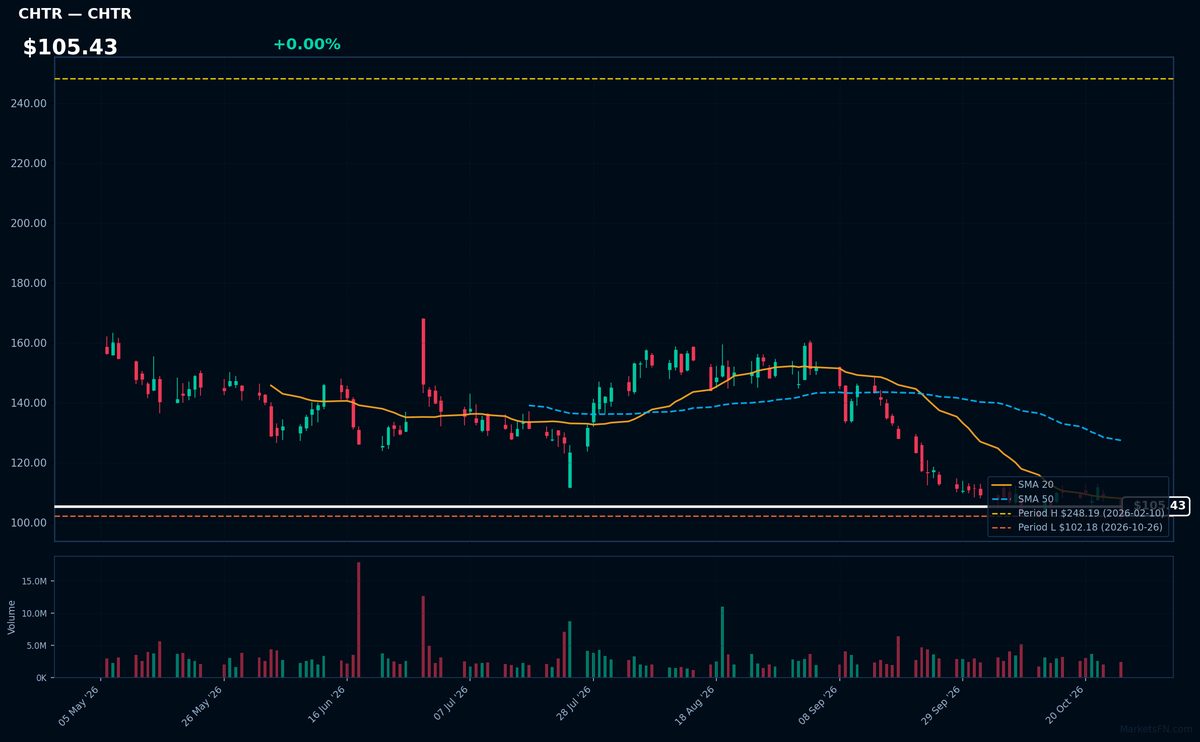
CHTR | Charter Communications Inc | Communication Services | Price Last: $102.18 | % Realized: -51.18% | RSI: 40.6 | % above MA200: -38.6% | Trend: Below MA20, MA50, MA200
Charter Communications Inc (CHTR) operates as a broadband connectivity and cable operator, providing essential internet, TV, and voice services to residential and business customers. Investors care due to its infrastructure-heavy, recurring-revenue model in an increasingly digital economy.
CHTR shows severe technical weakness: RSI(14) at 40.6 confirms bearish momentum, with a sustained downtrend (price < MA20 < MA50 < MA200). The stock tests critical support, down 51.2% YTD — a clear warning sign.
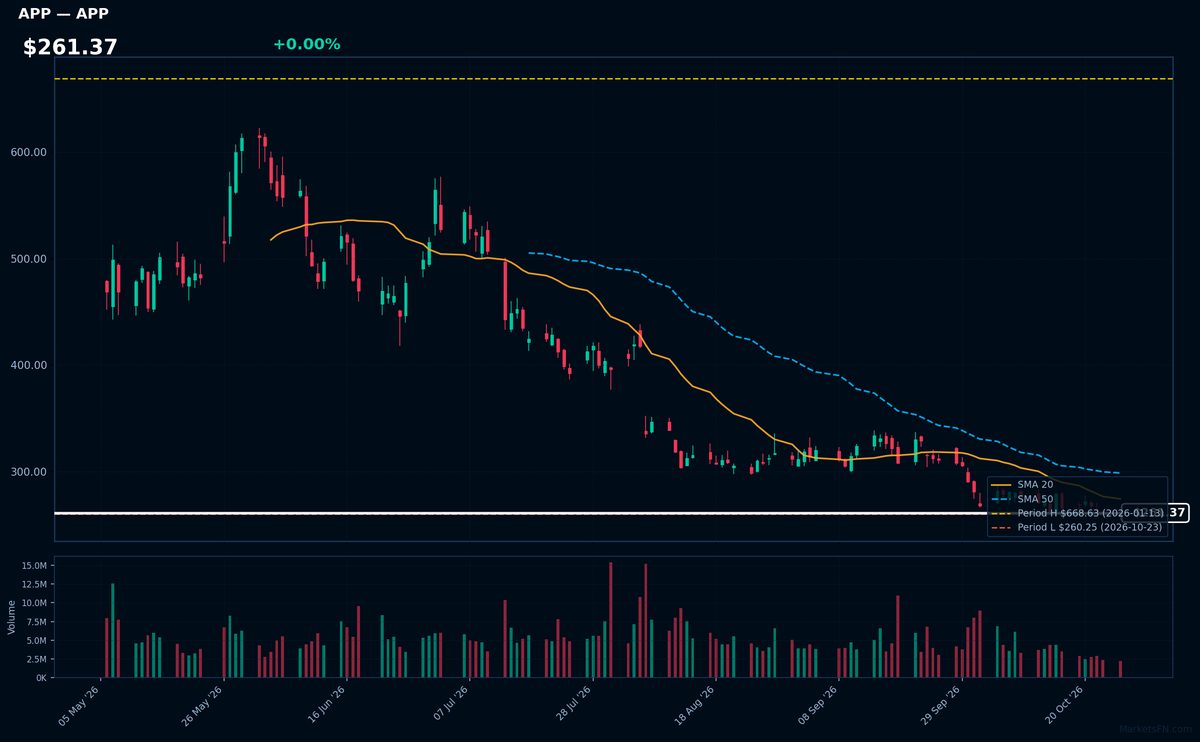
APP | Applovin Corp | Communication Services | Price Last: $260.74 | % Realized: -57.83% | RSI: 36.6 | % above MA200: -38.2% | Trend: Below MA20, MA50, MA200
Applovin operates a mobile app monetization platform, enabling developers to maximize ad revenue through targeted in-app advertising. Investors care due to its dominant position in the $300B+ mobile ad market and exposure to high-growth gaming/app ecosystems.
Severe technical warning: RSI(14) at 36.6 shows oversold conditions amid bearish MA alignment (price < MA20 < MA50 < MA200). Stock tests critical support, down 57.8% YTD — extreme weakness.
Market Commentary
The Nasdaq 100 stocks at their 2026 highs—GILD, CTAS, ROP, ZS, and FAST (just -0.5% off)—reflect resilient demand in healthcare, industrial services, and cybersecurity, sectors benefiting from steady corporate spending and defensive positioning. Conversely, NFLX, BKNG, PCAR, CHTR, and APP hovering near 2026 lows suggest pressure on consumer discretionary and ad-driven tech, likely due to cyclical sensitivity and shifting digital ad trends. Extreme positioning often signals stretched sentiment, warranting caution near highs or contrarian interest near lows.
Macro conditions favor cash-rich industrials (CTAS, ROP) and mission-critical software (ZS) amid elevated rates, while consumer tech (NFLX, APP) faces growth skepticism. GILD’s strength highlights biotech’s defensive appeal, whereas CHTR’s weakness reflects cord-cutting and broadband competition. The divergence underscores a market rewarding profitability and recurring revenue over speculative growth, with interest rates and AI adoption as key sector differentiators.
Investors should monitor earnings revisions for high-flyers like ZS (cloud security demand) and FAST (industrial PMIs), plus any rebound catalysts for laggards such as APP’s ad-tech recovery or PCAR’s trucking cycle. Traders might watch for mean reversion in extreme movers, with macro data (Fed policy, consumer spending) likely to dictate next legs. Rigorous position sizing is critical given elevated dispersion.
Methodology: All 101 Nasdaq 100 constituents screened. Close prices downloaded from 2026-01-01. Period high = highest close since Jan 1 2026; period low = lowest close since Jan 1 2026. Distance = (current price / period extreme − 1) × 100. Technical indicators computed on up to 1 year of daily OHLCV data.
Disclaimer: For informational purposes only. Not investment advice. Past performance is not indicative of future results.