Nasdaq 100 52-Week Highs & Lows Radar: AMGEN (AMGN), Netflix (NFLX) and more
MarketsFN Team

Screening all 101 Nasdaq 100 constituents for stocks nearest to their 52-week high and their 52-week low. Data as of October 27, 2026. % Realized = 52-week total return.
Legend: RSI > 70 = overbought · RSI < 30 = oversold · Green % Realized = positive 52W return · Red = negative.
📈 Nearest to 52-Week High
Sectors represented: Healthcare (3), Technology (1), Consumer Defensive (1)
| Ticker | Company | Sector | Price Last | % Realized | 52-Week High Date | RSI | % above MA200 | Trend |
|---|---|---|---|---|---|---|---|---|
| AMGN | AMGEN Inc | Healthcare | $446.82 | +53.46% | 2026-10-22 | 64.0 | +19.9% | Above MA20, MA50, MA200 |
| AAPL | Apple Inc | Technology | $347.32 | +29.21% | 2026-10-22 | 61.3 | +17.6% | Above MA20, MA50, MA200 |
| GILD | Gilead Sciences, Inc | Healthcare | $157.64 | +30.85% | 2026-10-26 | 59.8 | +13.2% | Above MA20, MA50, MA200 |
| BIIB | Biogen Inc | Healthcare | $251.29 | +67.05% | 2026-10-22 | 70.0 | +25.6% | Above MA20, MA50, MA200 |
| KDP | Keurig Dr Pepper Inc | Consumer Defensive | $34.76 | +18.94% | 2026-10-22 | 64.6 | +16.3% | Above MA20, MA50, MA200 |
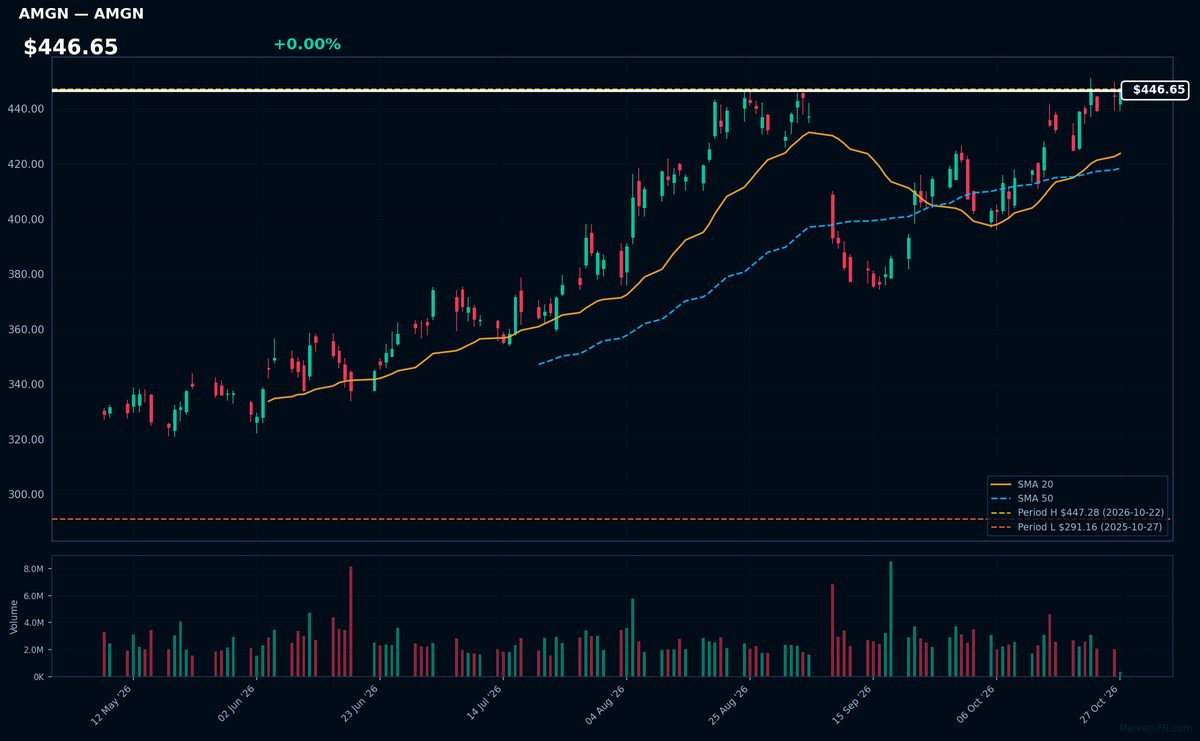
AMGN | AMGEN Inc | Healthcare | Price Last: $446.82 | % Realized: +53.46% | RSI: 64.0 | % above MA200: +19.9% | Trend: Above MA20, MA50, MA200
Amgen develops biologic medicines for serious illnesses, including top-selling autoimmune drug Enbrel and cancer treatment Kyprolis. Investors care because its high-margin biologics portfolio and pipeline (e.g., obesity drug MariTide) compete in lucrative markets with durable cash flows.
Technically bullish: RSI 64 shows momentum without overbought pressure, confirmed by bullish MA alignment (price > MA20 > MA50 > MA200). At 0.1% below 52-week highs after 53.5% annual gain, this signals sustained uptrend strength.
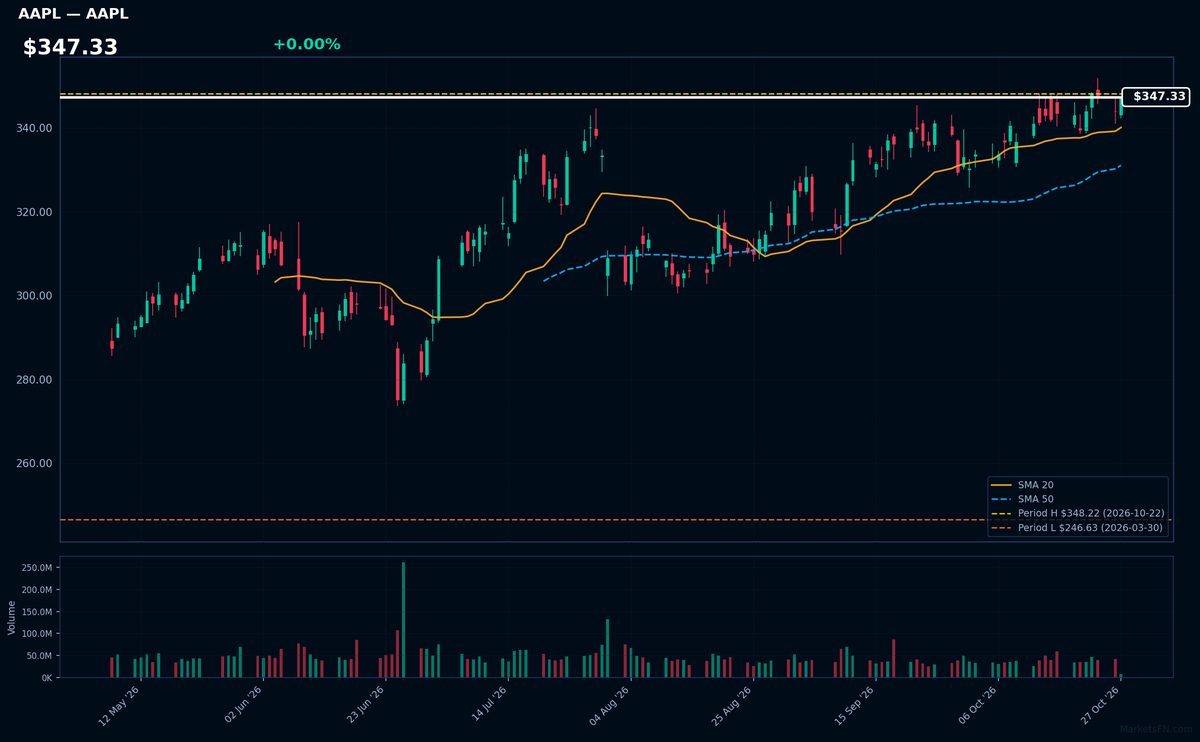
AAPL | Apple Inc | Technology | Price Last: $347.32 | % Realized: +29.21% | RSI: 61.3 | % above MA200: +17.6% | Trend: Above MA20, MA50, MA200
Apple Inc. designs consumer electronics (iPhone, Mac), software (iOS), and services (App Store, Apple Music). Investors care because its ecosystem drives recurring revenue and premium pricing power, with 29.2% annual returns showing sustained execution.
Technically bullish: $347.33 price shows a sustained uptrend (price > MA20 > MA50 > MA200), RSI(14) at 61.3 suggests room for momentum, and 0.3% below 52-week high signals breakout potential.
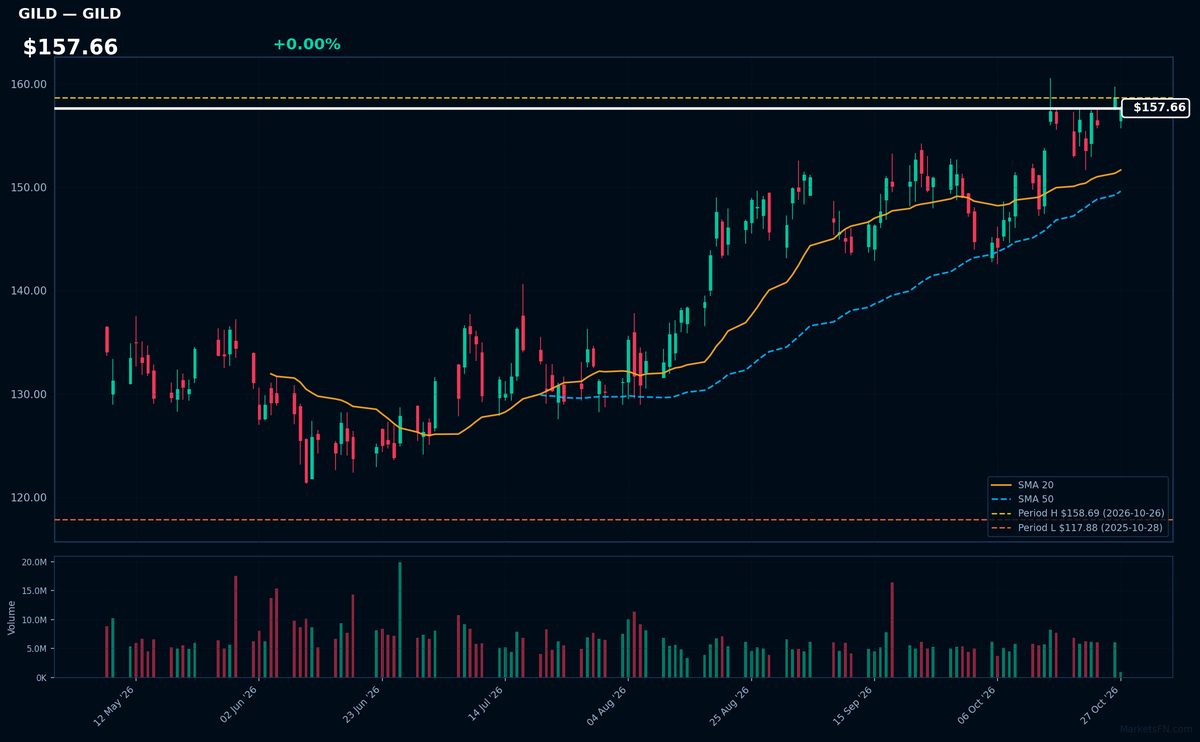
GILD | Gilead Sciences, Inc | Healthcare | Price Last: $157.64 | % Realized: +30.85% | RSI: 59.8 | % above MA200: +13.2% | Trend: Above MA20, MA50, MA200
Gilead Sciences develops antiviral therapies (notably HIV/Hepatitis C treatments) and oncology drugs, with a pipeline targeting unmet medical needs. Investors care because its specialty pharma model generates high-margin recurring revenue from chronic treatments, offsetting patent cliffs.
Technically bullish: RSI(14) at 59.8 shows room to run, with price > MA20 > MA50 > MA200 confirming uptrend. At 0.7% below 52-week highs after 30.9% annual gain, this reflects momentum, not overextension.
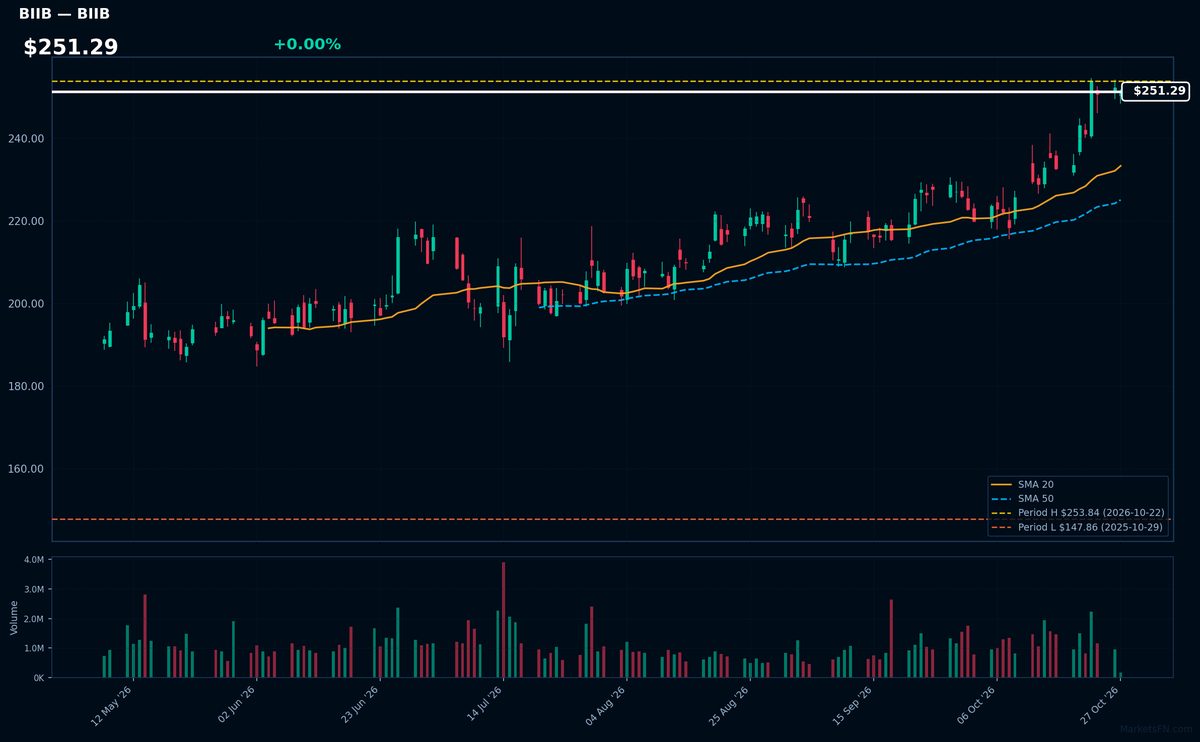
BIIB | Biogen Inc | Healthcare | Price Last: $251.29 | % Realized: +67.05% | RSI: 70.0 | % above MA200: +25.6% | Trend: Above MA20, MA50, MA200
Biogen develops therapies for neurological diseases like multiple sclerosis (Tecfidera) and Alzheimer's (Aduhelm, Leqembi). Investors care due to its high-margin biologic drugs and controversial but potentially blockbuster Alzheimer's treatments facing FDA scrutiny and reimbursement battles.
Technically overbought (RSI 70) but in strong uptrend (price > MA20 > MA50 > MA200), 67% YTD return. Near 52-week high (+1%) suggests momentum continuation risk/reward.
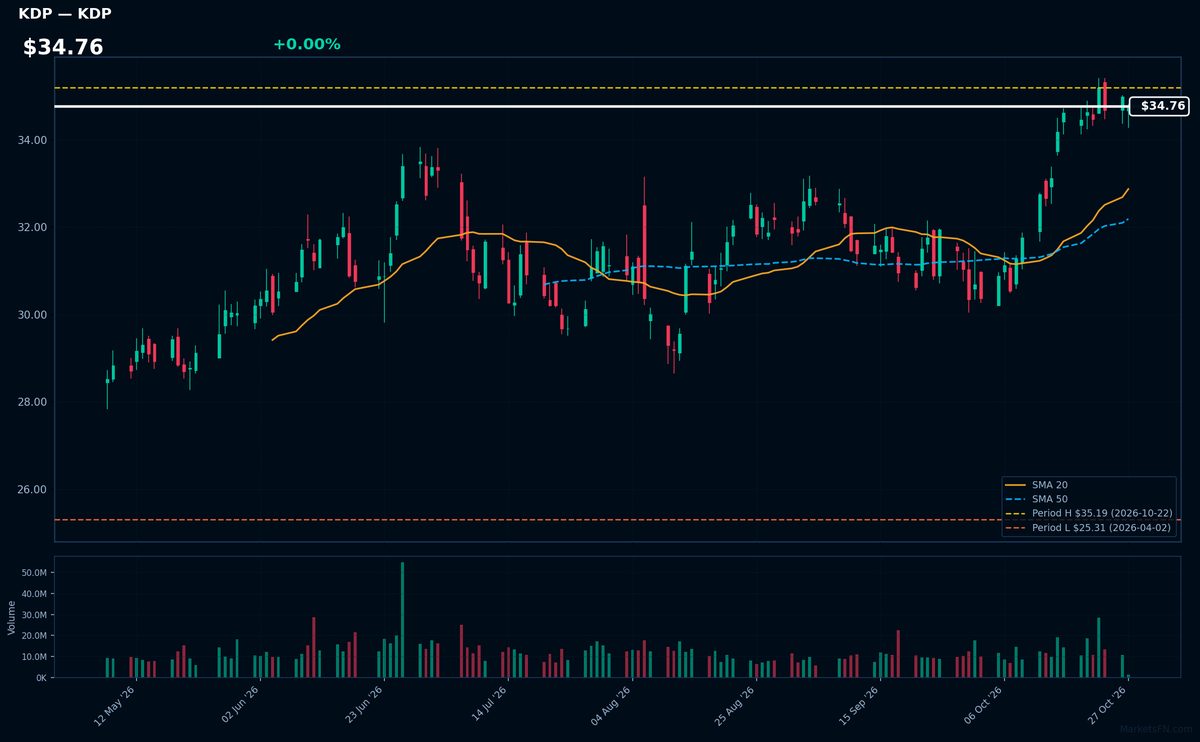
KDP | Keurig Dr Pepper Inc | Consumer Defensive | Price Last: $34.76 | % Realized: +18.94% | RSI: 64.6 | % above MA200: +16.3% | Trend: Above MA20, MA50, MA200
Keurig Dr Pepper Inc (KDP) manufactures and distributes coffee (Keurig systems) and beverages (Dr Pepper, Snapple). Investors care because its dual coffee/cold drink portfolio provides stable cash flows in defensive categories, with pricing power from branded single-serve systems and concentrated US soft drink market share.
Technically bullish: RSI(14) at 64.6 shows building momentum without being overbought, while the price > MA20 > MA50 > MA200 confirms a sustained uptrend. At 1.2% below 52-week highs after an 18.9% annual gain, it tests breakout potential. Current alignment favors continuation.
📉 Nearest to 52-Week Low
Sectors represented: Communication Services (4), Consumer Cyclical (1)
| Ticker | Company | Sector | Price Last | % Realized | 52-Week Low Date | RSI | % above MA200 | Trend |
|---|---|---|---|---|---|---|---|---|
| NFLX | Netflix Inc | Communication Services | $63.08 | -42.37% | 2026-10-27 | 32.0 | -23.1% | Below MA20, MA50, MA200 |
| BKNG | Booking Holdings Inc | Consumer Cyclical | $151.85 | -27.75% | 2026-10-27 | 34.0 | -14.6% | Below MA20, MA50, MA200 |
| TMUS | T-Mobile US Inc | Communication Services | $147.00 | -33.39% | 2026-10-23 | 36.0 | -21.6% | Below MA20, MA50, MA200 |
| APP | Applovin Corp | Communication Services | $263.21 | -59.07% | 2026-10-23 | 38.2 | -37.6% | Below MA20, MA50, MA200 |
| CHTR | Charter Communications Inc | Communication Services | $105.61 | -56.97% | 2026-10-26 | 40.8 | -36.5% | Below MA20, MA50, MA200 |
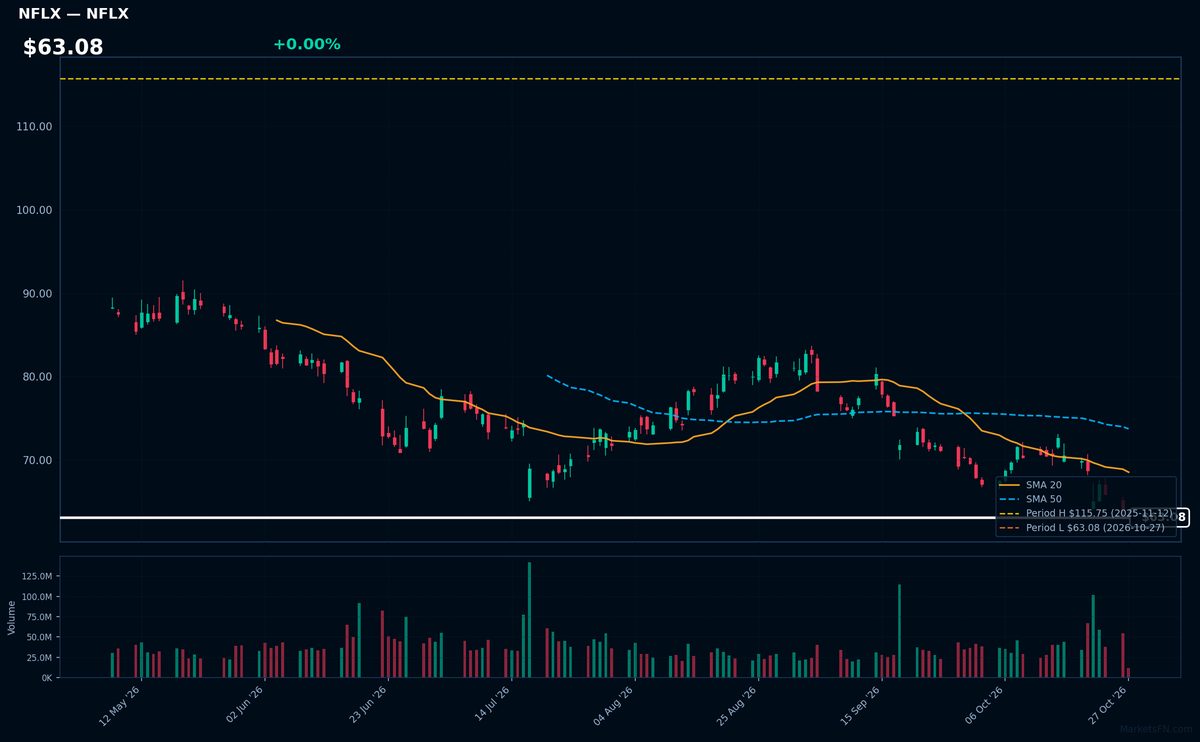
NFLX | Netflix Inc | Communication Services | Price Last: $63.08 | % Realized: -42.37% | RSI: 32.0 | % above MA200: -23.1% | Trend: Below MA20, MA50, MA200
Netflix Inc operates the world's leading streaming platform with 221M subscribers, pioneering direct-to-consumer entertainment. Investors care due to its first-mover advantage in global streaming, content scale, and pricing power despite rising competition.
Netflix shows extreme technical weakness: RSI(14) at 32.0 signals near-oversold conditions, while the bearish MA alignment (price < MA20 < MA50 < MA200) confirms a sustained downtrend. The stock tests major support at just 0.0% above its 52-week low after a -42.4% annual decline.
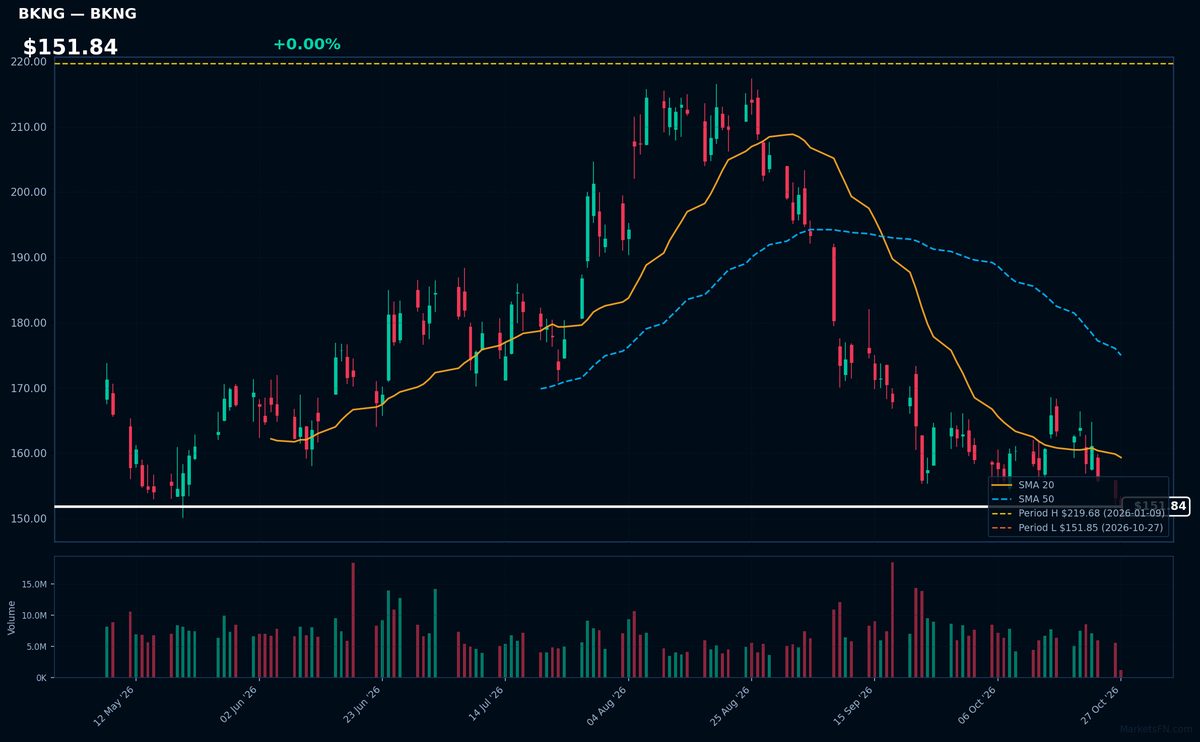
BKNG | Booking Holdings Inc | Consumer Cyclical | Price Last: $151.85 | % Realized: -27.75% | RSI: 34.0 | % above MA200: -14.6% | Trend: Below MA20, MA50, MA200
Booking Holdings operates leading online travel platforms (Booking.com, Priceline, Kayak) connecting travelers with lodging/transportation globally. Investors care because its asset-light model scales efficiently in the $1T+ travel market, though cyclicality and competition are risks.
Technically distressed: RSI(14) at 34.0 shows near-oversold conditions, but bearish MA alignment (price < MA20 < MA50 < MA200) confirms sustained downtrend. Testing 52-week lows (-27.8% YoY) signals severe weakness.
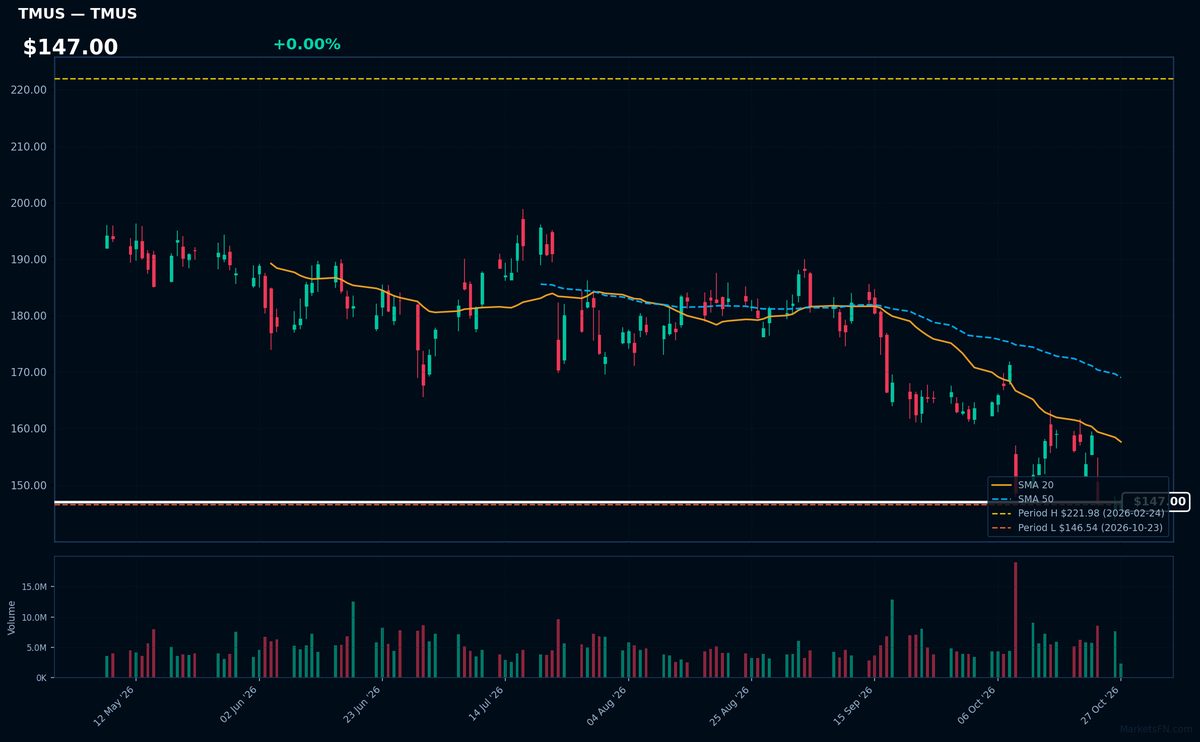
TMUS | T-Mobile US Inc | Communication Services | Price Last: $147.00 | % Realized: -33.39% | RSI: 36.0 | % above MA200: -21.6% | Trend: Below MA20, MA50, MA200
T-Mobile US Inc operates as a major wireless carrier in the U.S., known for aggressive pricing and network expansion. Investors watch for its 5G rollout and market share gains against Verizon and AT&T, which drive revenue growth in the competitive telecom sector.
TMUS shows severe technical weakness: RSI(14) at 36.0 signals near-oversold conditions, while a sustained downtrend (price < MA20 < MA50 < MA200) and -33.4% 52-week return suggest persistent selling pressure. Trading just 0.3% above 52-week lows, it tests critical support—a clear warning sign.
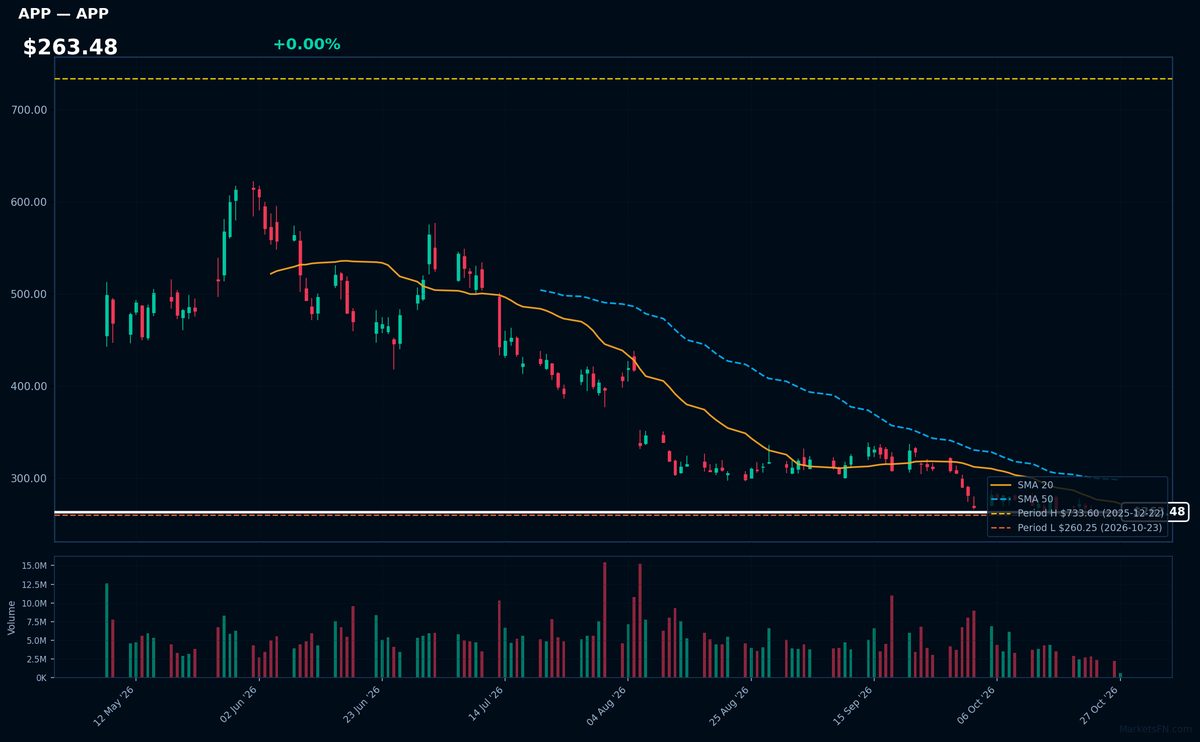
APP | Applovin Corp | Communication Services | Price Last: $263.21 | % Realized: -59.07% | RSI: 38.2 | % above MA200: -37.6% | Trend: Below MA20, MA50, MA200
Applovin operates a mobile app discovery platform and develops monetization software for app developers. Investors should monitor its exposure to mobile gaming ad spend and ability to monetize through its AXON recommendation engine as app install advertising evolves.
Technically distressed: RSI(14) at 38.2 shows oversold conditions amid bearish MA alignment (price < MA20 < MA50 < MA200). Trading just 1.1% above 52-week lows after -59.1% annual decline signals severe downtrend. Critical support test underway.
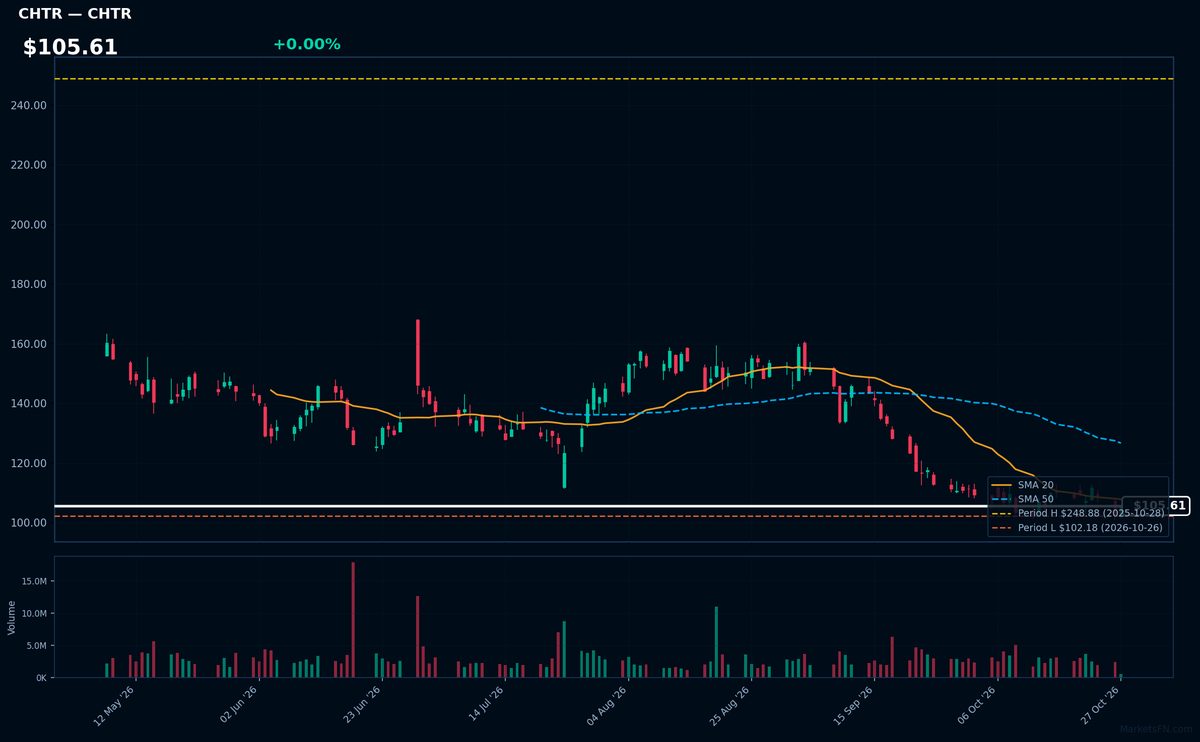
CHTR | Charter Communications Inc | Communication Services | Price Last: $105.61 | % Realized: -56.97% | RSI: 40.8 | % above MA200: -36.5% | Trend: Below MA20, MA50, MA200
Charter Communications Inc provides cable TV, broadband internet, and telephone services to residential and business customers under the Spectrum brand. Investors watch CHTR as a leading US broadband provider with recurring revenue streams, though facing cord-cutting pressures and heavy debt load.
CHTR shows severe technical weakness: RSI(14) at 40.8 (neutral-bearish), with sustained downtrend (price $105.61 below MA20/50/200). Trading just 3.4% above 52-week lows after -57% annual return signals strong bearish momentum. MA alignment suggests continued distribution.
Market Commentary
The clustering of Nasdaq 100 stocks near 52-week extremes highlights a stark divergence in market sentiment. Biopharma leaders like AMGN (-0.1% from high) and GILD (-0.7%) show defensive strength amid economic uncertainty, while AAPL (-0.3%) maintains its blue-chip resilience. Conversely, streaming giant NFLX (0.0% above low) and travel-tech BKNG (0.0%) reflect growth-sector pressures from inflation and consumer spending shifts.
Sector rotation explains much of this bifurcation. Healthcare and staples (KDP -1.2% from high) benefit from stable earnings, while tech faces macro headwinds: rising rates compress valuations for cash-burning growth stocks (APP +1.1% above low), and cord-cutting weighs on CHTR (+3.4%). TMUS (+0.3%) struggles with post-merger integration costs despite 5G tailwinds.
Key technical levels loom: AMGN/AAPL must hold near-current levels to confirm breakout potential, while NFLX/BKNG need to reclaim 5% above lows to avoid further downside. Catalysts include Q2 earnings (BIIB -1.0% faces Alzheimer's drug adoption scrutiny) and Fed policy shifts that could revive or further pressure growth names. Watch for volume spikes at these extremes for confirmation.
Methodology: All 101 Nasdaq 100 constituents screened. 52-week high = highest daily close over the past 252 trading days (approx. 1 year). 52-week low = lowest daily close over the same period. Distance = (current price / extreme − 1) × 100. Technical indicators computed on up to 1 year of daily OHLCV data.
Disclaimer: For informational purposes only. Not investment advice. Past performance is not indicative of future results.