S&P 500 52-Week Highs & Lows Radar: Visa (V), Comcast (CMCSA) and more
MarketsFN Team

Screening all 503 S&P 500 constituents for stocks nearest to their 52-week high and their 52-week low. Data as of October 12, 2026. % Realized = 52-week total return.
Legend: RSI > 70 = overbought · RSI < 30 = oversold · Green % Realized = positive 52W return · Red = negative.
📈 Nearest to 52-Week High
Sectors represented: Financial (1), Energy (1), Healthcare (1), Consumer Defensive (1), Technology (1)
| Ticker | Company | Sector | Price Last | % Realized | 52-Week High Date | RSI | % above MA200 | Trend |
|---|---|---|---|---|---|---|---|---|
| V | Visa Inc | Financial | $388.40 | +13.14% | 2026-10-12 | 69.3 | +14.8% | Above MA20, MA50, MA200 |
| XOM | Exxon Mobil Corp | Energy | $172.14 | +53.37% | 2026-10-12 | 68.9 | +14.3% | Above MA20, MA50, MA200 |
| ABBV | Abbvie Inc | Healthcare | $278.73 | +21.03% | 2026-10-12 | 73.0 | +19.7% | Above MA20, MA50, MA200 |
| PM | Philip Morris International Inc | Consumer Defensive | $202.68 | +27.10% | 2026-10-12 | 68.2 | +13.2% | Above MA20, MA50, MA200 |
| FTNT | Fortinet Inc | Technology | $195.37 | +132.03% | 2026-10-12 | 73.1 | +60.3% | Above MA20, MA50, MA200 |
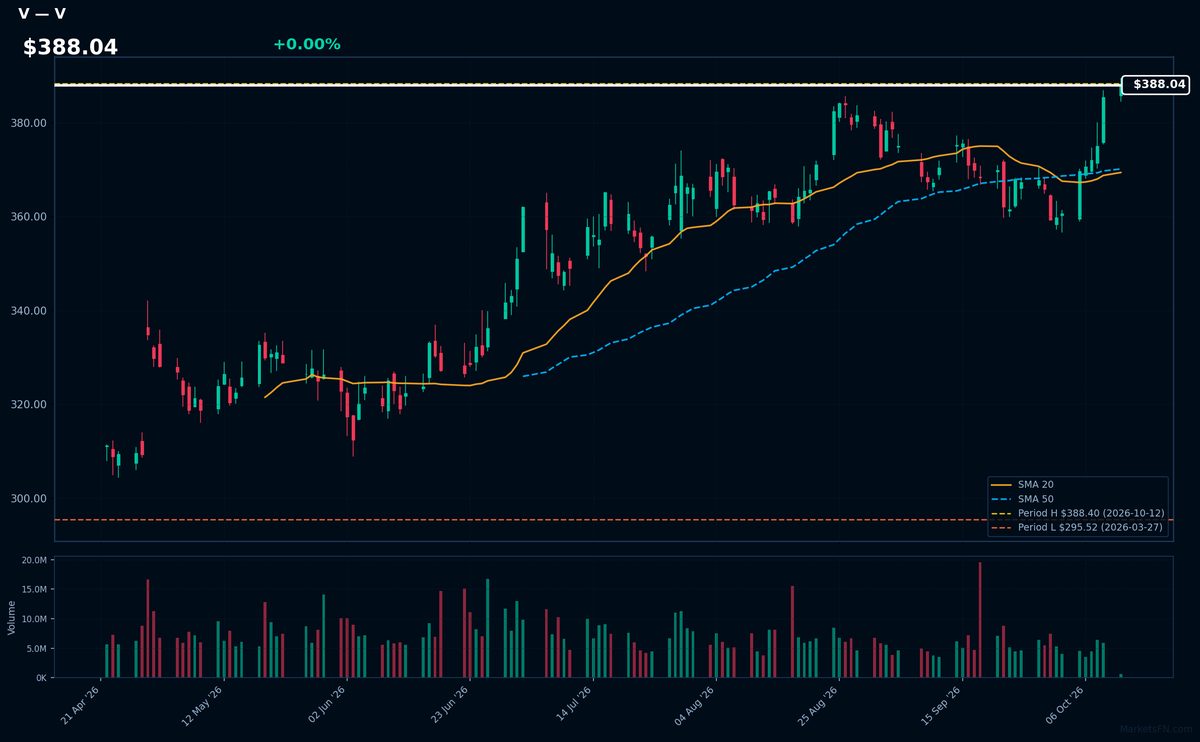
V | Visa Inc | Financial | Price Last: $388.40 | % Realized: +13.14% | RSI: 69.3 | % above MA200: +14.8% | Trend: Above MA20, MA50, MA200
Visa operates the world's largest electronic payments network, processing over $14 trillion annually. Investors care because its asset-light model generates 60%+ operating margins as global cashless adoption grows, with particularly strong exposure to cross-border travel recovery trends.
At $388.04, V trades at 52-week highs (0.0% below) with RSI(14) at 69.3 (near overbought) above all key MAs. The 13.1% annual return suggests momentum, but elevated RSI warrants caution for new positions.
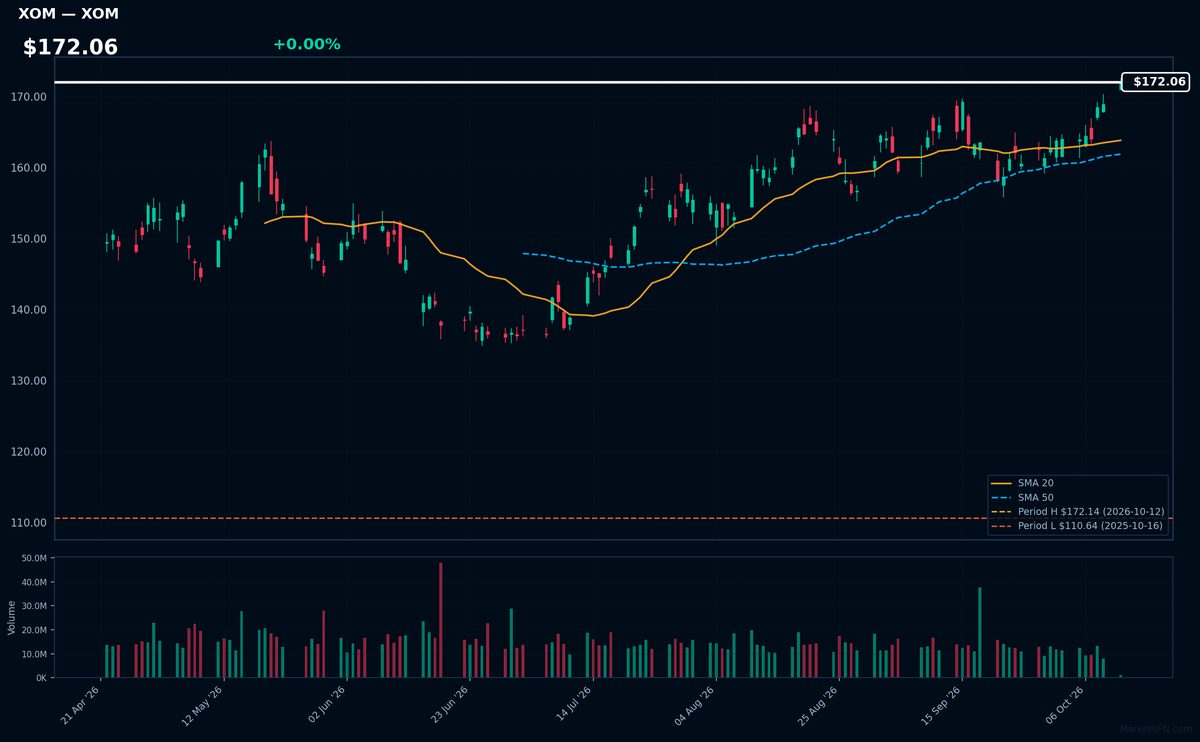
XOM | Exxon Mobil Corp | Energy | Price Last: $172.14 | % Realized: +53.37% | RSI: 68.9 | % above MA200: +14.3% | Trend: Above MA20, MA50, MA200
Exxon Mobil Corp (XOM) is an integrated energy giant exploring, producing, refining, and marketing oil/gas globally. Investors care due to its scale, dividend reliability, and direct exposure to crude prices—critical as energy security concerns persist and oil trades above $80/barrel.
Technically bullish: $172.06 price shows sustained uptrend (MA20>MA50>MA200) with 68.9 RSI nearing overbought. At 52-week highs after 53.4% rally, watch for breakout confirmation or pullback.
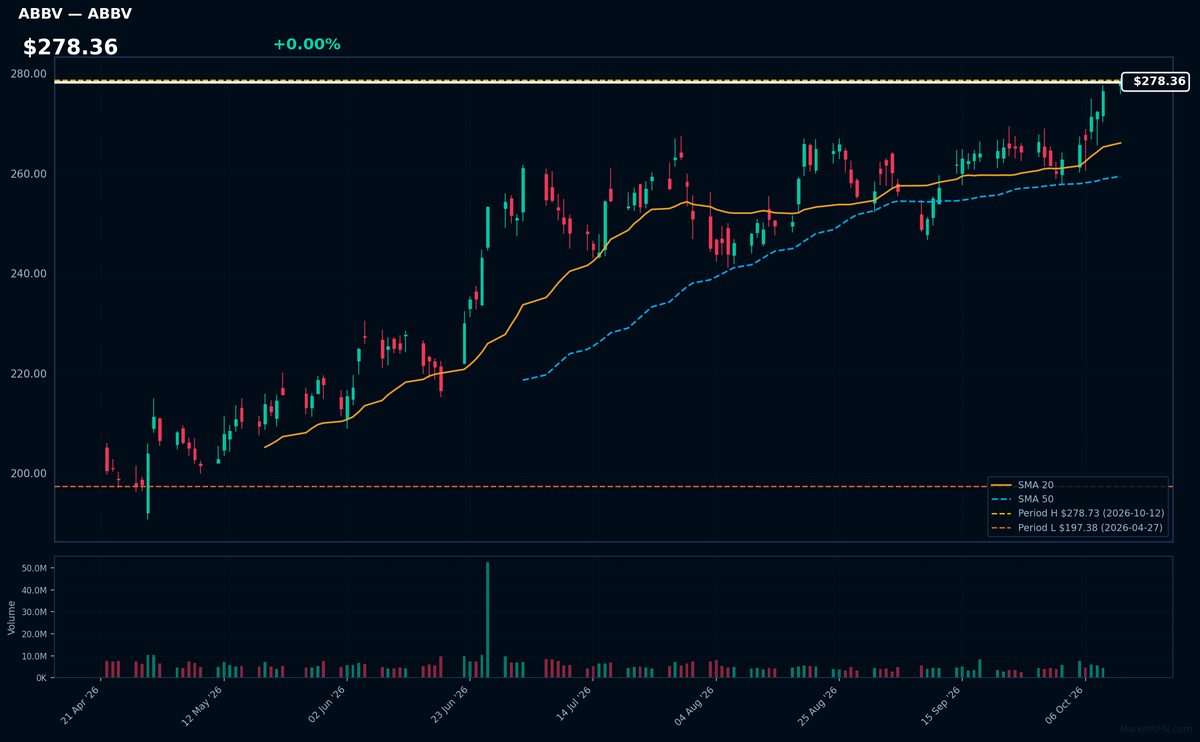
ABBV | Abbvie Inc | Healthcare | Price Last: $278.73 | % Realized: +21.03% | RSI: 73.0 | % above MA200: +19.7% | Trend: Above MA20, MA50, MA200
AbbVie is a biopharmaceutical company specializing in immunology, oncology, and neuroscience drugs. Investors care because its blockbuster drugs (e.g., Humira) and pipeline innovations drive consistent revenue, making it a healthcare sector staple with defensive appeal during market volatility.
AbbVie shows strong bullish momentum: RSI(14) at 73.0 (overbought), price > MA20 > MA50 > MA200, and 21.0% 52-week return. However, trading 0.0% below its 52-week high suggests potential resistance ahead.
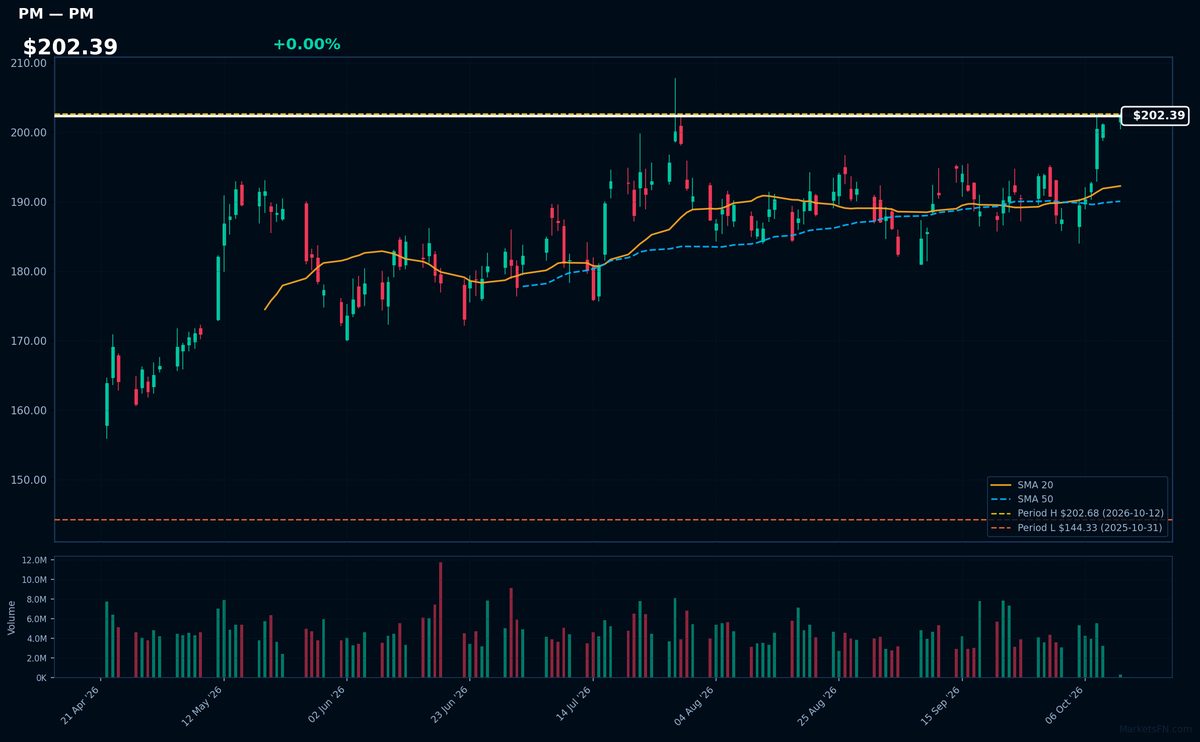
PM | Philip Morris International Inc | Consumer Defensive | Price Last: $202.68 | % Realized: +27.10% | RSI: 68.2 | % above MA200: +13.2% | Trend: Above MA20, MA50, MA200
Philip Morris International manufactures and sells cigarettes, heated tobacco, and nicotine products outside the U.S., with Marlboro as its flagship brand. Investors watch PM for its global tobacco exposure, pricing power, and IQOS heated tobacco growth potential in reduced-risk products.
PM trades at $202.39 (0.0% below 52-week high) with bullish MA alignment (price > MA20 > MA50 > MA200) and overbought RSI(14) at 68.2. The 27.1% 52-week return suggests strong momentum, though elevated RSI warrants caution near all-time highs.
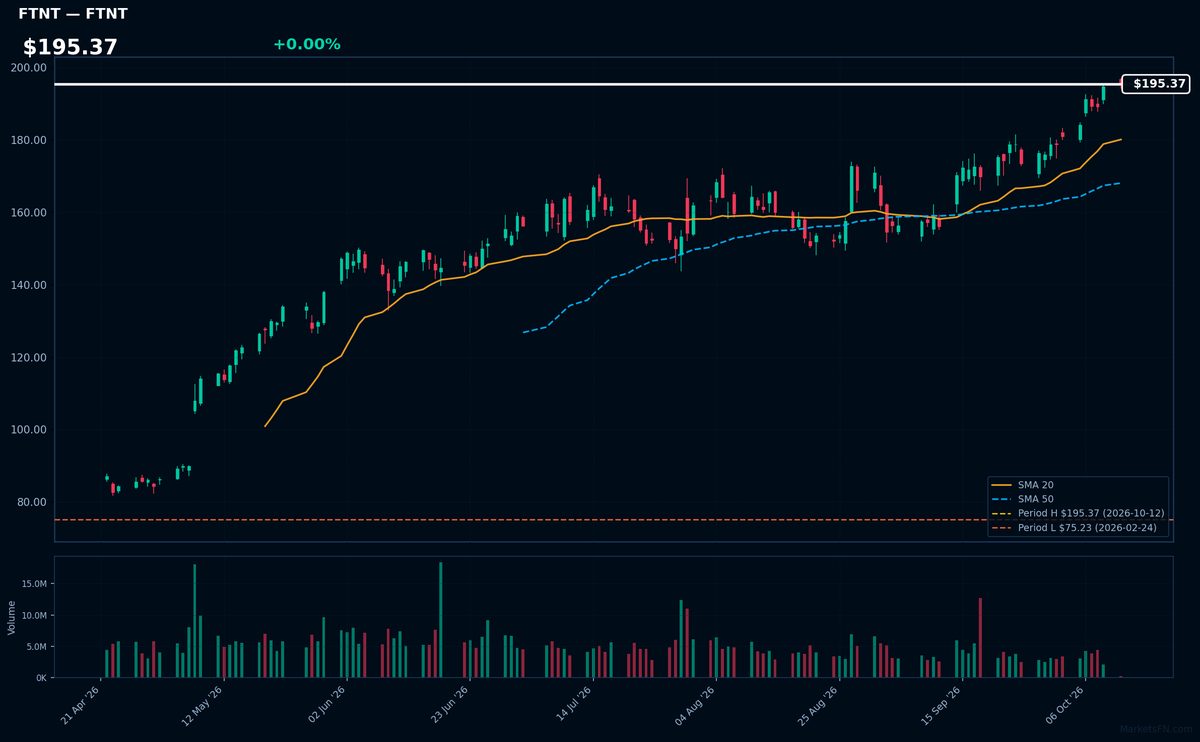
FTNT | Fortinet Inc | Technology | Price Last: $195.37 | % Realized: +132.03% | RSI: 73.1 | % above MA200: +60.3% | Trend: Above MA20, MA50, MA200
Fortinet provides cybersecurity solutions like firewalls and threat detection, critical as digital attacks surge. Investors care because its network security products are essential for enterprises globally, driving consistent demand in a high-growth sector.
FTNT shows strong bullish momentum: RSI(14) at 73.1 (near overbought) with price > MA20 > MA50 > MA200. Up 132% over 52 weeks and trading at its 52-week high, signaling sustained uptrend but potential near-term consolidation.
📉 Nearest to 52-Week Low
Sectors represented: Communication Services (3), Industrials (1), Consumer Defensive (1)
| Ticker | Company | Sector | Price Last | % Realized | 52-Week Low Date | RSI | % above MA200 | Trend |
|---|---|---|---|---|---|---|---|---|
| CMCSA | Comcast Corp | Communication Services | $20.56 | -25.41% | 2026-10-12 | 23.8 | -22.4% | Below MA20, MA50, MA200 |
| CHTR | Charter Communications Inc | Communication Services | $102.59 | -60.35% | 2026-10-12 | 27.3 | -40.3% | Below MA20, MA50, MA200 |
| TKO | TKO Group Holdings Inc | Communication Services | $173.62 | -7.94% | 2026-10-12 | 36.3 | -11.2% | Below MA20, MA50, MA200 |
| BLDR | Builders Firstsource Inc | Industrials | $52.22 | -56.74% | 2026-10-12 | 27.7 | -37.9% | Below MA20, MA50, MA200 |
| HRL | Hormel Foods Corp | Consumer Defensive | $19.18 | -18.56% | 2026-10-12 | 24.7 | -16.7% | Below MA20, MA50, MA200 |
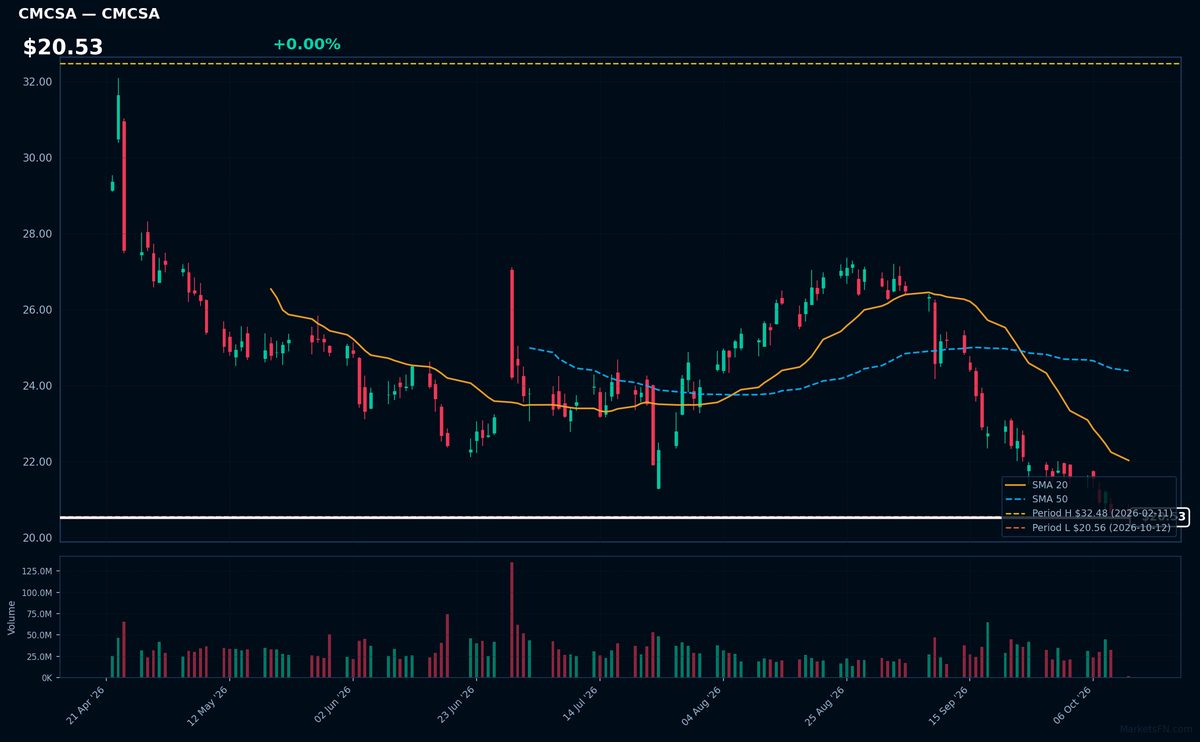
CMCSA | Comcast Corp | Communication Services | Price Last: $20.56 | % Realized: -25.41% | RSI: 23.8 | % above MA200: -22.4% | Trend: Below MA20, MA50, MA200
Comcast Corp operates as a global media and technology conglomerate, providing broadband, video, wireless, and streaming services through Xfinity, NBCUniversal, and Sky. Investors should monitor its infrastructure-heavy telecom dominance and content assets amid cord-cutting pressures.
CMCSA shows extreme technical weakness: RSI(14) at 23.8 signals oversold conditions amid a sustained downtrend (price < MA20 < MA50 < MA200). The stock tests 52-week lows (-25.4% YoY), suggesting capitulation. This alignment reflects bearish momentum, not fundamental strength.
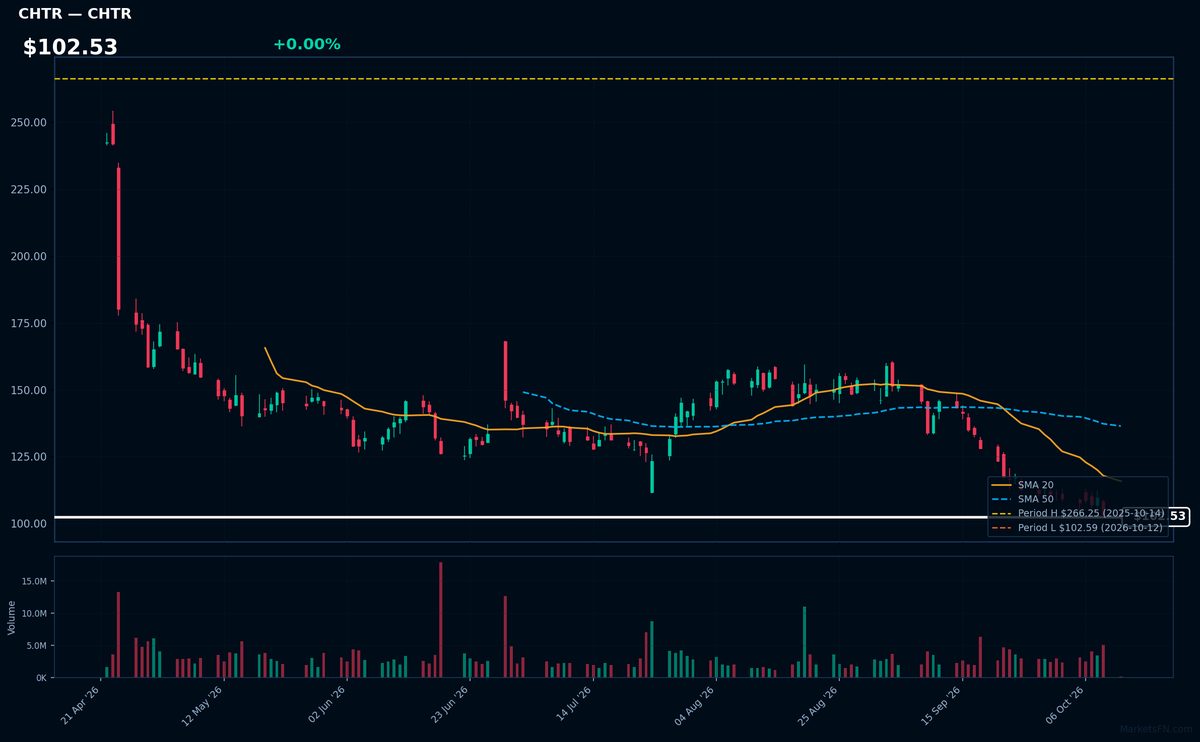
CHTR | Charter Communications Inc | Communication Services | Price Last: $102.59 | % Realized: -60.35% | RSI: 27.3 | % above MA200: -40.3% | Trend: Below MA20, MA50, MA200
Charter Communications Inc provides cable TV, internet, and voice services to residential and business customers under the Spectrum brand. Investors monitor its competitive position in broadband against telecom giants and streaming disruption.
CHTR shows extreme technical weakness: RSI(14) at 27.3 (oversold), bearish MA alignment (price < MA20 < MA50 < MA200), and -60.3% 52-week return. Testing 52-week low signals severe downtrend.
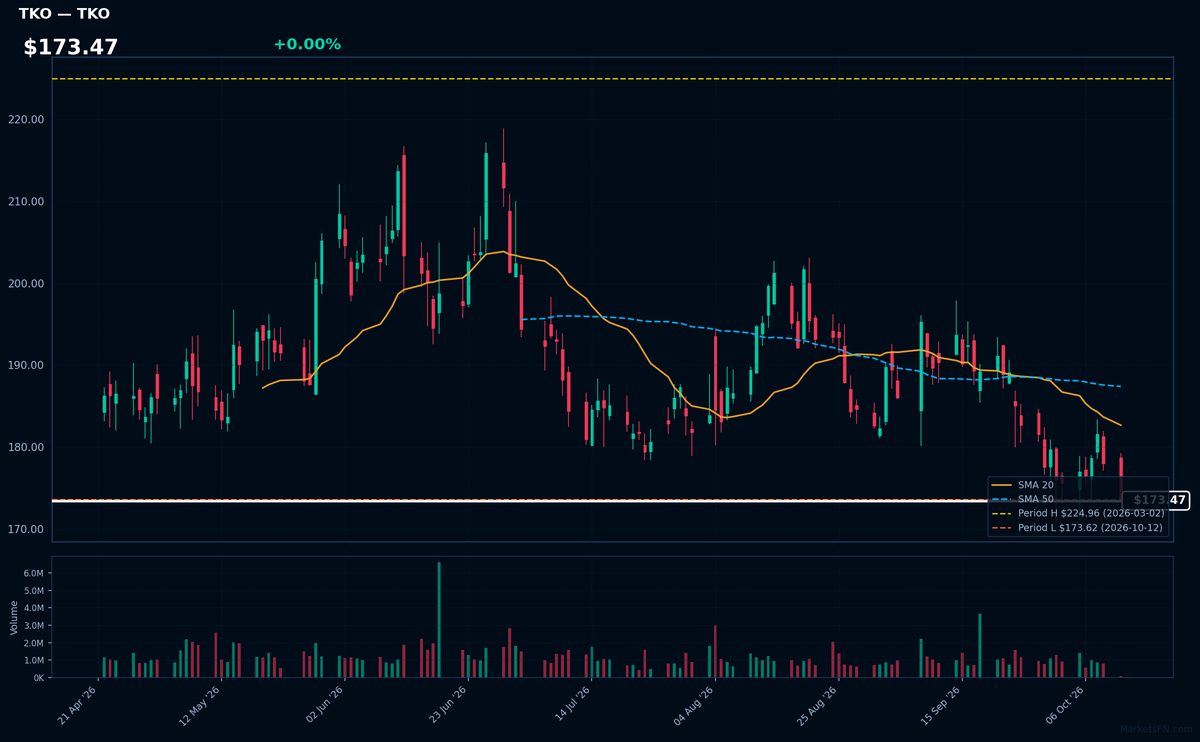
TKO | TKO Group Holdings Inc | Communication Services | Price Last: $173.62 | % Realized: -7.94% | RSI: 36.3 | % above MA200: -11.2% | Trend: Below MA20, MA50, MA200
TKO Group Holdings operates UFC and WWE as a combined live events/streaming combat sports powerhouse, leveraging exclusive content rights and pay-per-view economics in a global fanbase. Investors watch for media rights renewals and crossover superstars driving monetization.
Technically distressed at $173.47 (0.0% above 52W low), with RSI(14) at 36.3 and bearish MA alignment (price
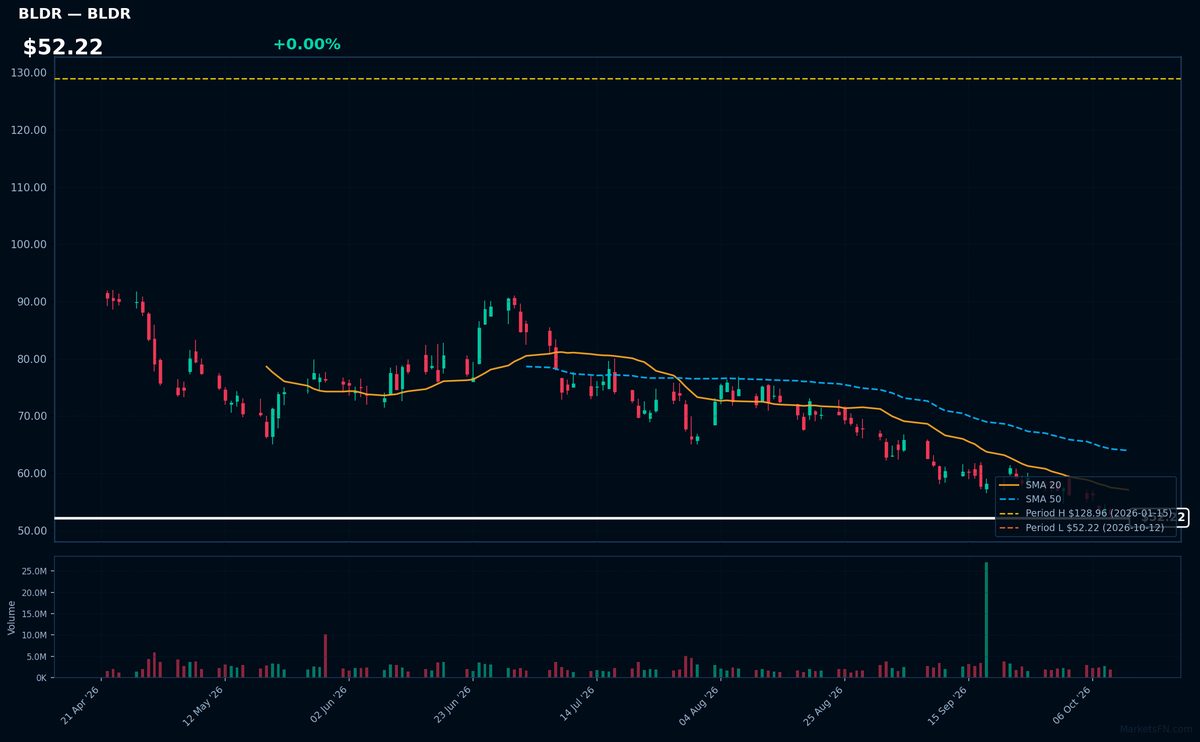
BLDR | Builders Firstsource Inc | Industrials | Price Last: $52.22 | % Realized: -56.74% | RSI: 27.7 | % above MA200: -37.9% | Trend: Below MA20, MA50, MA200
Builders Firstsource Inc supplies building materials to US homebuilders, directly exposed to housing cycles. Investors watch it for housing market health signals and construction sector leverage, with recent price action reflecting acute sector pressures.
BLDR shows extreme technical stress: RSI(14) at 27.7 (oversold), bearish MA alignment (price < MA20 < MA50 < MA200), and -56.7% 52-week return. Testing 52-week lows warns of persistent downtrend.
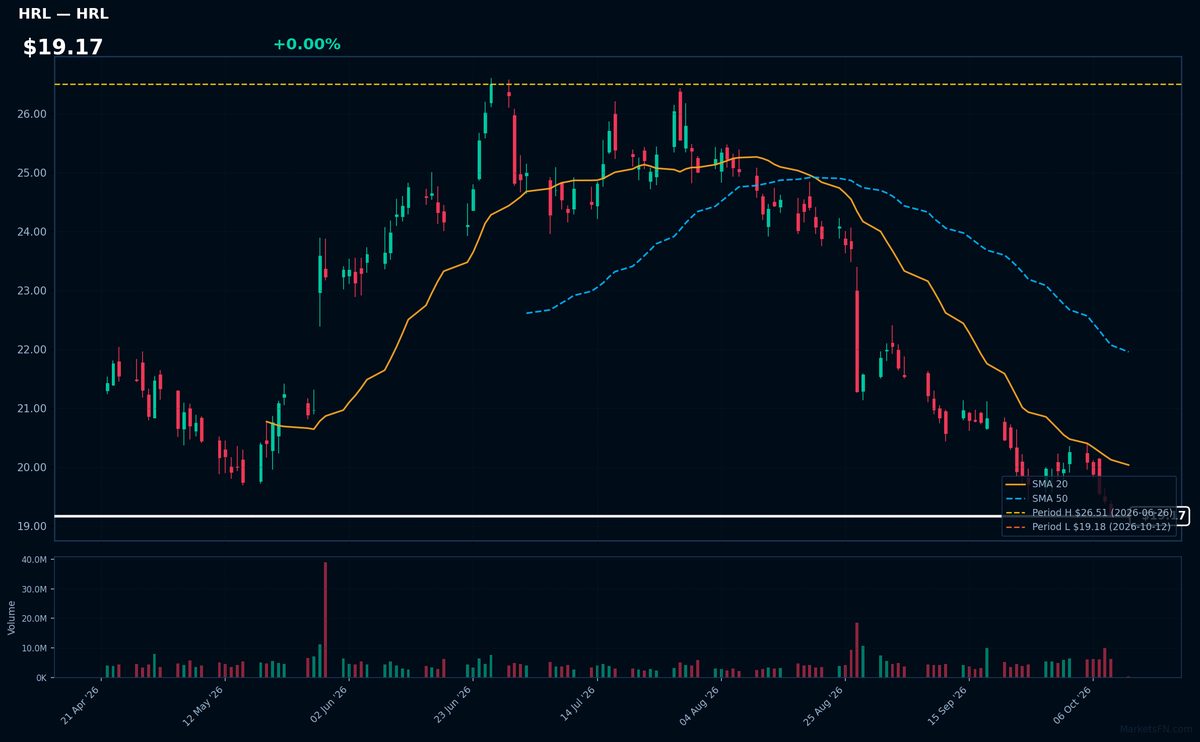
HRL | Hormel Foods Corp | Consumer Defensive | Price Last: $19.18 | % Realized: -18.56% | RSI: 24.7 | % above MA200: -16.7% | Trend: Below MA20, MA50, MA200
Hormel Foods produces branded packaged foods including Spam, Skippy peanut butter, and Jennie-O turkey. Investors watch it as a stable consumer staples play with pricing power in processed meats and shelf-stable products, though recent performance has lagged.
Technically broken: RSI(14) at 24.7 shows oversold conditions, but bearish MA alignment (price < MA20 < MA50 < MA200) and -18.6% annual return signal sustained downtrend. Testing 52-week lows.
Market Commentary
The concentration of S&P 500 stocks at 52-week extremes reflects divergent sector performance amid shifting macroeconomic conditions. Visa (V), Exxon Mobil (XOM), AbbVie (ABBV), Philip Morris (PM), and Fortinet (FTNT) trading at highs suggests strength in defensive sectors (healthcare, staples) and energy, likely driven by stable cash flows, dividend appeal, and geopolitical oil tailwinds. Conversely, Comcast (CMCSA), Charter (CHTR), TKO Group (TKO), Builders FirstSource (BLDR), and Hormel Foods (HRL) near lows highlight pressure on consumer discretionary, media, and housing-adjacent names amid elevated rates and softening demand.
Sector rotation favors low-beta, high-yield equities as investors hedge against potential growth slowdowns, while communication services and construction-linked stocks underperform due to cyclical headwinds. Energy (XOM) benefits from tight supply, while cybersecurity (FTNT) capitalizes on resilient enterprise spending. Media (CMCSA, CHTR) faces cord-cutting and ad weakness, and building materials (BLDR) contend with sluggish residential activity.
Key levels to monitor include the 52-week highs for defensive leaders, which may signal extended valuations if macro data improves, and the 52-week lows for cyclicals, where contrarian opportunities could emerge on Fed pivot expectations or housing stabilization. Catalysts include inflation prints, earnings revisions, and energy supply dynamics—any of which could accelerate mean reversion.
Methodology: All 503 S&P 500 constituents screened. 52-week high = highest daily close over the past 252 trading days (approx. 1 year). 52-week low = lowest daily close over the same period. Distance = (current price / extreme − 1) × 100. Technical indicators computed on up to 1 year of daily OHLCV data.
Disclaimer: For informational purposes only. Not investment advice. Past performance is not indicative of future results.