Nasdaq 100 2026 YTD Highs & Lows Radar: Palantir (PLTR), T-Mobile US (TMUS) and more
MarketsFN Team

Screening all 101 Nasdaq 100 constituents for stocks nearest to their 2026 year-to-date high and their 2026 YTD low. Data as of October 12, 2026. % Realized = total return since Jan 1 2026.
Legend: RSI > 70 = overbought · RSI < 30 = oversold · Green % Realized = positive YTD return · Red = negative.
📈 Nearest to 2026 High
Sectors represented: Technology (5)
| Ticker | Company | Sector | Price Last | % Realized | 2026 YTD High Date | RSI | % above MA200 | Trend |
|---|---|---|---|---|---|---|---|---|
| PLTR | Palantir Technologies Inc | Technology | $209.05 | +24.54% | 2026-10-09 | 76.9 | +37.2% | Above MA20, MA50, MA200 |
| SHOP | Shopify Inc | Technology | $170.85 | +8.68% | 2026-10-09 | 75.3 | +31.9% | Above MA20, MA50, MA200 |
| FTNT | Fortinet Inc | Technology | $194.75 | +150.06% | 2026-10-09 | 72.9 | +59.8% | Above MA20, MA50, MA200 |
| DDOG | Datadog Inc | Technology | $293.26 | +119.23% | 2026-10-09 | 73.6 | +55.1% | Above MA20, MA50, MA200 |
| TEAM | Atlassian Corporation | Technology | $206.79 | +33.62% | 2026-10-09 | 67.7 | +82.2% | Above MA20, MA50, MA200 |
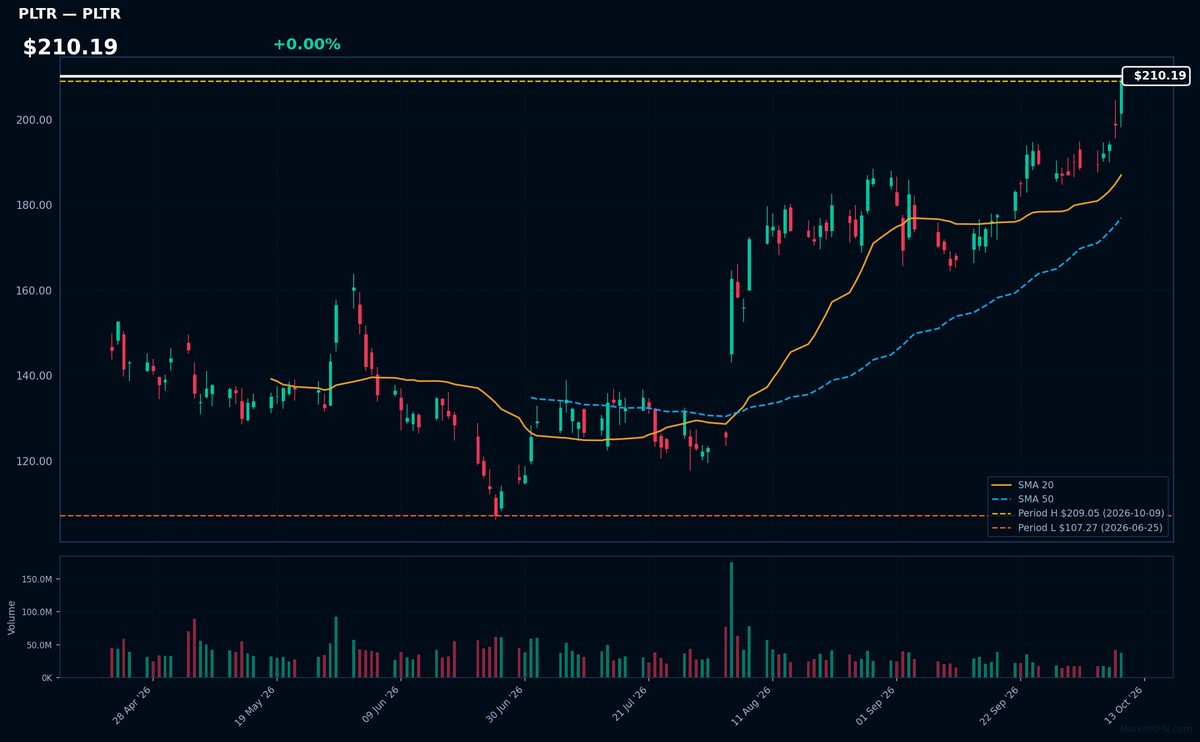
PLTR | Palantir Technologies Inc | Technology | Price Last: $209.05 | % Realized: +24.54% | RSI: 76.9 | % above MA200: +37.2% | Trend: Above MA20, MA50, MA200
Palantir provides AI-powered data analytics platforms for government and commercial clients, specializing in national security and enterprise decision-making. Investors care due to its unique positioning in classified government contracts and growing commercial adoption.
PLTR shows strong bullish momentum with RSI(14) at 76.9 and price > MA20 > MA50 > MA200 alignment. The stock is 24.5% YTD, testing all-time highs, suggesting continuation potential but elevated RSI warrants caution.
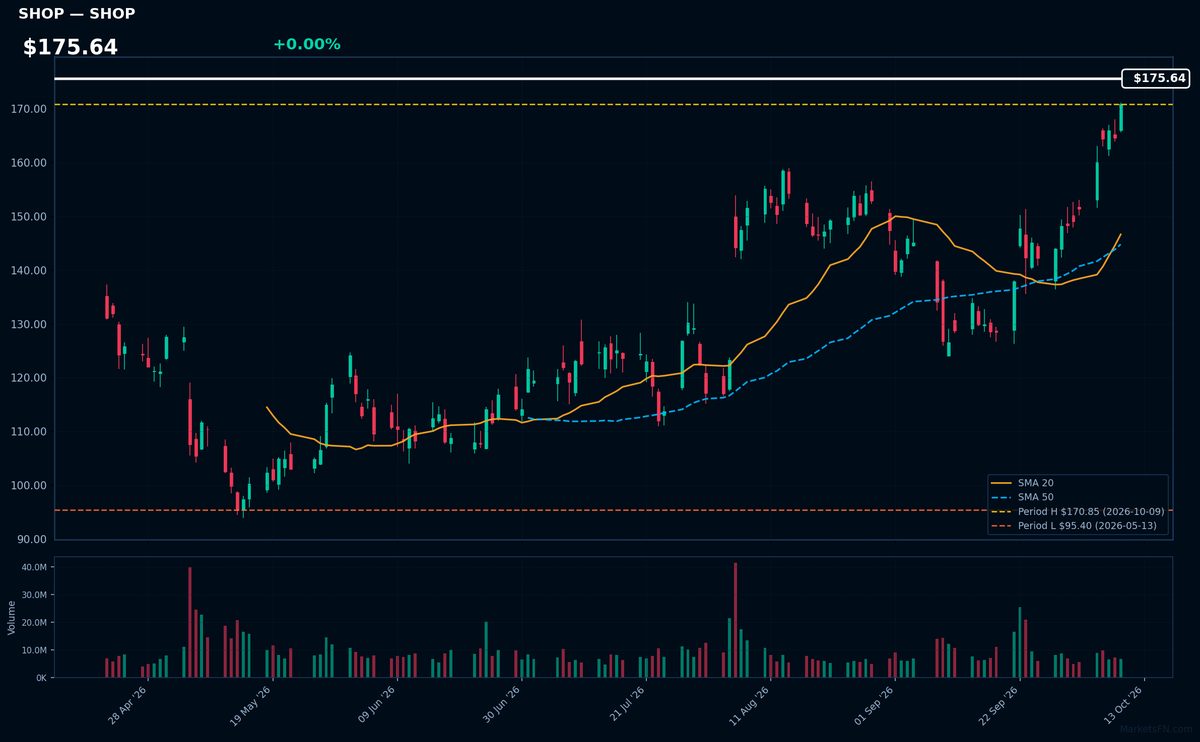
SHOP | Shopify Inc | Technology | Price Last: $170.85 | % Realized: +8.68% | RSI: 75.3 | % above MA200: +31.9% | Trend: Above MA20, MA50, MA200
Shopify provides cloud-based commerce tools enabling businesses to create online stores, process payments, and manage inventory. Investors care because it powers 10% of U.S. e-commerce and monetizes merchant growth through subscriptions and payment processing.
Technically bullish with RSI(14) at 75.3 (overbought) and price > MA20 > MA50 > MA200. Stock sits 0.0% below its 2026 high — extreme momentum but extended after 8.7% YTD gain.
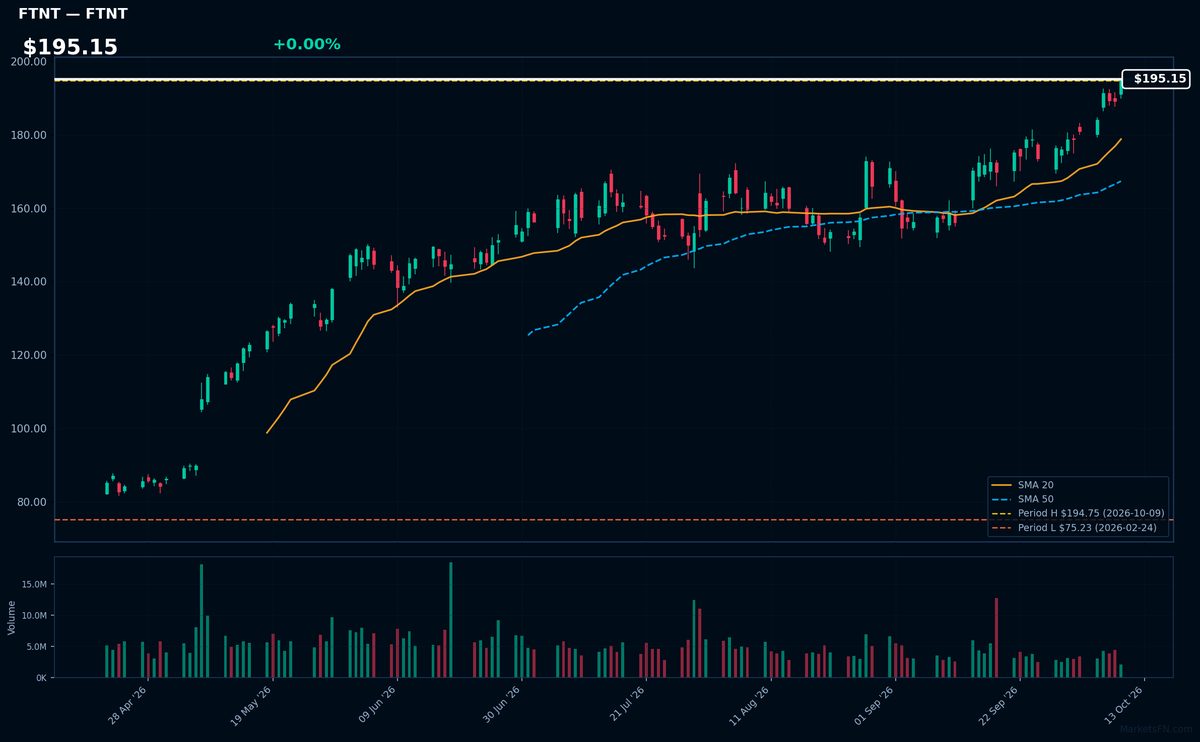
FTNT | Fortinet Inc | Technology | Price Last: $194.75 | % Realized: +150.06% | RSI: 72.9 | % above MA200: +59.8% | Trend: Above MA20, MA50, MA200
Fortinet provides cybersecurity solutions, specializing in network firewalls and threat detection. Investors care because enterprise security spending remains robust amid rising cyber threats, positioning FTNT for sustained growth in a mission-critical sector.
Technically overbought (RSI 72.9) but in strong uptrend (price > MA20 > MA50 > MA200). YTD 150.1% surge suggests momentum, though near YTD highs risks pullback.
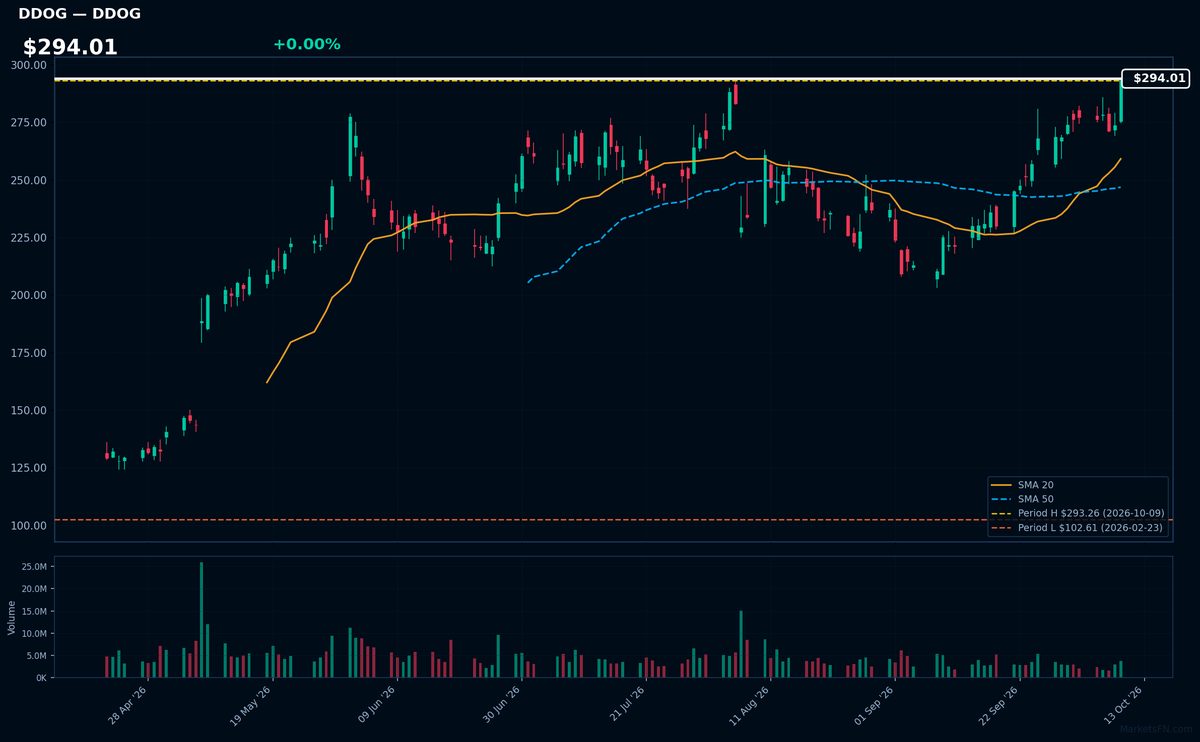
DDOG | Datadog Inc | Technology | Price Last: $293.26 | % Realized: +119.23% | RSI: 73.6 | % above MA200: +55.1% | Trend: Above MA20, MA50, MA200
Datadog provides cloud-based monitoring and analytics for developers and IT teams, helping enterprises optimize complex cloud infrastructures. Investors care because its tools are essential for modern cloud-native applications, driving consistent revenue growth in the expanding DevOps market.
Technically bullish with RSI(14) at 73.6 (overbought) and price > MA20 > MA50 > MA200 in sustained uptrend. Up 119.2% YTD, testing all-time highs — momentum extreme but no reversal signals yet.
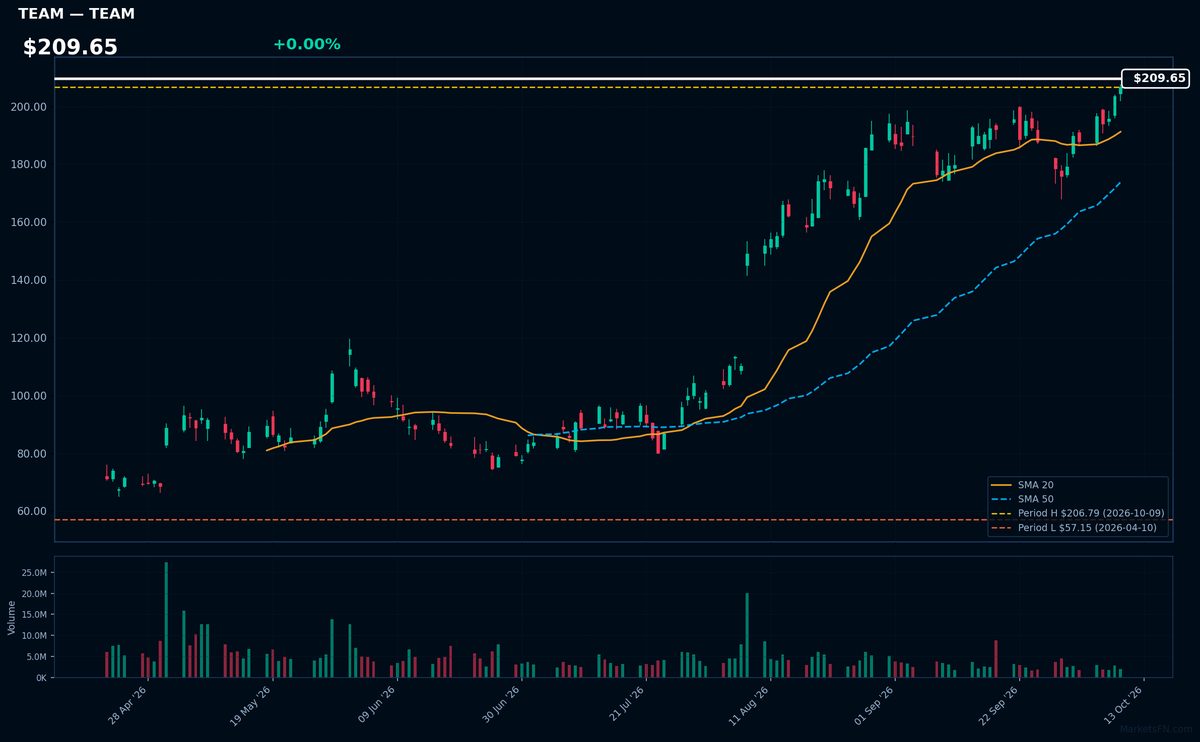
TEAM | Atlassian Corporation | Technology | Price Last: $206.79 | % Realized: +33.62% | RSI: 67.7 | % above MA200: +82.2% | Trend: Above MA20, MA50, MA200
Atlassian provides collaboration software (Jira, Confluence) for agile development teams. Investors care because its tools are mission-critical for software companies, creating sticky subscriptions with 33.6% YTD returns as enterprises prioritize DevOps efficiency.
Technically bullish: price at YTD highs with RSI(14) at 67.7 and sustained uptrend (price > MA20 > MA50 > MA200). Momentum suggests continuation, though RSI nears overbought.
📉 Nearest to 2026 Low
Sectors represented: Communication Services (4), Industrials (1)
| Ticker | Company | Sector | Price Last | % Realized | 2026 YTD Low Date | RSI | % above MA200 | Trend |
|---|---|---|---|---|---|---|---|---|
| TMUS | T-Mobile US Inc | Communication Services | $148.58 | -25.55% | 2026-10-09 | 33.1 | -21.9% | Below MA20, MA50, MA200 |
| CMCSA | Comcast Corp | Communication Services | $20.66 | -25.38% | 2026-10-09 | 24.3 | -22.0% | Below MA20, MA50, MA200 |
| CHTR | Charter Communications Inc | Communication Services | $103.38 | -50.60% | 2026-10-09 | 27.4 | -39.8% | Below MA20, MA50, MA200 |
| PCAR | Paccar Inc | Industrials | $108.04 | -3.16% | 2026-10-07 | 29.1 | -10.5% | Below MA20, MA50, MA200 |
| TTD | Trade Desk Inc | Communication Services | $12.08 | -67.94% | 2026-10-06 | 36.8 | -44.7% | Below MA20, MA50, MA200 |
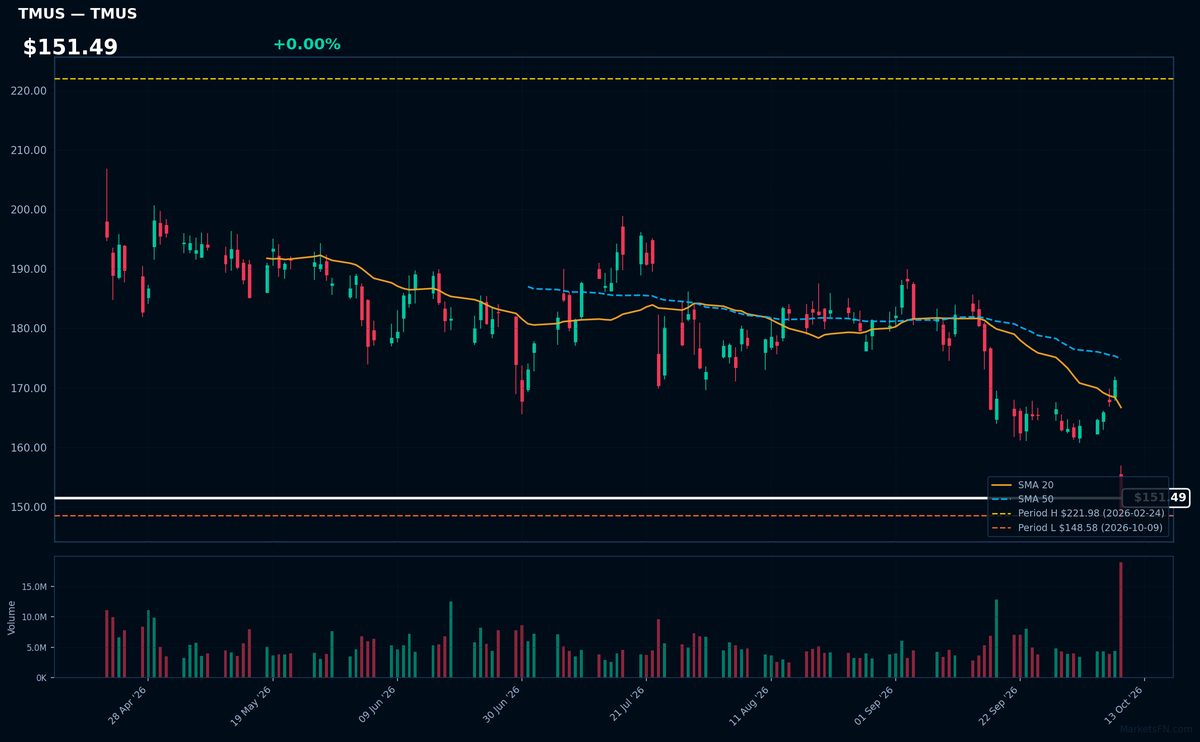
TMUS | T-Mobile US Inc | Communication Services | Price Last: $148.58 | % Realized: -25.55% | RSI: 33.1 | % above MA200: -21.9% | Trend: Below MA20, MA50, MA200
T-Mobile US Inc operates as a major wireless carrier in the U.S., known for aggressive pricing and network expansion. Investors watch its subscriber growth and 5G rollout, which drive revenue in the competitive telecom sector.
TMUS shows bearish momentum: RSI(14) at 33.1 (near oversold), with price ($151.49) below all key MAs. The stock tests 2026 lows (-25.6% YTD), signaling sustained downtrend and weak technicals.
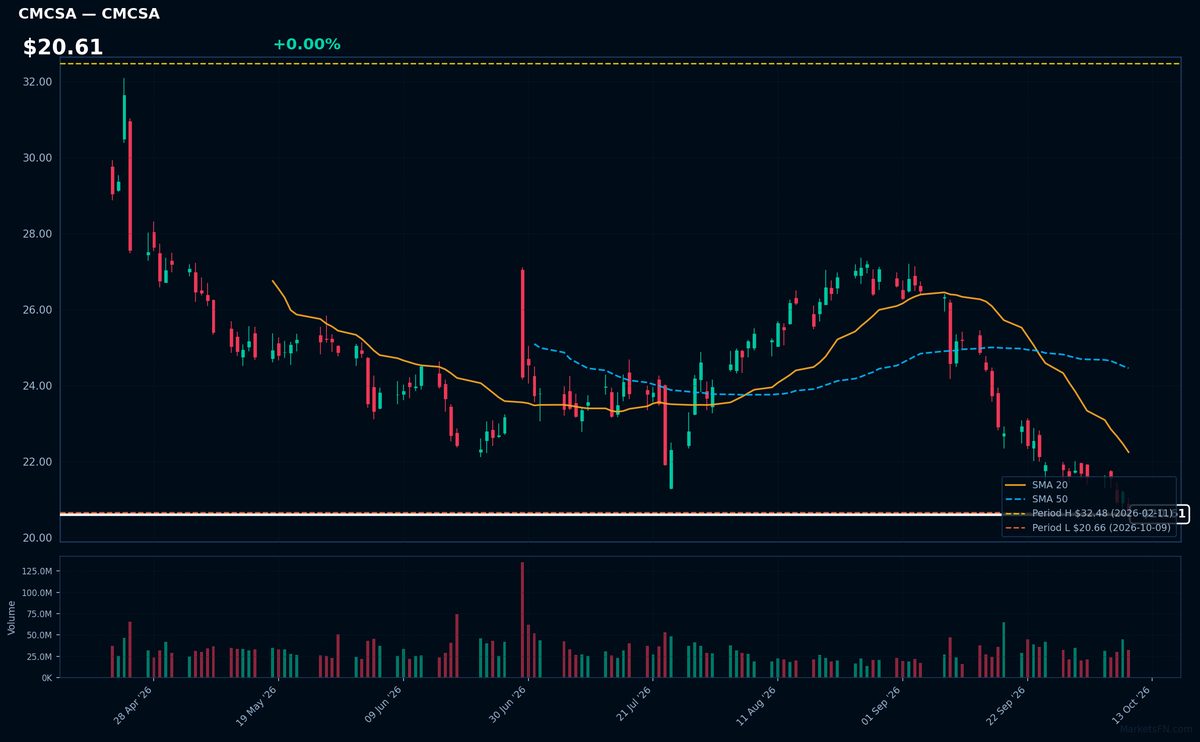
CMCSA | Comcast Corp | Communication Services | Price Last: $20.66 | % Realized: -25.38% | RSI: 24.3 | % above MA200: -22.0% | Trend: Below MA20, MA50, MA200
Comcast Corp operates as a media and technology conglomerate, providing broadband, video, and wireless services to residential and business customers. Investors monitor its cable dominance, NBCUniversal content assets, and streaming strategy in a competitive landscape.
CMCSA shows extreme technical weakness: RSI(14) at 24.3 (oversold) with sustained bearish MA alignment (price < MA20 < MA50 < MA200). The stock tests critical support, down 25.4% YTD — a clear warning sign absent fundamental catalysts.
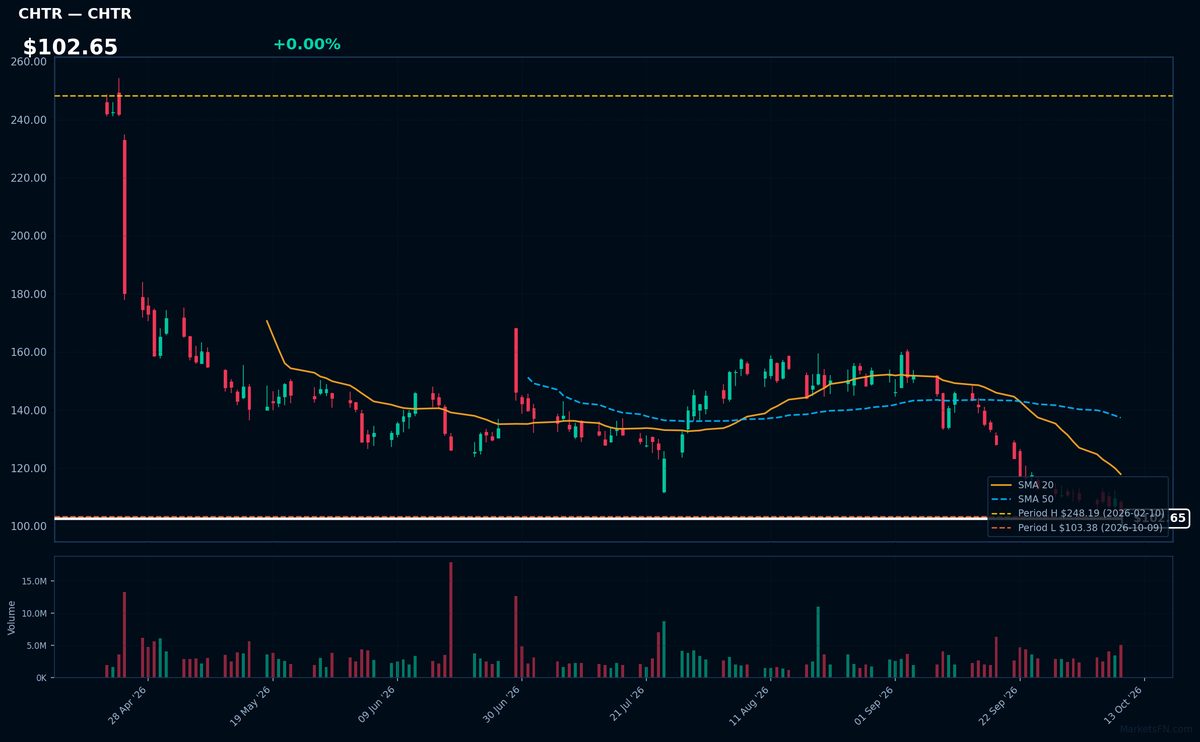
CHTR | Charter Communications Inc | Communication Services | Price Last: $103.38 | % Realized: -50.60% | RSI: 27.4 | % above MA200: -39.8% | Trend: Below MA20, MA50, MA200
Charter Communications Inc operates as a broadband connectivity and cable operator, providing essential internet, TV, and voice services to residential/business customers. Investors care because its infrastructure-heavy model generates recurring revenue, though cord-cutting and capex demands create volatility.
Severe technical warning: RSI(14) at 27.4 shows oversold conditions amid a sustained downtrend (price < MA20 < MA50 < MA200). Stock tests critical support, down 50.6% YTD — extreme bearish momentum. No fundamental strength evident in this price action.
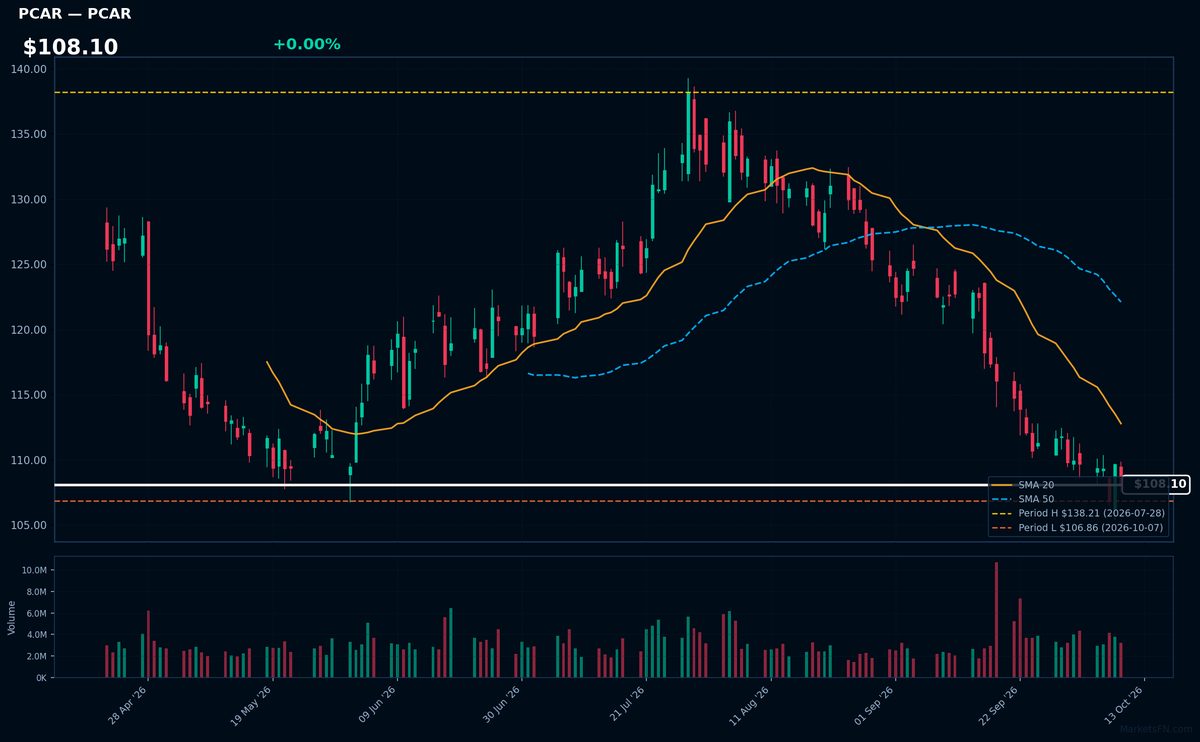
PCAR | Paccar Inc | Industrials | Price Last: $108.04 | % Realized: -3.16% | RSI: 29.1 | % above MA200: -10.5% | Trend: Below MA20, MA50, MA200
Paccar Inc designs/manufactures premium trucks (Kenworth, Peterbilt, DAF) and provides aftermarket parts/financing. Investors care due to its cyclical exposure to freight demand, strong brand equity in commercial vehicles, and consistent dividend payouts despite industry volatility.
Technically concerning: RSI(14) at 29.1 (oversold), below MA20/MA50/MA200, -3.2% YTD, just 1.1% above 2026 lows. Testing critical support — watch for breakdown or reversal.
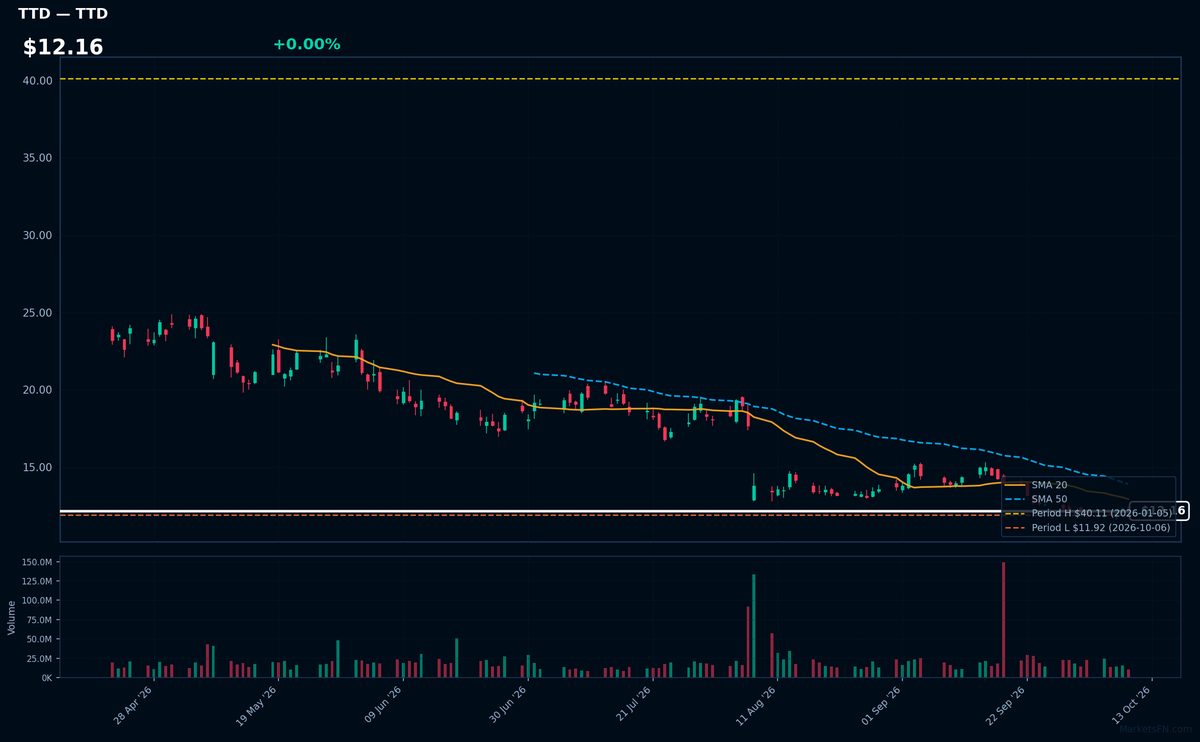
TTD | Trade Desk Inc | Communication Services | Price Last: $12.08 | % Realized: -67.94% | RSI: 36.8 | % above MA200: -44.7% | Trend: Below MA20, MA50, MA200
Trade Desk Inc operates a cloud-based platform for programmatic ad buying, enabling data-driven digital advertising. Investors care due to its dominant position in the growing programmatic ad market, though recent performance raises concerns.
TTD shows extreme technical weakness: RSI(14) at 36.8 signals near-oversold conditions, while the bearish MA alignment (price < MA20 < MA50 < MA200) confirms a sustained downtrend. The stock trades just 1.3% above its 2026 low after a 67.9% YTD decline — a critical support test.
Market Commentary
The concentration of Nasdaq 100 stocks at 2026 price extremes highlights a stark divergence in tech sector performance. Palantir, Shopify, Fortinet, Datadog, and Atlassian are all trading at their 2026 highs, reflecting sustained demand for AI/cloud infrastructure, cybersecurity, and productivity software. Conversely, T-Mobile, Comcast, Charter Communications, Paccar, and Trade Desk languish near lows, signaling persistent pressure on telecoms, ad-tech, and cyclical industrials amid higher capital costs and shifting consumption patterns.
This bifurcation underscores how macro conditions—tight monetary policy and AI-driven capex—are reshaping tech leadership. High-fliers benefit from enterprise digitization tailwinds and margin resilience, while asset-heavy or discretionary-exposed names face valuation compression. Trade Desk’s proximity to lows despite digital ad recovery suggests structural challenges, just as Fortinet’s strength confirms cybersecurity as a non-cyclical priority.
Investors should monitor bond yields and AI adoption metrics for high-multiple software names, while tracking broadband/telco capex cycles for depressed communication services. Traders may watch for mean-reversion opportunities in oversold ad-tech (TTD) or confirm breakout durability in cloud/AI plays (PLTR, DDOG). Any pivot in Fed policy or enterprise IT spending could force repricing at both extremes.
Methodology: All 101 Nasdaq 100 constituents screened. Close prices downloaded from 2026-01-01. Period high = highest close since Jan 1 2026; period low = lowest close since Jan 1 2026. Distance = (current price / period extreme − 1) × 100. Technical indicators computed on up to 1 year of daily OHLCV data.
Disclaimer: For informational purposes only. Not investment advice. Past performance is not indicative of future results.