S&P 500 2026 YTD Highs & Lows Radar: Microsoftoration (MSFT), T-Mobile US (TMUS) and more
MarketsFN Team

Screening all 503 S&P 500 constituents for stocks nearest to their 2026 year-to-date high and their 2026 YTD low. Data as of October 12, 2026. % Realized = total return since Jan 1 2026.
Legend: RSI > 70 = overbought · RSI < 30 = oversold · Green % Realized = positive YTD return · Red = negative.
📈 Nearest to 2026 High
Sectors represented: Technology (2), Financial (1), Healthcare (1), Consumer Defensive (1)
| Ticker | Company | Sector | Price Last | % Realized | 2026 YTD High Date | RSI | % above MA200 | Trend |
|---|---|---|---|---|---|---|---|---|
| MSFT | Microsoft Corporation | Technology | $535.07 | +13.14% | 2026-10-09 | 69.0 | +23.2% | Above MA20, MA50, MA200 |
| V | Visa Inc | Financial | $385.45 | +11.25% | 2026-10-09 | 69.6 | +13.9% | Above MA20, MA50, MA200 |
| PLTR | Palantir Technologies Inc | Technology | $209.05 | +24.54% | 2026-10-09 | 77.3 | +37.2% | Above MA20, MA50, MA200 |
| ABBV | Abbvie Inc | Healthcare | $276.47 | +20.57% | 2026-10-09 | 71.6 | +18.7% | Above MA20, MA50, MA200 |
| PM | Philip Morris International Inc | Consumer Defensive | $201.19 | +25.51% | 2026-10-09 | 67.5 | +12.4% | Above MA20, MA50, MA200 |
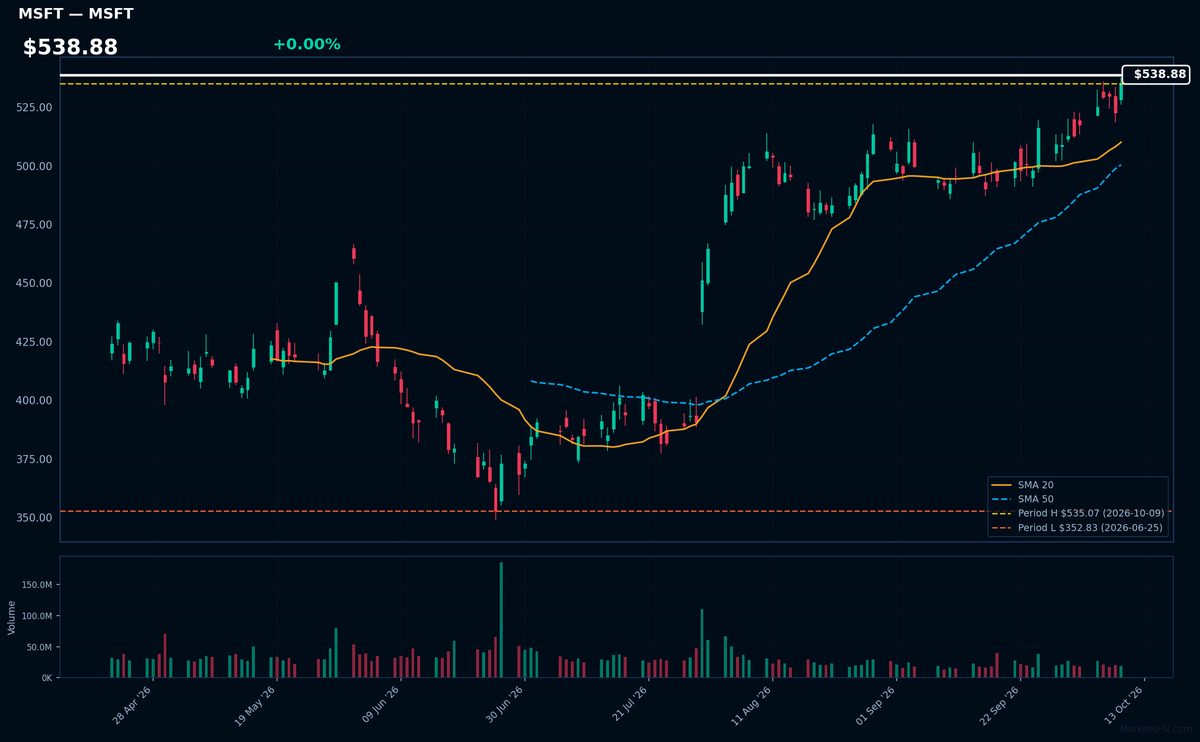
MSFT | Microsoft Corporation | Technology | Price Last: $535.07 | % Realized: +13.14% | RSI: 69.0 | % above MA200: +23.2% | Trend: Above MA20, MA50, MA200
Microsoft dominates enterprise software (Azure cloud, Office 365) and consumer tech (Windows, Xbox), with growing AI integration across products. Investors care due to its cash flow durability, cloud growth (Azure up 28% last quarter), and AI monetization potential via Copilot and OpenAI partnerships.
Technically bullish with RSI(14) at 69.0 and price > MA20 > MA50 > MA200, suggesting sustained momentum. However, 0.0% below YTD high and 13.1% YTD gain may warrant caution near resistance. MA alignment confirms uptrend but RSI nears overbought.
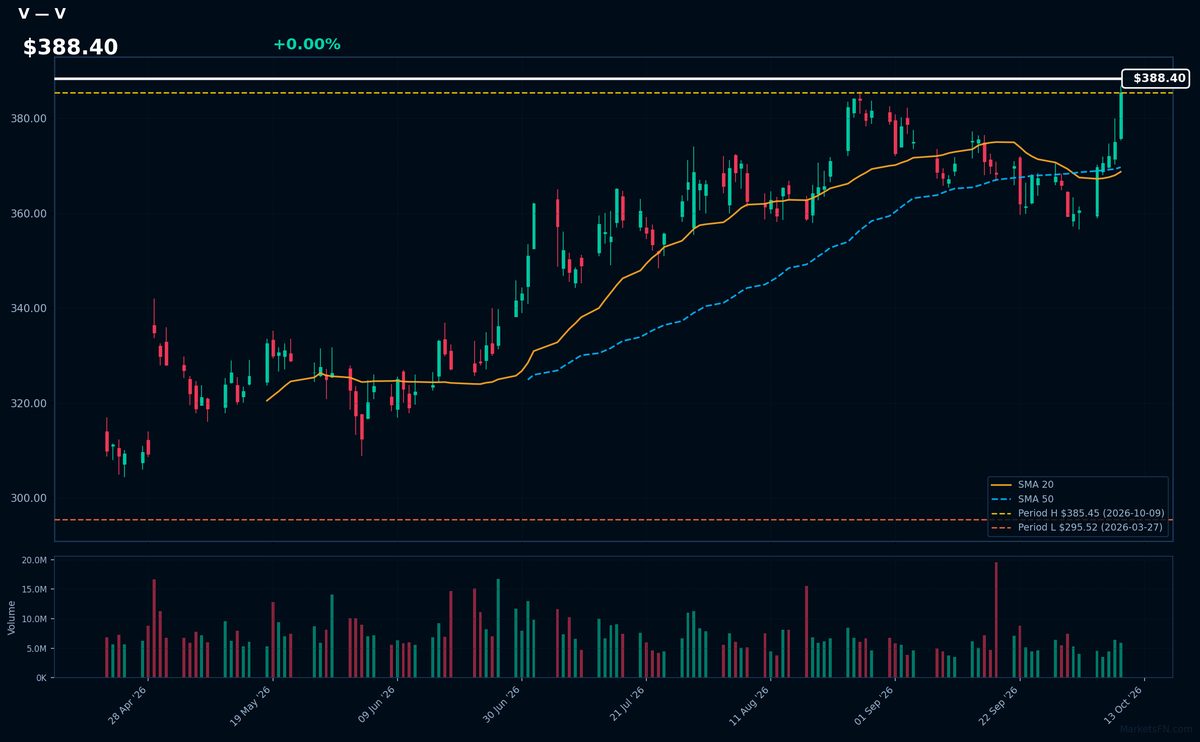
V | Visa Inc | Financial | Price Last: $385.45 | % Realized: +11.25% | RSI: 69.6 | % above MA200: +13.9% | Trend: Above MA20, MA50, MA200
Visa operates the world's largest payment network, processing $14.4 trillion annually. Investors care because its asset-light model (no credit risk) generates 58%+ operating margins as digital payments grow 10%+ yearly, with pricing power from its duopoly with Mastercard.
At $388.40, Visa trades 0.0% below its 2026 high with RSI(14) at 69.6 (near overbought) and mixed MA alignment (above MA20/MA50/MA200). The 11.2% YTD gain suggests momentum, but RSI warrants caution.
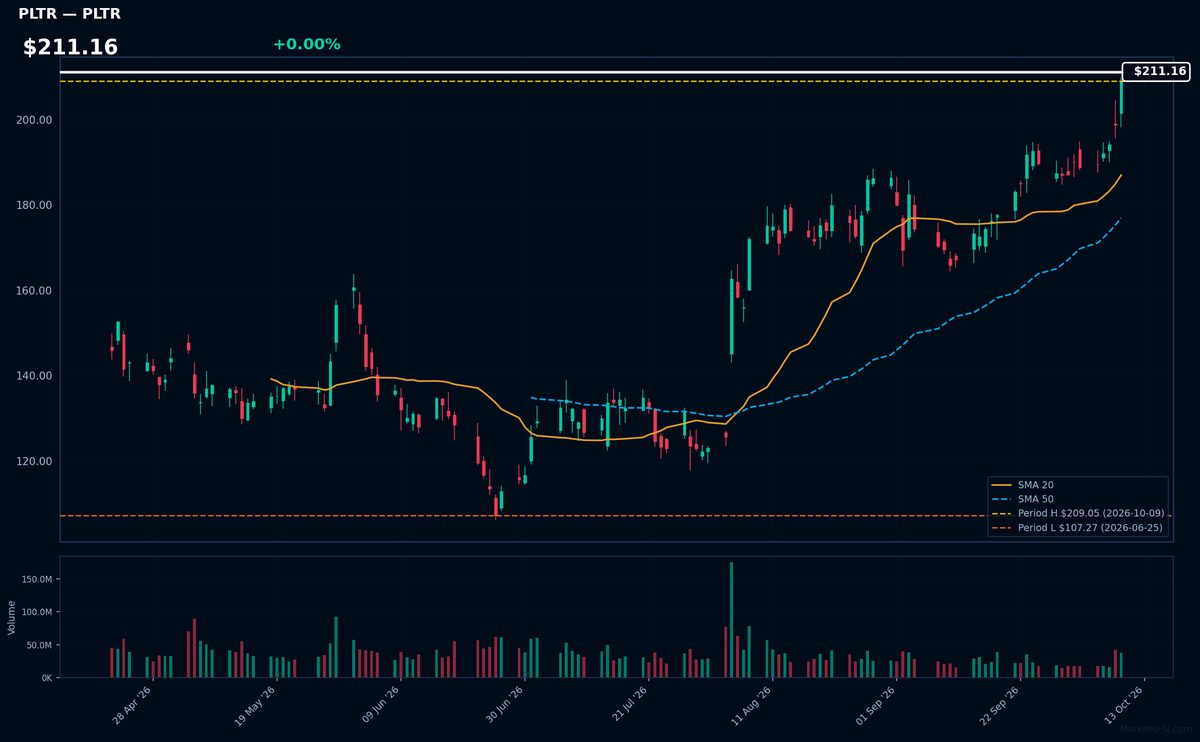
PLTR | Palantir Technologies Inc | Technology | Price Last: $209.05 | % Realized: +24.54% | RSI: 77.3 | % above MA200: +37.2% | Trend: Above MA20, MA50, MA200
Palantir provides AI-powered data analytics platforms for government and enterprise clients, specializing in national security and operational decision-making. Investors care due to its unique positioning in classified contracts and accelerating commercial adoption of its AI/ML tools.
PLTR shows extreme bullish momentum (RSI 77.3, price > MA20 > MA50 > MA200) after a 24.5% YTD surge. The 0.0% gap to YTD highs suggests breakout potential, though overbought RSI warrants caution.
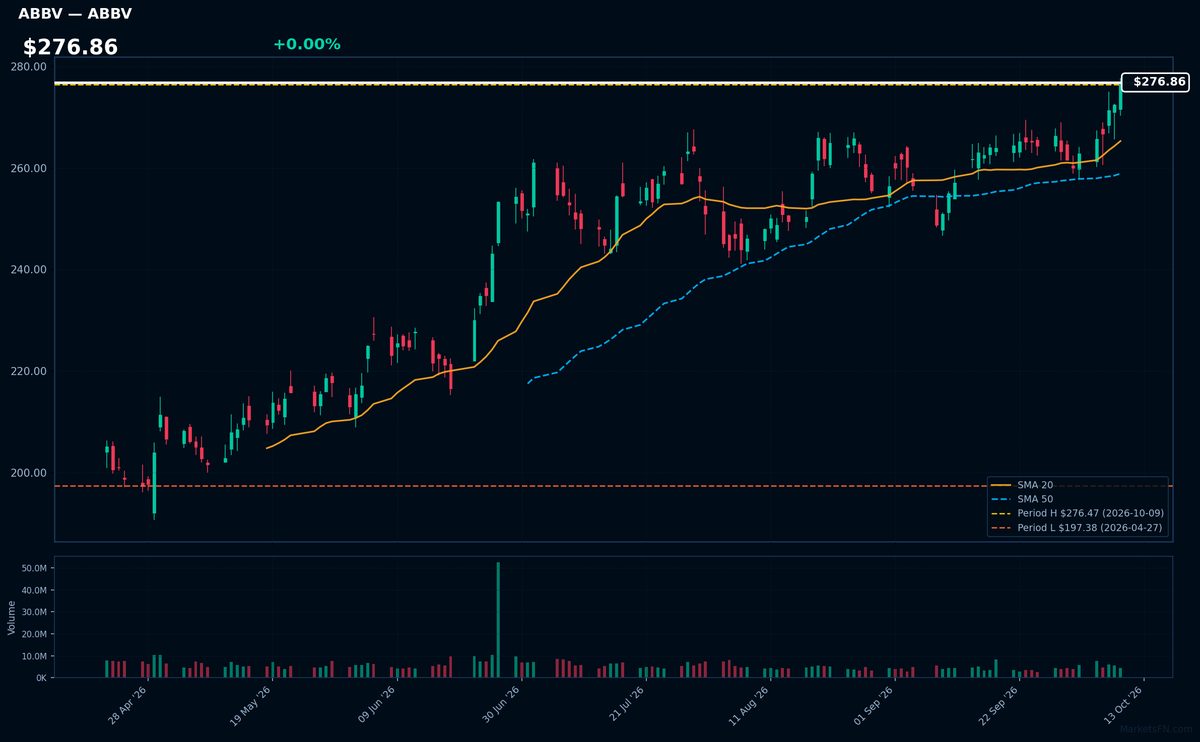
ABBV | Abbvie Inc | Healthcare | Price Last: $276.47 | % Realized: +20.57% | RSI: 71.6 | % above MA200: +18.7% | Trend: Above MA20, MA50, MA200
AbbVie Inc develops and markets pharmaceuticals, including blockbuster immunology drug Humira and newer therapies like Skyrizi. Investors care due to its high-margin biologic drugs, pipeline in neuroscience/oncology, and dividend growth, though Humira biosimilar competition remains a risk.
ABBV shows strong bullish momentum (RSI 71.6, price > MA20 > MA50 > MA200) and sits at YTD highs (+20.6% in 2026). The extreme RSI suggests overbought conditions may warrant caution despite the uptrend.
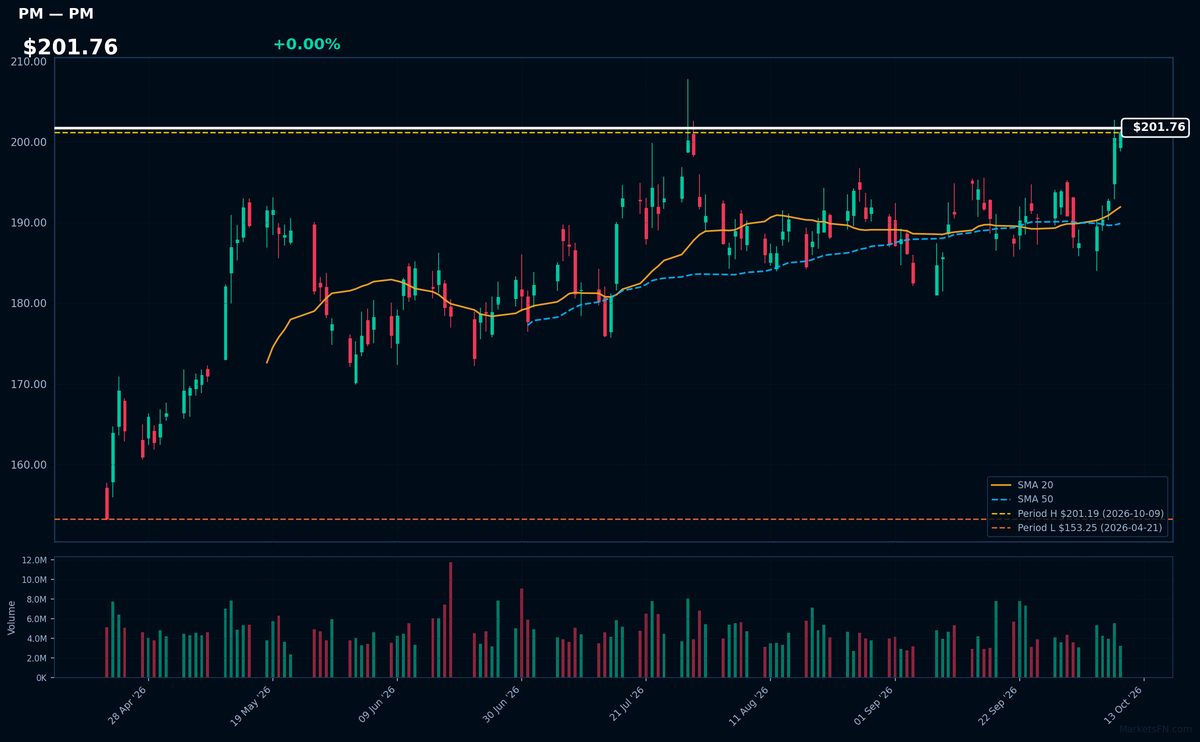
PM | Philip Morris International Inc | Consumer Defensive | Price Last: $201.19 | % Realized: +25.51% | RSI: 67.5 | % above MA200: +12.4% | Trend: Above MA20, MA50, MA200
Philip Morris International manufactures and sells cigarettes, heated tobacco, and nicotine products outside the U.S., including Marlboro. Investors watch PM for its global tobacco dominance, pricing power, and IQOS heated tobacco expansion as smoking rates decline.
PM shows bullish momentum with price ($201.76) above MA20>MA50>MA200 and RSI(14) at 67.5 (near overbought). The stock is flat versus its 2026 YTD high after a 25.5% YTD rally, suggesting extended but intact uptrend. Watch for breakout confirmation or RSI divergence.
📉 Nearest to 2026 Low
Sectors represented: Communication Services (3), Basic Materials (1), Industrials (1)
| Ticker | Company | Sector | Price Last | % Realized | 2026 YTD Low Date | RSI | % above MA200 | Trend |
|---|---|---|---|---|---|---|---|---|
| TMUS | T-Mobile US Inc | Communication Services | $148.58 | -25.55% | 2026-10-09 | 34.4 | -21.9% | Below MA20, MA50, MA200 |
| CMCSA | Comcast Corp | Communication Services | $20.66 | -25.38% | 2026-10-09 | 25.7 | -22.0% | Below MA20, MA50, MA200 |
| CHTR | Charter Communications Inc | Communication Services | $103.38 | -50.60% | 2026-10-09 | 27.5 | -39.8% | Below MA20, MA50, MA200 |
| MLM | Martin Marietta Materials, Inc | Basic Materials | $478.35 | -24.60% | 2026-10-09 | 38.4 | -18.2% | Below MA20, MA50, MA200 |
| BLDR | Builders Firstsource Inc | Industrials | $52.85 | -49.49% | 2026-10-09 | 28.7 | -37.2% | Below MA20, MA50, MA200 |
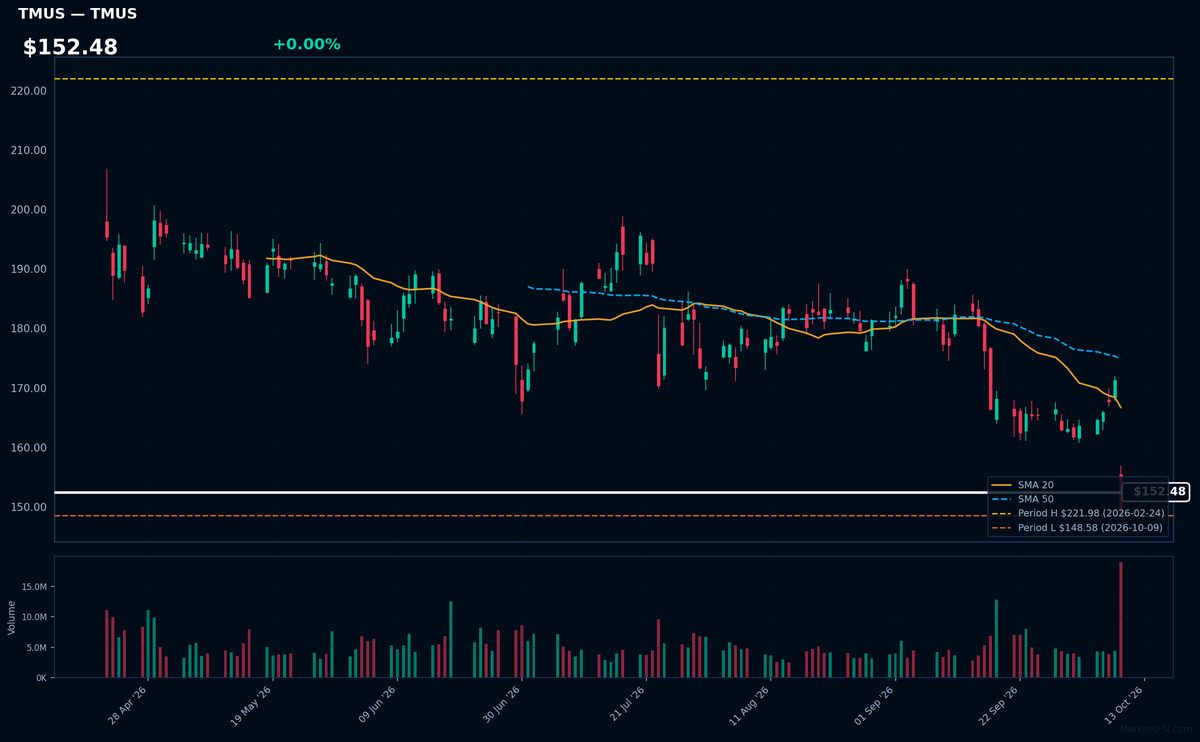
TMUS | T-Mobile US Inc | Communication Services | Price Last: $148.58 | % Realized: -25.55% | RSI: 34.4 | % above MA200: -21.9% | Trend: Below MA20, MA50, MA200
T-Mobile US Inc operates as a major wireless carrier in the U.S., known for disruptive pricing and aggressive 5G network expansion. Investors watch TMUS for its growth potential in mobile services and broadband, plus merger synergies from Sprint integration.
TMUS shows severe technical weakness: RSI(14) at 34.4 (approaching oversold) with a sustained downtrend (price $152.48 below bearish MA alignment). The stock tests critical support, down 25.6% YTD — a clear warning sign.
CMCSA | Comcast Corp | Communication Services | Price Last: $20.66 | % Realized: -25.38% | RSI: 25.7 | % above MA200: -22.0% | Trend: Below MA20, MA50, MA200
Comcast Corp operates as a global media and technology company, providing broadband, video, and phone services through Xfinity, along with content production through NBCUniversal. Investors monitor its infrastructure dominance and streaming transition amid cord-cutting pressures.
With RSI(14) at 25.7 and bearish MA alignment (price < MA20 < MA50 < MA200), CMCSA shows extreme weakness, down 25.4% YTD and testing 2026 lows. This signals oversold conditions but no technical recovery catalysts.
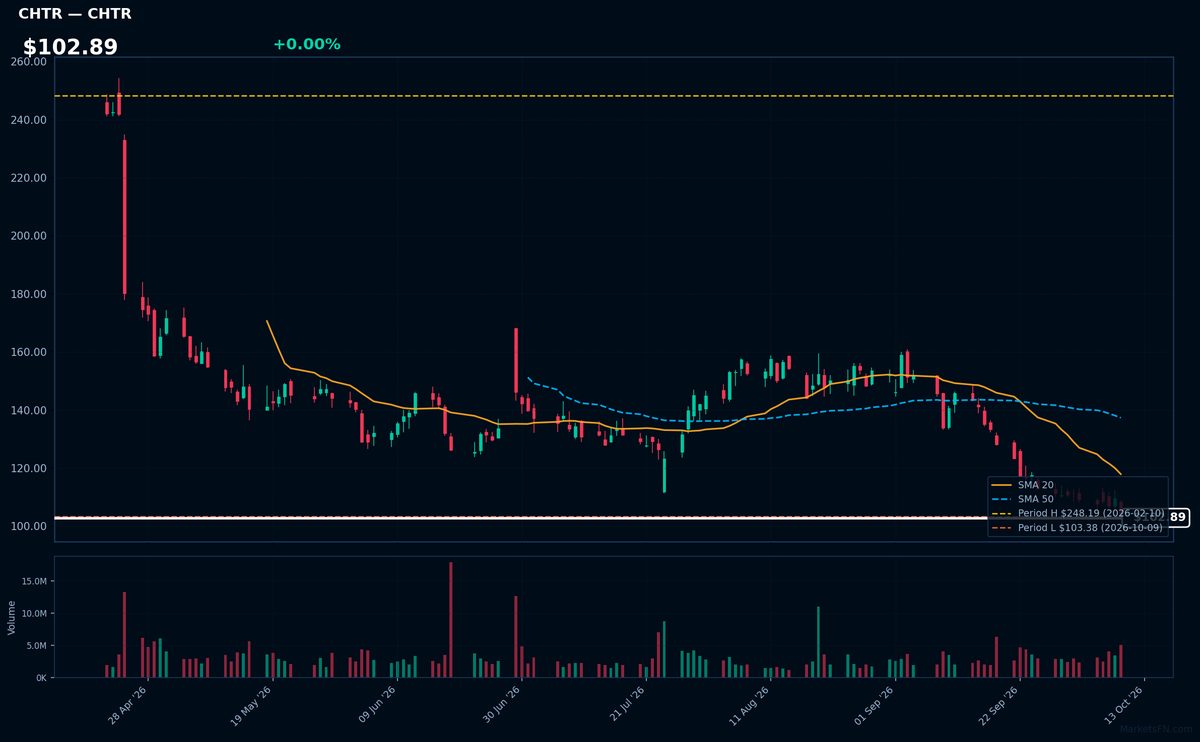
CHTR | Charter Communications Inc | Communication Services | Price Last: $103.38 | % Realized: -50.60% | RSI: 27.5 | % above MA200: -39.8% | Trend: Below MA20, MA50, MA200
Charter Communications Inc (CHTR) operates as a broadband connectivity and cable operator, providing essential internet/TV/voice services to residential/commercial customers. Investors monitor its infrastructure-heavy model for cash flow stability amid cord-cutting trends and broadband competition.
Technically dire: RSI(14) at 27.5 (oversold) with bearish MA alignment (price < MA20 < MA50 < MA200). Testing YTD lows after -50.6% decline warns of sustained downtrend.
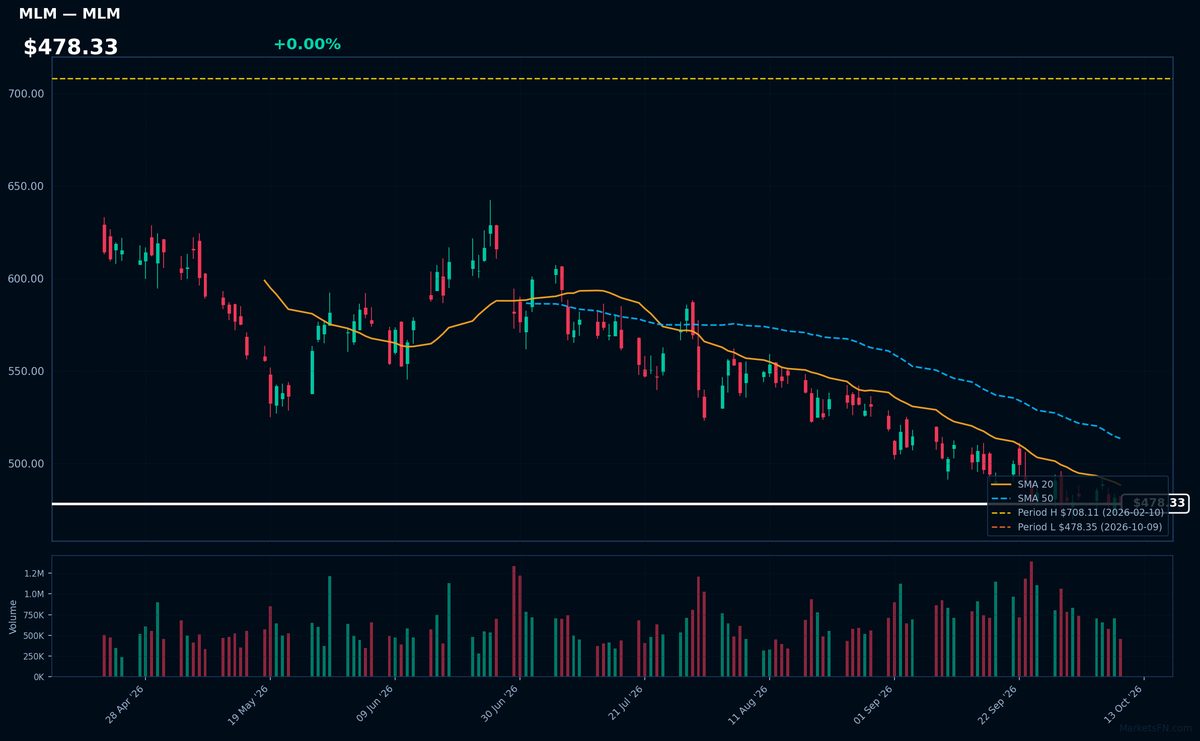
MLM | Martin Marietta Materials, Inc | Basic Materials | Price Last: $478.35 | % Realized: -24.60% | RSI: 38.4 | % above MA200: -18.2% | Trend: Below MA20, MA50, MA200
Martin Marietta Materials supplies construction aggregates (crushed stone, sand, gravel) and heavy building materials to infrastructure and commercial markets. Investors track it as a cyclical bellwether for U.S. construction activity and public works spending.
Severe technical deterioration: RSI(14) at 38.4 shows oversold conditions amid bearish MA alignment (price < MA20 < MA50 < MA200). Testing 2026 lows after -24.6% YTD decline signals breakdown risk.
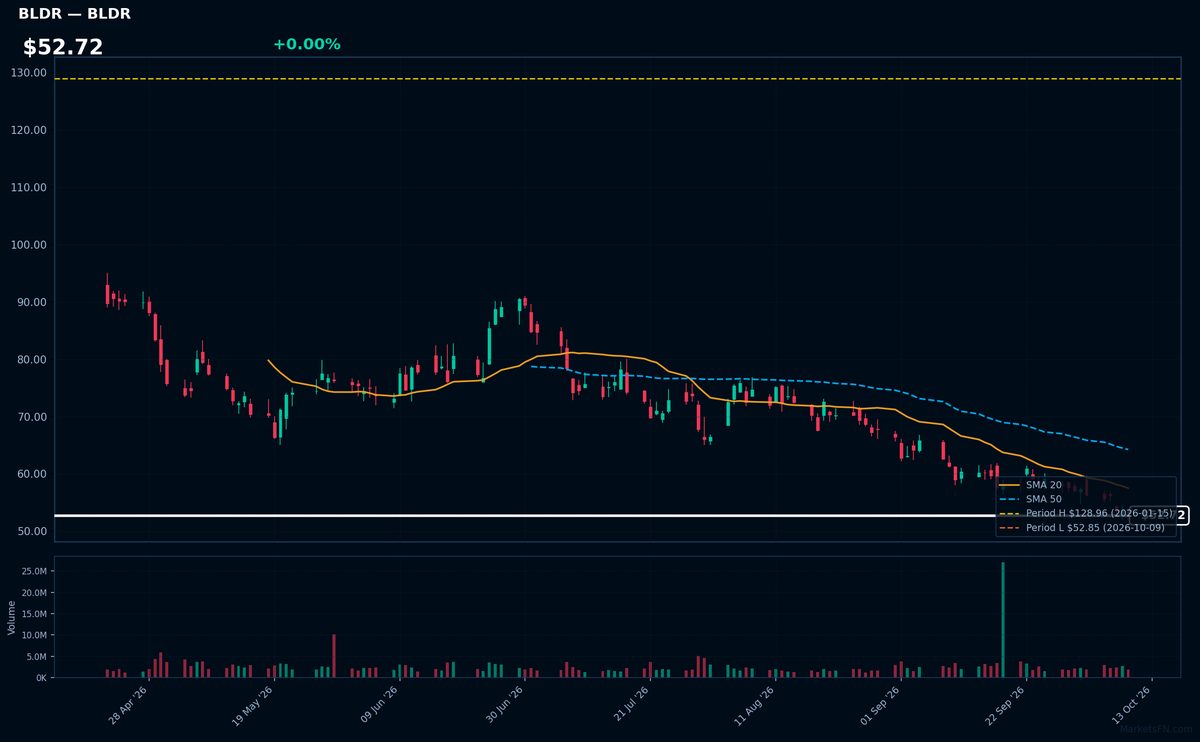
BLDR | Builders Firstsource Inc | Industrials | Price Last: $52.85 | % Realized: -49.49% | RSI: 28.7 | % above MA200: -37.2% | Trend: Below MA20, MA50, MA200
Builders Firstsource Inc supplies structural components, prefabricated materials, and value-added services to US homebuilders. Investors track BLDR as a leveraged play on housing starts and renovation activity, with cyclical sensitivity to interest rates and construction demand.
BLDR shows extreme technical weakness: RSI(14) at 28.7 (oversold), bearish MA alignment (price < MA20 < MA50 < MA200), and -49.5% YTD decline. Testing 2026 lows suggests capitulation risk.
Market Commentary
The concentration of S&P 500 stocks at 2026 extremes—Microsoft (MSFT), Visa (V), Palantir (PLTR), AbbVie (ABBV), and Philip Morris (PM) at highs versus T-Mobile (TMUS), Comcast (CMCSA), Charter (CHTR), Martin Marietta (MLM), and Builders FirstSource (BLDR) at lows—reflects persistent market bifurcation. Leaders cluster in tech (MSFT, PLTR), payments (V), and defensive healthcare/consumer staples (ABBV, PM), while laggards are concentrated in telecom (TMUS, CMCSA, CHTR) and cyclical materials/construction (MLM, BLDR). This suggests investors continue rewarding secular growth and cash-flow stability while shunning capital-intensive or rate-sensitive sectors.
Sector themes reveal a risk-off tilt beneath the index's surface. The dominance of tech and defensive names at highs aligns with expectations of prolonged higher rates favoring companies with pricing power and balance sheet strength. Conversely, telecoms face margin pressure from infrastructure costs, while materials/construction stocks (MLM, BLDR) likely reflect softness in commercial real estate and housing affordability concerns. The absence of energy or financials at either extreme underscores their middling performance amid volatile commodity prices and mixed credit conditions.
Investors should monitor whether this divergence narrows, particularly if rate-cut expectations revive or cyclical demand improves. Key catalysts include Fed policy shifts, telecom capex trends, and construction activity data. The resilience of tech/defensive leaders—especially MSFT and PLTR in AI-driven growth—versus potential mean reversion in oversold sectors like telecom will test the market's equilibrium. Sector rotation risks loom if macroeconomic conditions pivot.
Methodology: All 503 S&P 500 constituents screened. Close prices downloaded from 2026-01-01. Period high = highest close since Jan 1 2026; period low = lowest close since Jan 1 2026. Distance = (current price / period extreme − 1) × 100. Technical indicators computed on up to 1 year of daily OHLCV data.
Disclaimer: For informational purposes only. Not investment advice. Past performance is not indicative of future results.