Nasdaq 100 52-Week Highs & Lows Radar: Apple (AAPL), Comcast (CMCSA) and more
MarketsFN Team

Screening all 101 Nasdaq 100 constituents for stocks nearest to their 52-week high and their 52-week low. Data as of October 12, 2026. % Realized = 52-week total return.
Legend: RSI > 70 = overbought · RSI < 30 = oversold · Green % Realized = positive 52W return · Red = negative.
📈 Nearest to 52-Week High
Sectors represented: Technology (4), Healthcare (1)
| Ticker | Company | Sector | Price Last | % Realized | 52-Week High Date | RSI | % above MA200 | Trend |
|---|---|---|---|---|---|---|---|---|
| AAPL | Apple Inc | Technology | $341.89 | +38.05% | 2026-10-12 | 61.1 | +17.4% | Above MA20, MA50, MA200 |
| FTNT | Fortinet Inc | Technology | $195.20 | +131.83% | 2026-10-12 | 73.0 | +60.2% | Above MA20, MA50, MA200 |
| TEAM | Atlassian Corporation | Technology | $208.16 | +39.34% | 2026-10-12 | 66.9 | +83.4% | Above MA20, MA50, MA200 |
| BIIB | Biogen Inc | Healthcare | $231.93 | +60.29% | 2026-10-12 | 62.8 | +17.9% | Above MA20, MA50, MA200 |
| DDOG | Datadog Inc | Technology | $292.54 | +78.16% | 2026-10-09 | 72.6 | +54.7% | Above MA20, MA50, MA200 |
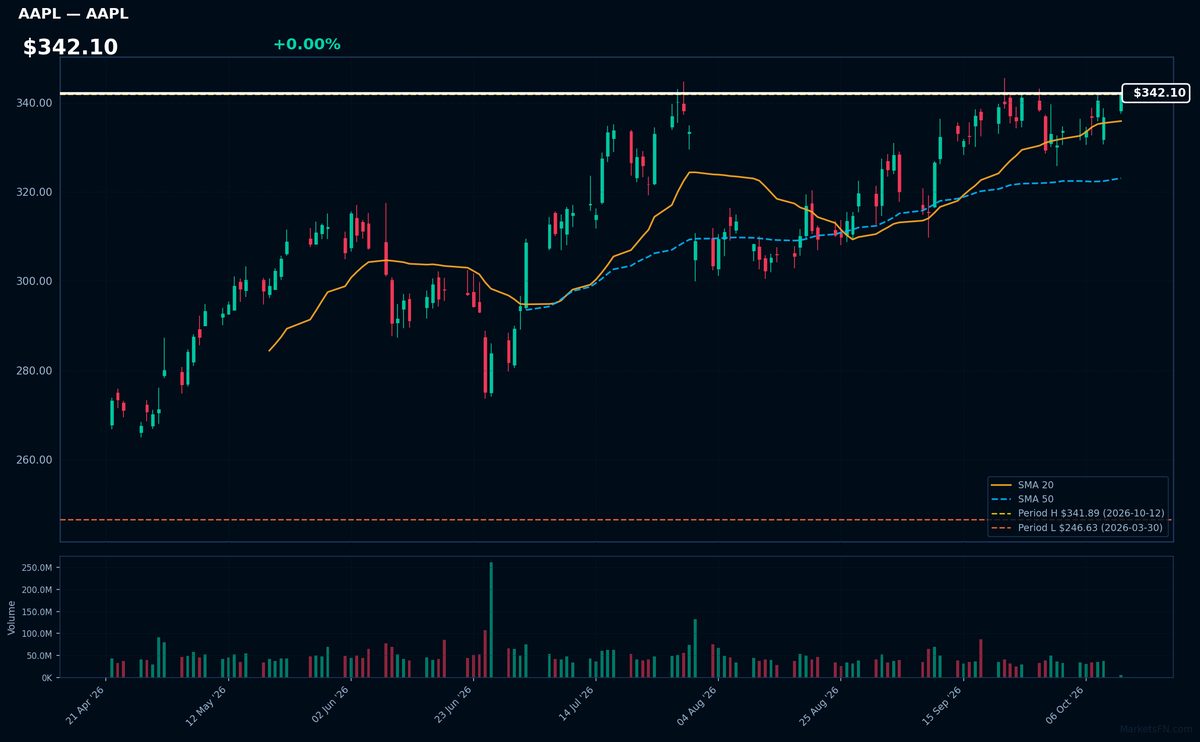
AAPL | Apple Inc | Technology | Price Last: $341.89 | % Realized: +38.05% | RSI: 61.1 | % above MA200: +17.4% | Trend: Above MA20, MA50, MA200
Apple Inc designs premium consumer electronics (iPhone, Mac), services (App Store, iCloud), and wearables (Apple Watch). Investors care because its ecosystem drives recurring revenue and industry-leading margins, with 38.0% returns over the past year demonstrating pricing power and brand loyalty.
AAPL shows bullish momentum with RSI(14) at 61.1 (neutral) and a sustained uptrend (price > MA20 > MA50 > MA200). At 0.0% below its 52-week high, it tests breakout levels. The 38.0% annual return suggests strength, but proximity to highs warrants caution.
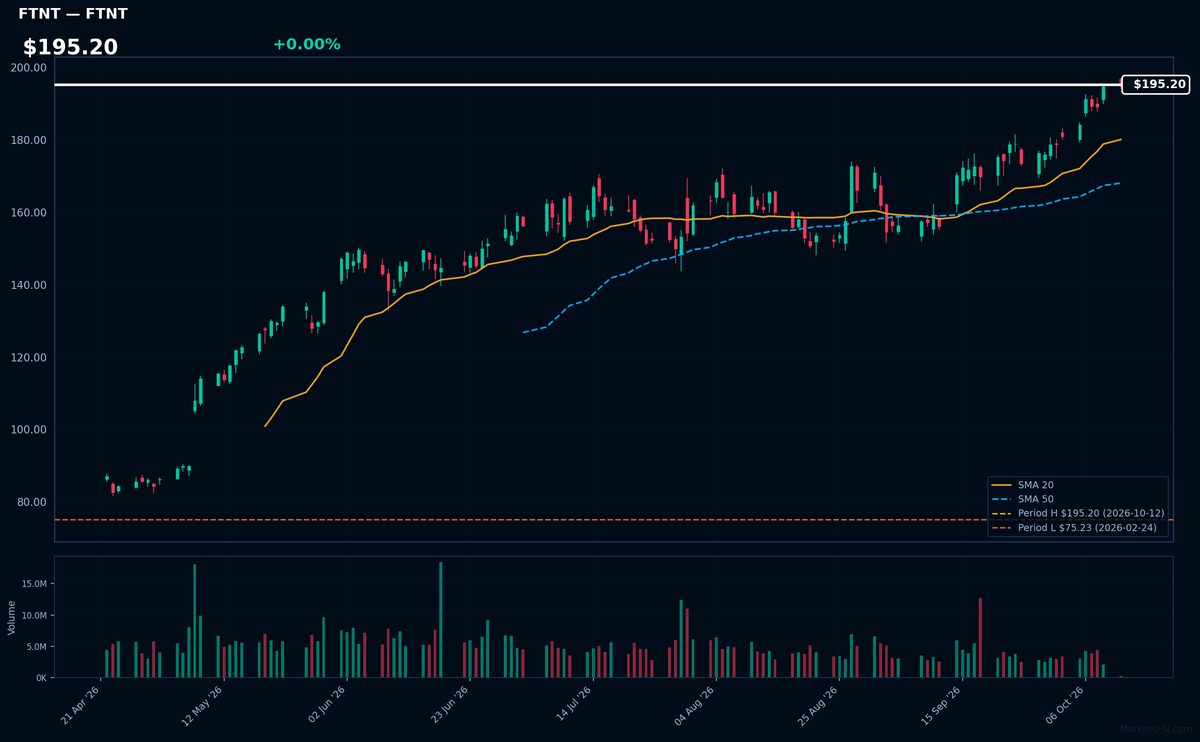
FTNT | Fortinet Inc | Technology | Price Last: $195.20 | % Realized: +131.83% | RSI: 73.0 | % above MA200: +60.2% | Trend: Above MA20, MA50, MA200
Fortinet provides cybersecurity solutions, including firewalls and threat detection, as enterprises prioritize digital defense. Investors care because cyber threats are escalating, driving consistent demand for its integrated security platforms.
FTNT shows bullish momentum with price above all key MAs (20/50/200) and RSI(14) at 73.0, near overbought. The stock sits at its 52-week high after a 131.8% surge, signaling strong uptrend continuation potential.
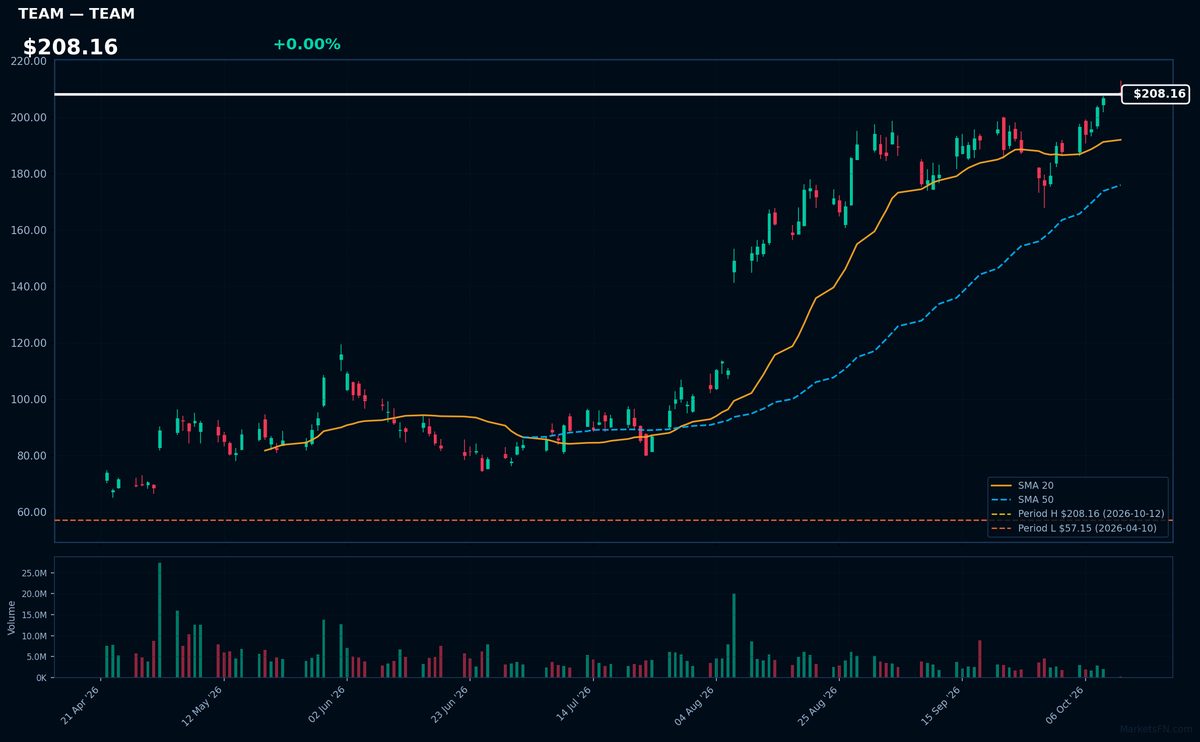
TEAM | Atlassian Corporation | Technology | Price Last: $208.16 | % Realized: +39.34% | RSI: 66.9 | % above MA200: +83.4% | Trend: Above MA20, MA50, MA200
Atlassian provides collaboration software (Jira, Confluence) for agile development teams. Investors care because its tools are mission-critical for software developers, creating sticky enterprise subscriptions with 39.3% annual price appreciation.
Technically bullish with RSI(14) at 66.9 (approaching overbought) and price > MA20 > MA50 > MA200. At 52-week highs, testing breakout after 39.3% annual gain — monitor for exhaustion.
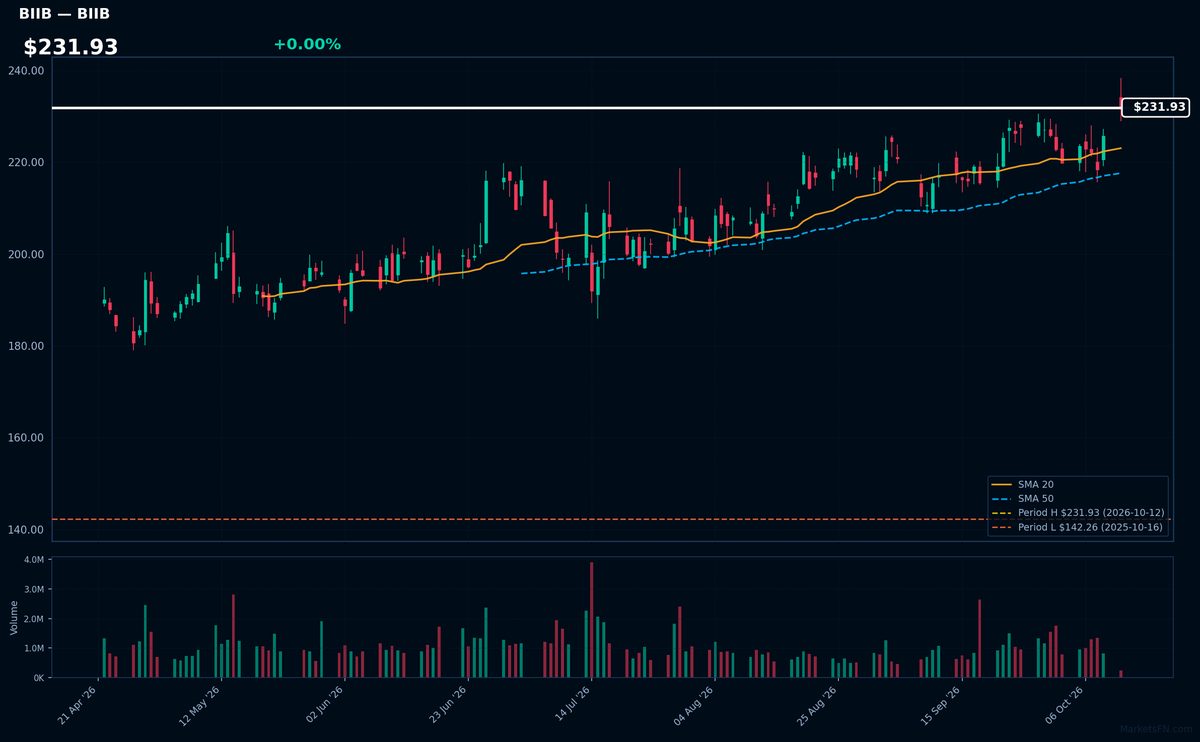
BIIB | Biogen Inc | Healthcare | Price Last: $231.93 | % Realized: +60.29% | RSI: 62.8 | % above MA200: +17.9% | Trend: Above MA20, MA50, MA200
Biogen specializes in neuroscience therapies, including multiple sclerosis and Alzheimer's treatments. Investors should monitor its pipeline of neurodegenerative disease drugs, particularly Alzheimer's drug Leqembi's commercialization, given the massive unmet need in this market.
Biogen shows strong bullish momentum with price > MA20 > MA50 > MA200 and RSI(14) at 62.8. The stock sits at its 52-week high after a 60.3% yearly gain, suggesting sustained uptrend potential but nearing overbought territory.
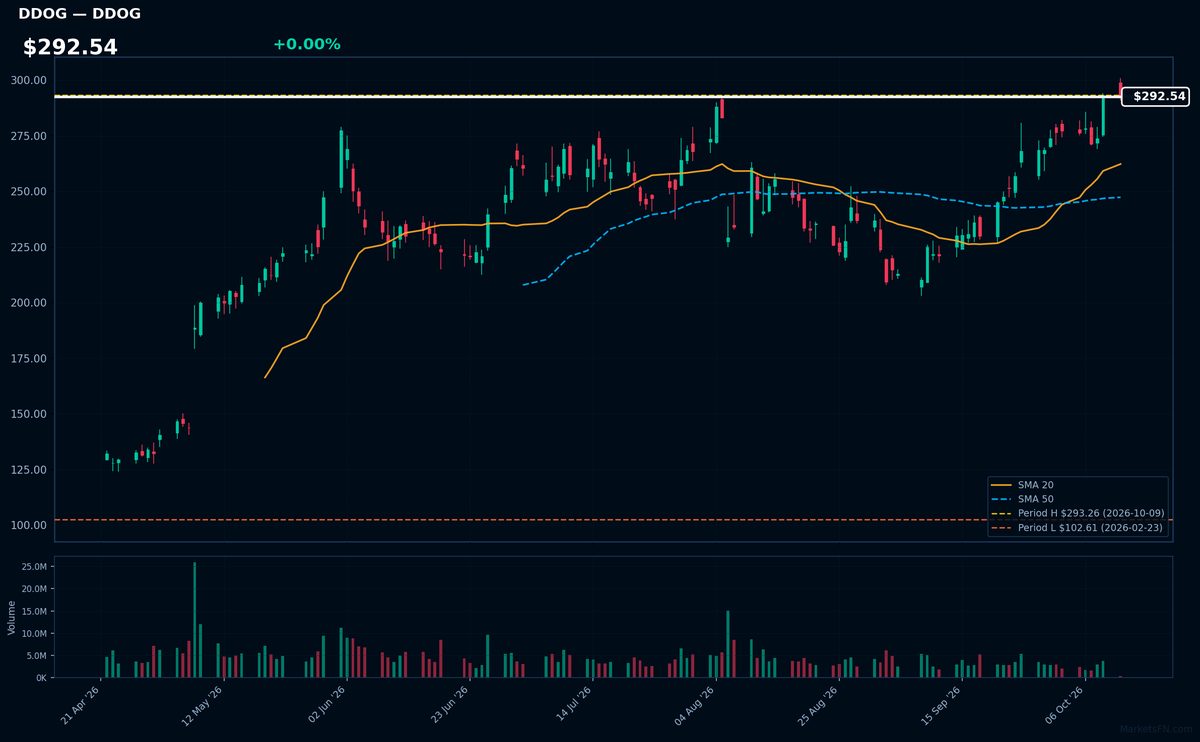
DDOG | Datadog Inc | Technology | Price Last: $292.54 | % Realized: +78.16% | RSI: 72.6 | % above MA200: +54.7% | Trend: Above MA20, MA50, MA200
Datadog provides cloud-based monitoring and analytics for developers and IT teams, helping companies optimize digital infrastructure. Investors care because its platform is mission-critical for cloud-native enterprises, driving recurring revenue growth as cloud adoption accelerates globally.
Technically bullish with RSI(14) at 72.6 (approaching overbought) and sustained uptrend (price > MA20 > MA50 > MA200). The stock tests resistance just 0.2% below its 52-week high after a 78.2% annual return, suggesting strong momentum but potential near-term consolidation risk.
📉 Nearest to 52-Week Low
Sectors represented: Communication Services (3), Industrials (1), Healthcare (1)
| Ticker | Company | Sector | Price Last | % Realized | 52-Week Low Date | RSI | % above MA200 | Trend |
|---|---|---|---|---|---|---|---|---|
| CMCSA | Comcast Corp | Communication Services | $20.60 | -25.24% | 2026-10-12 | 24.2 | -22.2% | Below MA20, MA50, MA200 |
| CHTR | Charter Communications Inc | Communication Services | $102.11 | -60.53% | 2026-10-12 | 27.0 | -40.6% | Below MA20, MA50, MA200 |
| CPRT | Copart, Inc | Industrials | $26.66 | -39.52% | 2026-10-07 | 34.4 | -19.5% | Below MA20, MA50, MA200 |
| TTD | Trade Desk Inc | Communication Services | $11.95 | -76.68% | 2026-10-06 | 33.8 | -45.3% | Below MA20, MA50, MA200 |
| AZN | Astrazeneca plc ADR | Healthcare | $158.00 | -6.52% | 2026-08-04 | 41.9 | -12.9% | Below MA20, MA50, MA200 |
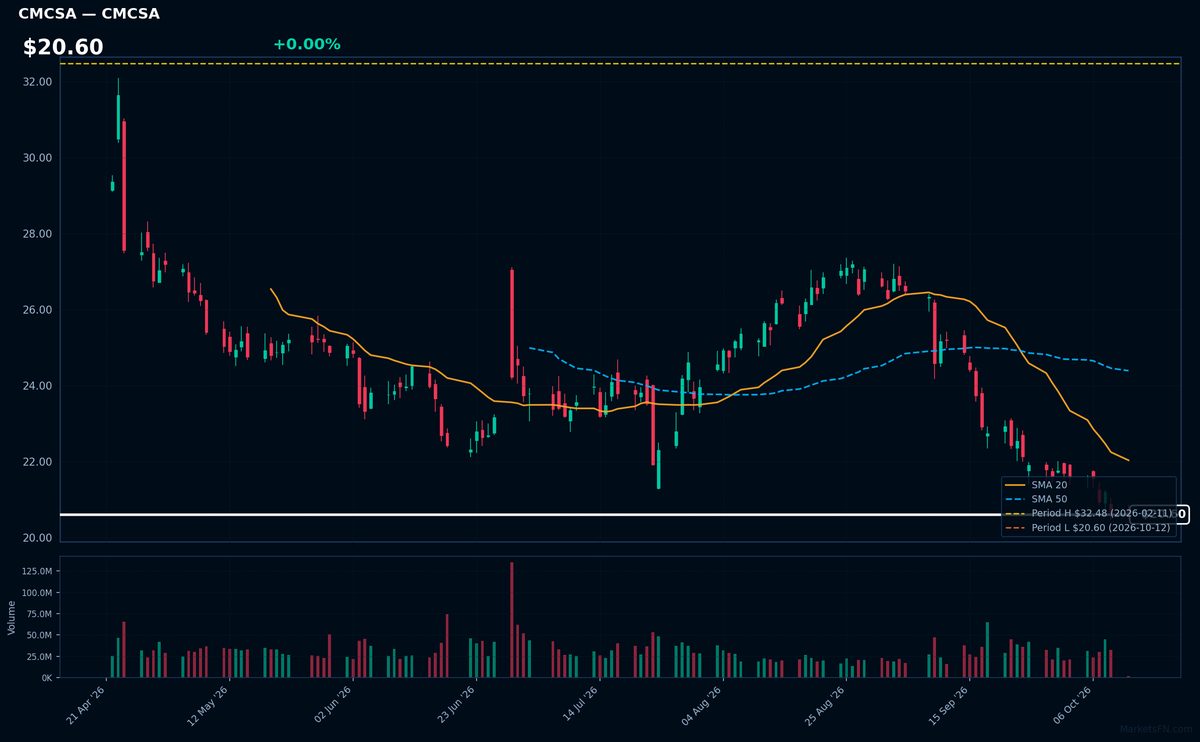
CMCSA | Comcast Corp | Communication Services | Price Last: $20.60 | % Realized: -25.24% | RSI: 24.2 | % above MA200: -22.2% | Trend: Below MA20, MA50, MA200
Comcast Corp operates as a media and technology conglomerate, providing cable/internet services (Xfinity), broadcasting (NBCUniversal), and theme parks. Investors watch its cash-generating broadband monopoly and streaming transition, though cord-cutting pressures traditional TV revenues.
Technically dire: RSI(14) at 24.2 shows oversold conditions amid bearish MA alignment (price < MA20 < MA50 < MA200). Stock tests 52-week lows after -25.2% plunge — clear capitulation warning.
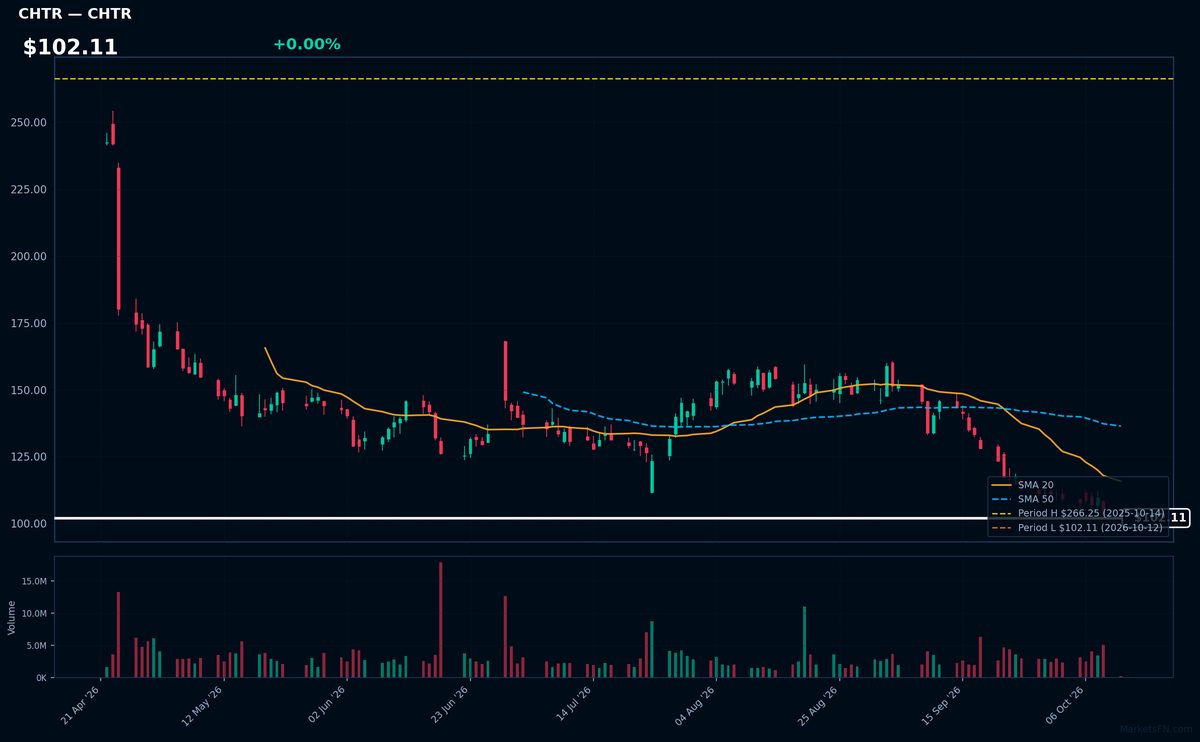
CHTR | Charter Communications Inc | Communication Services | Price Last: $102.11 | % Realized: -60.53% | RSI: 27.0 | % above MA200: -40.6% | Trend: Below MA20, MA50, MA200
Charter Communications provides broadband internet, cable TV, and voice services to 32 million customers under the Spectrum brand. Investors watch CHTR as a key player in US connectivity infrastructure, though its heavy debt load ($97B) makes it sensitive to interest rates and cord-cutting trends.
CHTR shows extreme technical weakness: RSI(14) at 27.0 (oversold) with bearish MA alignment (price < MA20 < MA50 < MA200). Trading just 0.0% above 52-week lows after a -60.5% plunge, this signals severe downtrend momentum, not fundamental strength. Critical support test underway.
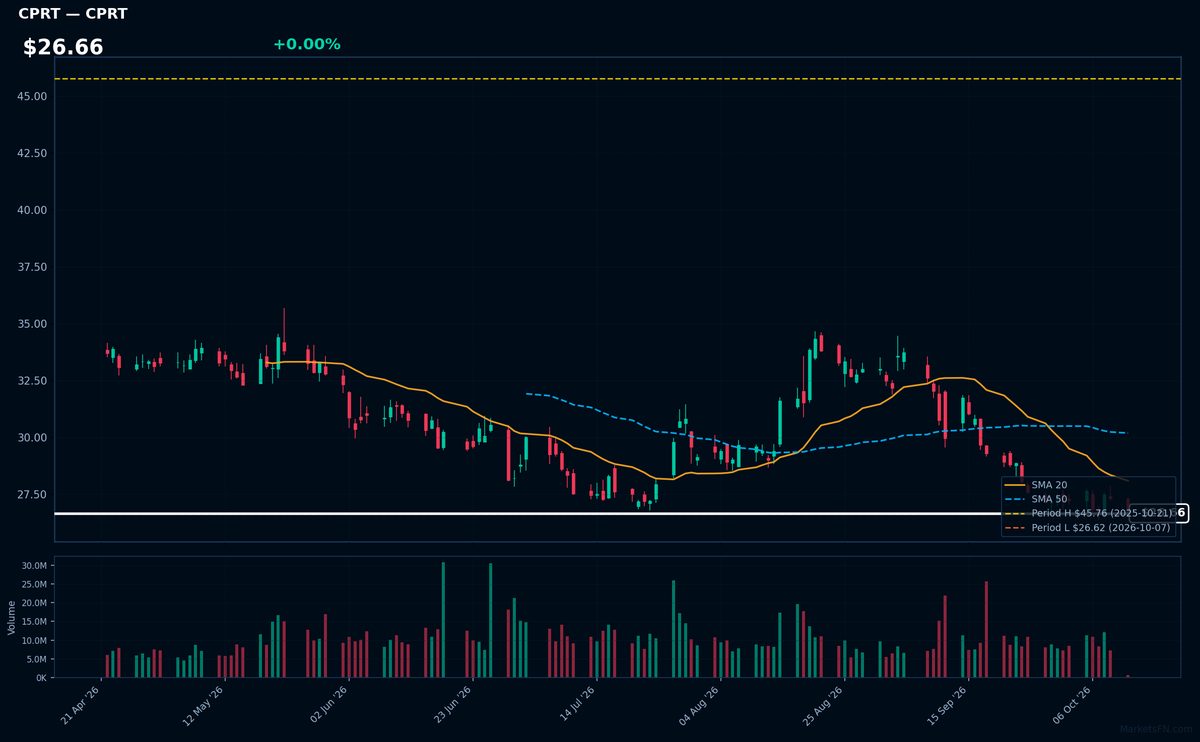
CPRT | Copart, Inc | Industrials | Price Last: $26.66 | % Realized: -39.52% | RSI: 34.4 | % above MA200: -19.5% | Trend: Below MA20, MA50, MA200
Copart operates an online vehicle auction platform, specializing in salvage and used cars for insurers, dealers, and individuals. Investors should care because its asset-light model dominates the $10B+ North American salvage market with high margins and recurring insurer relationships.
Technically concerning: RSI(14) at 34.4 shows oversold conditions amid a sustained downtrend (price < MA20 < MA50 < MA200). Trading just 0.1% above 52-week lows after -39.5% annual decline warns of continued weakness unless fundamentals reverse the bearish MA alignment.
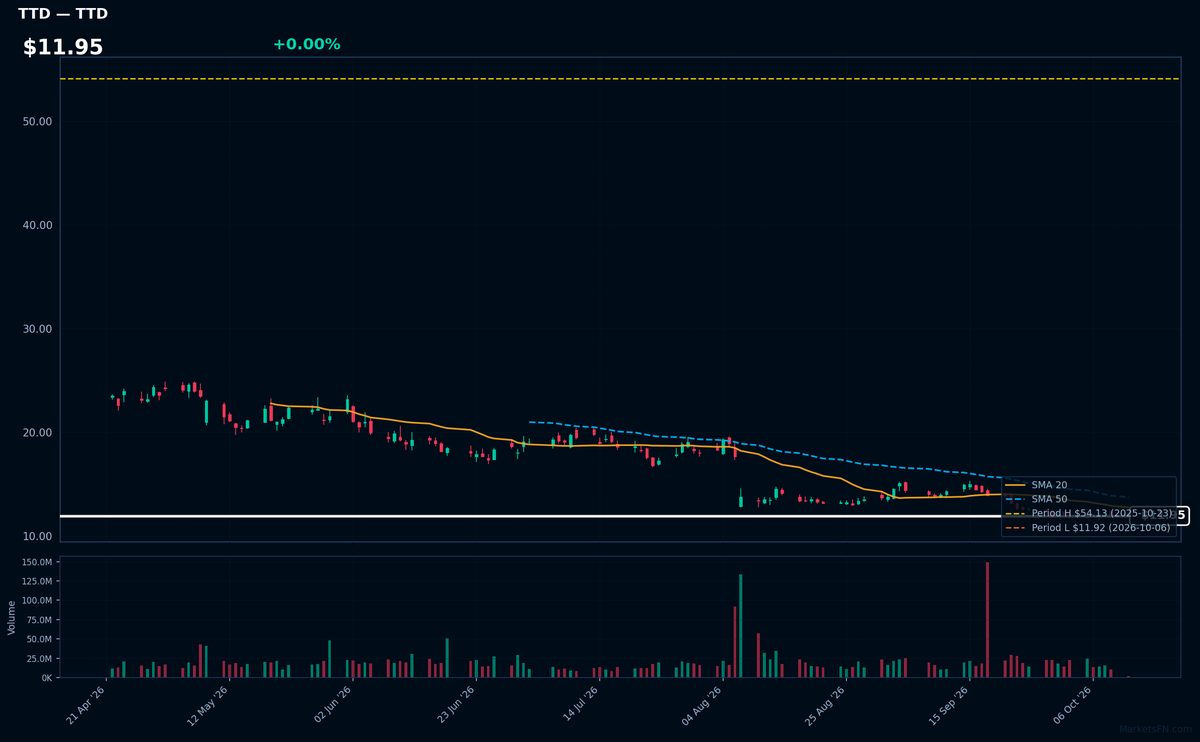
TTD | Trade Desk Inc | Communication Services | Price Last: $11.95 | % Realized: -76.68% | RSI: 33.8 | % above MA200: -45.3% | Trend: Below MA20, MA50, MA200
Trade Desk Inc operates a digital ad buying platform that automates programmatic advertising for agencies/brands. Investors care because its cloud-based technology disrupts traditional media buying with data-driven ad targeting and real-time bidding efficiency.
TTD shows extreme technical weakness: RSI(14) at 33.8 signals near-oversold, with bearish MA alignment (price < MA20 < MA50 < MA200). The stock tests critical support, down 76.7% over 52-weeks and just 0.3% above its 52-week low.
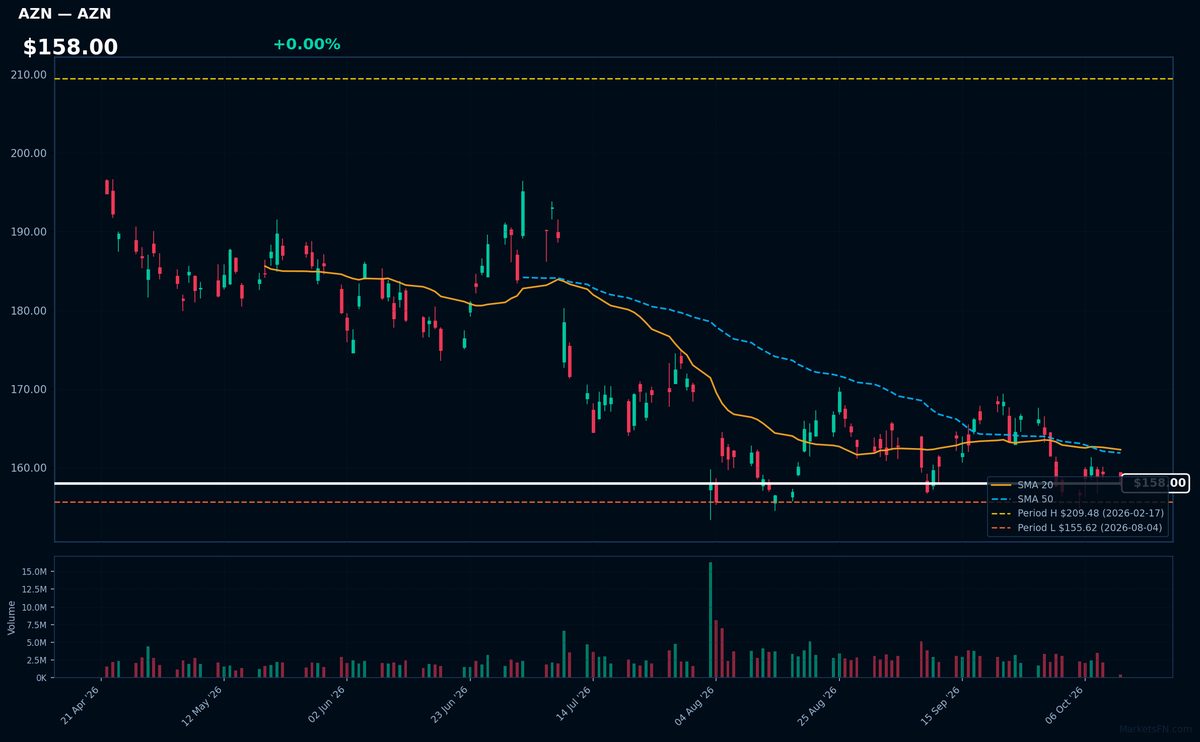
AZN | Astrazeneca plc ADR | Healthcare | Price Last: $158.00 | % Realized: -6.52% | RSI: 41.9 | % above MA200: -12.9% | Trend: Below MA20, MA50, MA200
AstraZeneca plc ADR (AZN) is a global biopharmaceutical company focused on oncology, cardiovascular, and respiratory therapies. Investors care because its innovative drug pipeline and COVID-19 vaccine position it for long-term growth in essential healthcare markets.
AstraZeneca's technicals show weakness: RSI(14) at 41.9 (neutral), trading below MA20/MA50/MA200, and just 1.5% above 52-week lows. The -6.5% annual return signals caution amid mixed momentum signals.
Market Commentary
The concentration of Nasdaq 100 technology stocks at 52-week highs (AAPL, FTNT, TEAM, DDOG) alongside defensive names like BIIB suggests persistent investor preference for growth and quality amid macroeconomic uncertainty. Conversely, communication services (CMCSA, CHTR) and ad-tech (TTD) languishing near 52-week lows reflect cyclical pressures and streaming/linear TV disruption. This bifurcation underscores the market's selective risk appetite, favoring companies with resilient earnings and secular tailwinds.
Tech leaders benefit from AI infrastructure spending (cloud, cybersecurity like FTNT, DevOps like TEAM/DDOG) and stable consumer demand (AAPL), while macro-sensitive sectors face higher rates and weak ad spend (TTD, CHTR). Biotech (BIIB) joins the highs list on drug pipeline momentum, contrasting with pharma peer AZN's lows due to patent cliffs. The divergence highlights how sector-specific drivers outweigh broad market trends.
Key levels to monitor include AAPL's $197.79 (current 52W high) and TTD's $60.32 (52W low). For highs, earnings durability and Fed policy are critical; any growth scare could trigger profit-taking. For lows, cyclical recovery signs (ad spend rebound, cable sub stabilization) or M&A speculation (CHTR/CMCSA) may catalyze reversals. Breakdown risks loom if macro deteriorates further, particularly for high-multiple software names.
Methodology: All 101 Nasdaq 100 constituents screened. 52-week high = highest daily close over the past 252 trading days (approx. 1 year). 52-week low = lowest daily close over the same period. Distance = (current price / extreme − 1) × 100. Technical indicators computed on up to 1 year of daily OHLCV data.
Disclaimer: For informational purposes only. Not investment advice. Past performance is not indicative of future results.