S&P 500 52-Week Highs & Lows Radar: Thermo Fisher Scientific (TMO), Netflix (NFLX) and more
MarketsFN Team

Screening all 503 S&P 500 constituents for stocks nearest to their 52-week high and their 52-week low. Data as of October 28, 2026. % Realized = 52-week total return.
Legend: RSI > 70 = overbought · RSI < 30 = oversold · Green % Realized = positive 52W return · Red = negative.
📈 Nearest to 52-Week High
Sectors represented: Healthcare (3), Industrials (2)
| Ticker | Company | Sector | Price Last | % Realized | 52-Week High Date | RSI | % above MA200 | Trend |
|---|---|---|---|---|---|---|---|---|
| TMO | Thermo Fisher Scientific Inc | Healthcare | $709.93 | +27.31% | 2026-10-28 | 65.4 | +29.0% | Above MA20, MA50, MA200 |
| AMGN | AMGEN Inc | Healthcare | $453.68 | +55.32% | 2026-10-28 | 66.9 | +21.5% | Above MA20, MA50, MA200 |
| GILD | Gilead Sciences, Inc | Healthcare | $160.62 | +36.26% | 2026-10-28 | 64.3 | +15.2% | Above MA20, MA50, MA200 |
| EMR | Emerson Electric Co | Industrials | $167.21 | +24.30% | 2026-10-28 | 65.5 | +13.9% | Above MA20, MA50, MA200 |
| URI | United Rentals, Inc | Industrials | $1170.50 | +33.67% | 2026-10-28 | 70.1 | +20.9% | Above MA20, MA50, MA200 |
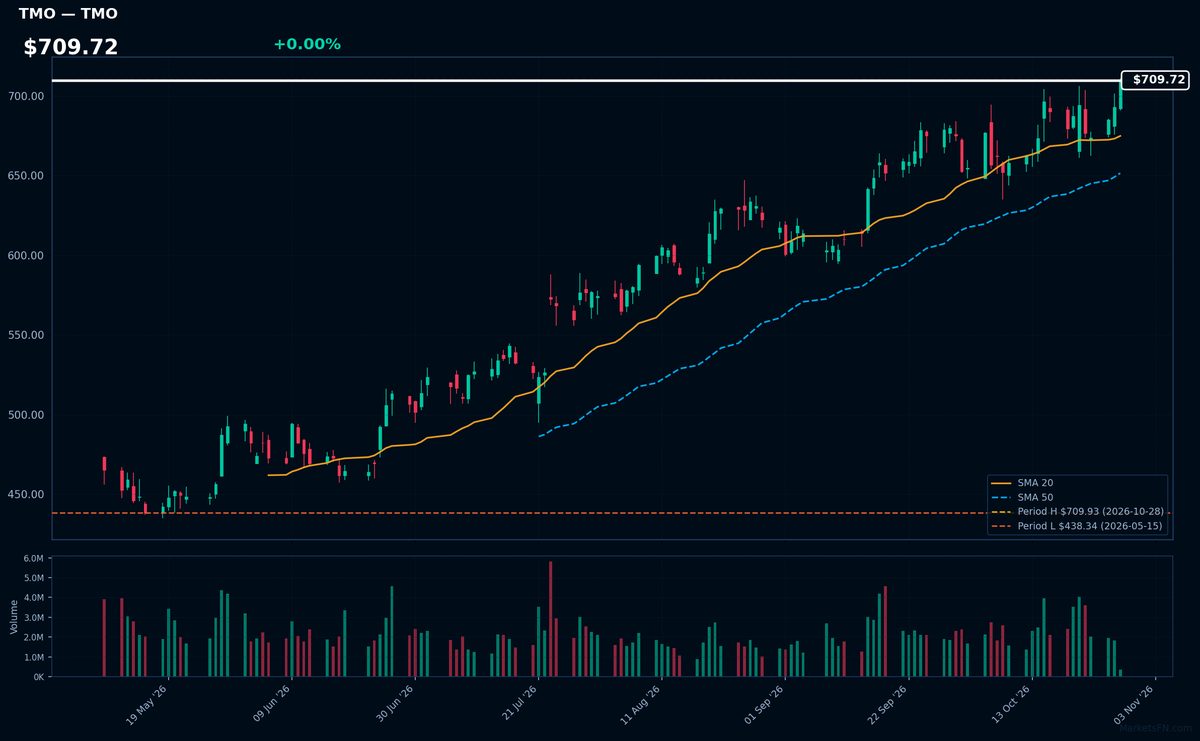
TMO | Thermo Fisher Scientific Inc | Healthcare | Price Last: $709.93 | % Realized: +27.31% | RSI: 65.4 | % above MA200: +29.0% | Trend: Above MA20, MA50, MA200
Thermo Fisher Scientific provides analytical instruments, lab equipment, software, and consumables for life sciences, diagnostics, and applied markets. Investors should care because its essential tools enable biopharma R&D and clinical testing—high-growth sectors with recurring revenue streams.
TMO shows bullish momentum (RSI 65.4, price > MA20 > MA50 > MA200) and sits at its 52-week high (+27.3% YoY). The alignment suggests sustained uptrend strength, though RSI nears overbought territory.
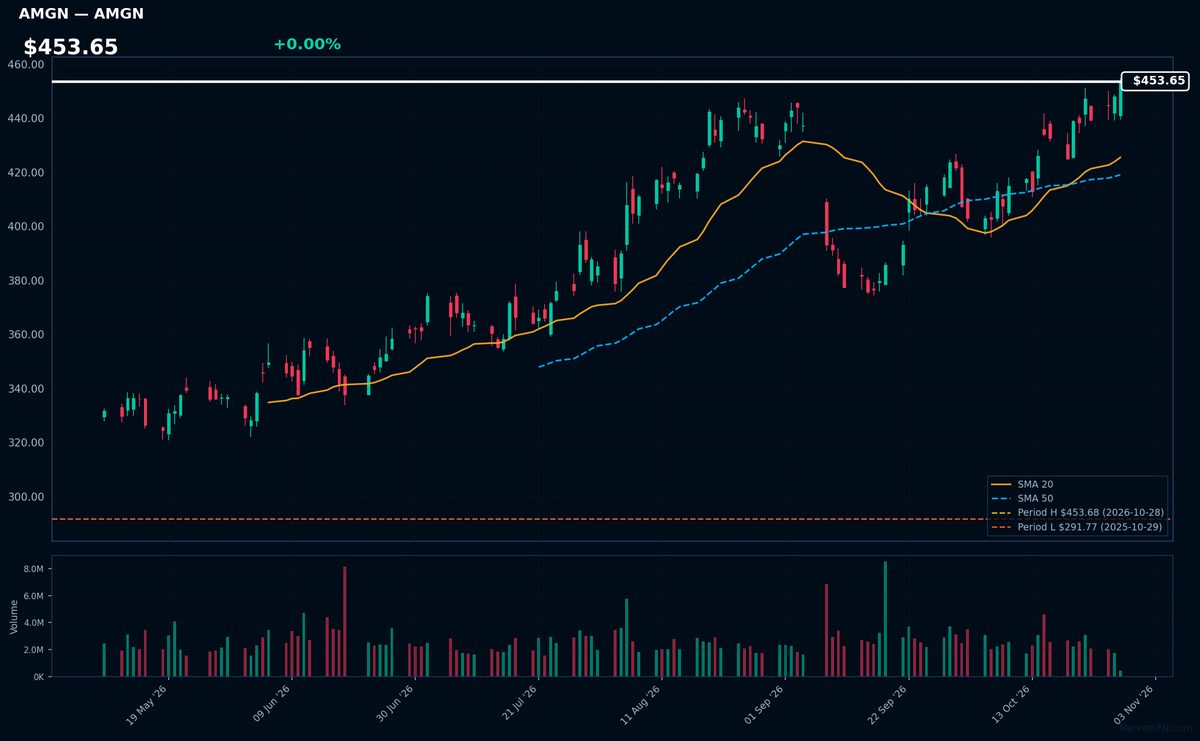
AMGN | AMGEN Inc | Healthcare | Price Last: $453.68 | % Realized: +55.32% | RSI: 66.9 | % above MA200: +21.5% | Trend: Above MA20, MA50, MA200
Amgen develops biologic medicines for serious illnesses, including Enbrel for arthritis and Prolia for osteoporosis. Investors care because its targeted therapies command premium pricing and face less generic competition than traditional drugs, supporting durable cash flows.
Technically bullish with RSI(14) at 66.9 and price > MA20 > MA50 > MA200. At 52-week highs after 55.3% annual return, momentum suggests continuation but RSI nears overbought.
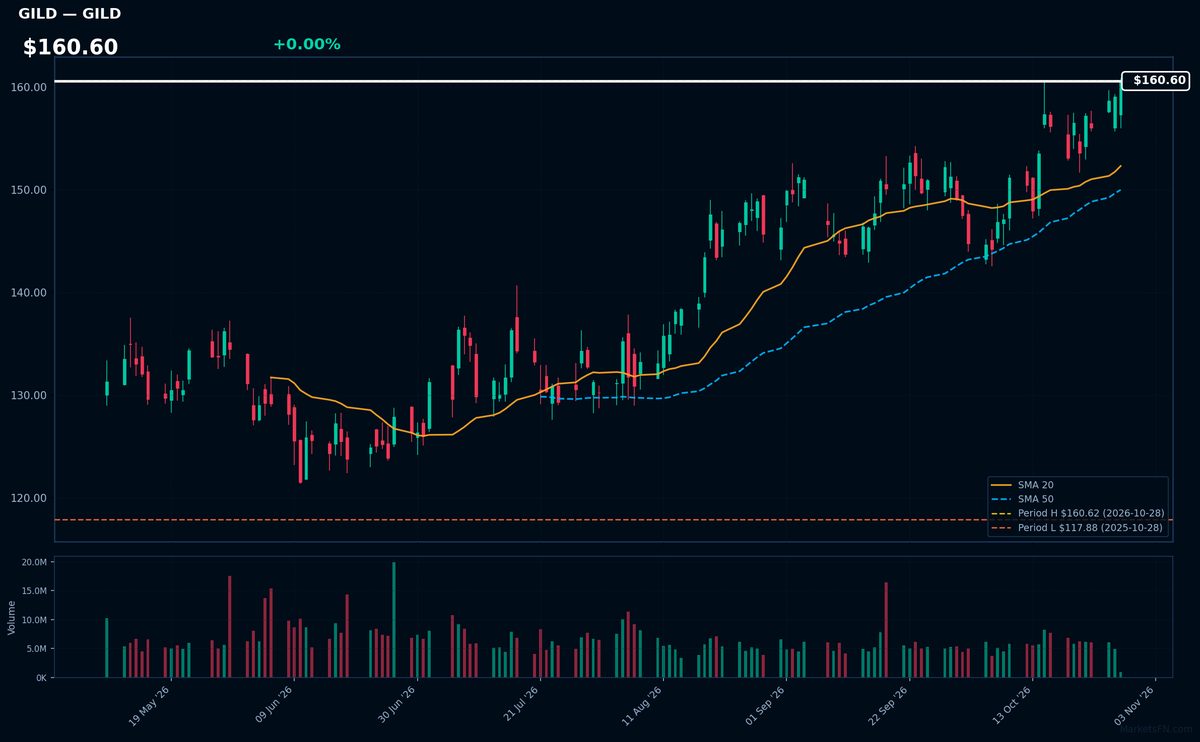
GILD | Gilead Sciences, Inc | Healthcare | Price Last: $160.62 | % Realized: +36.26% | RSI: 64.3 | % above MA200: +15.2% | Trend: Above MA20, MA50, MA200
Gilead Sciences is a biopharmaceutical company focused on antiviral drugs, including HIV and hepatitis C treatments, and oncology therapies. Investors care due to its strong pipeline and revenue from blockbuster drugs like Biktarvy, positioning it as a key player in infectious disease and cancer markets.
GILD shows bullish momentum with RSI(14) at 64.3 and a sustained uptrend (price > MA20 > MA50 > MA200). The stock is 0.0% below its 52-week high, suggesting potential breakout, but RSI nearing overbought levels warrants caution despite the 36.3% 52-week return.
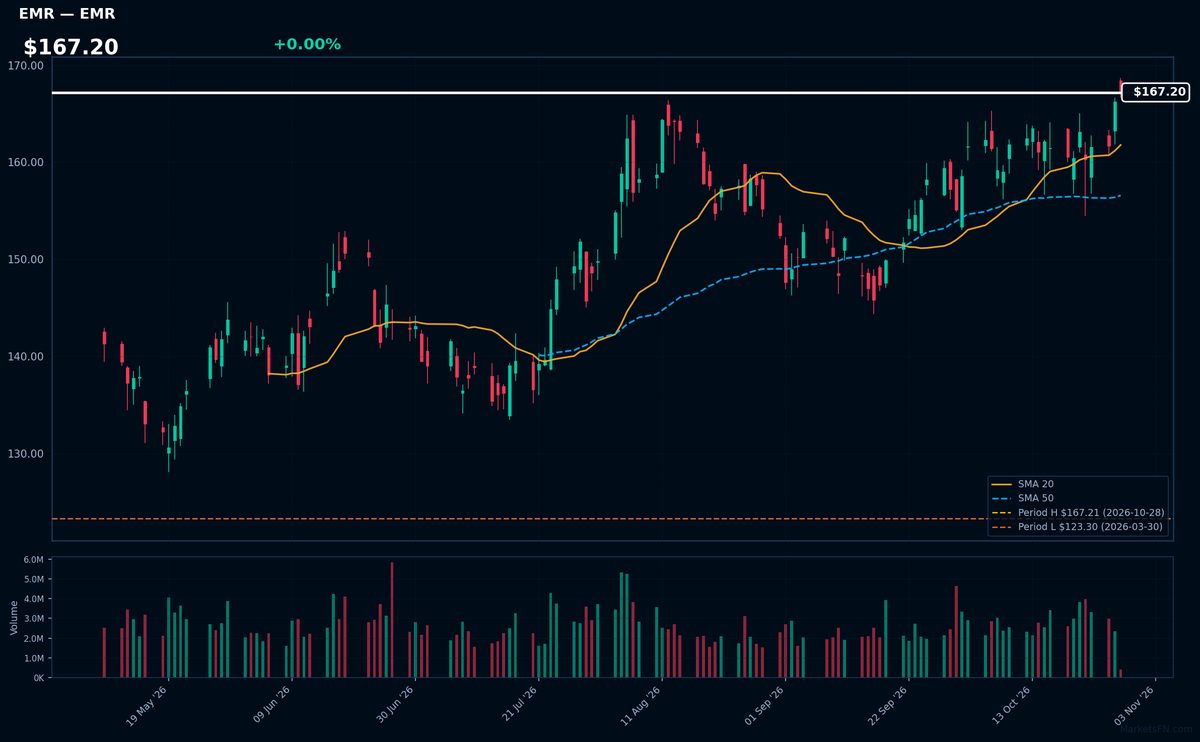
EMR | Emerson Electric Co | Industrials | Price Last: $167.21 | % Realized: +24.30% | RSI: 65.5 | % above MA200: +13.9% | Trend: Above MA20, MA50, MA200
Emerson Electric Co (EMR) specializes in automation solutions and industrial technologies, serving sectors like energy, healthcare, and manufacturing. Investors should note its critical role in infrastructure modernization and efficiency-driven industries, positioning it as a key player in global industrial digitization trends.
EMR shows strong bullish momentum with a 65.5 RSI(14) and sustained uptrend (price > MA20 > MA50 > MA200). At 0.0% below its 52-week high and a 24.3% annual return, the technical setup suggests continuation potential, though RSI nears overbought territory.
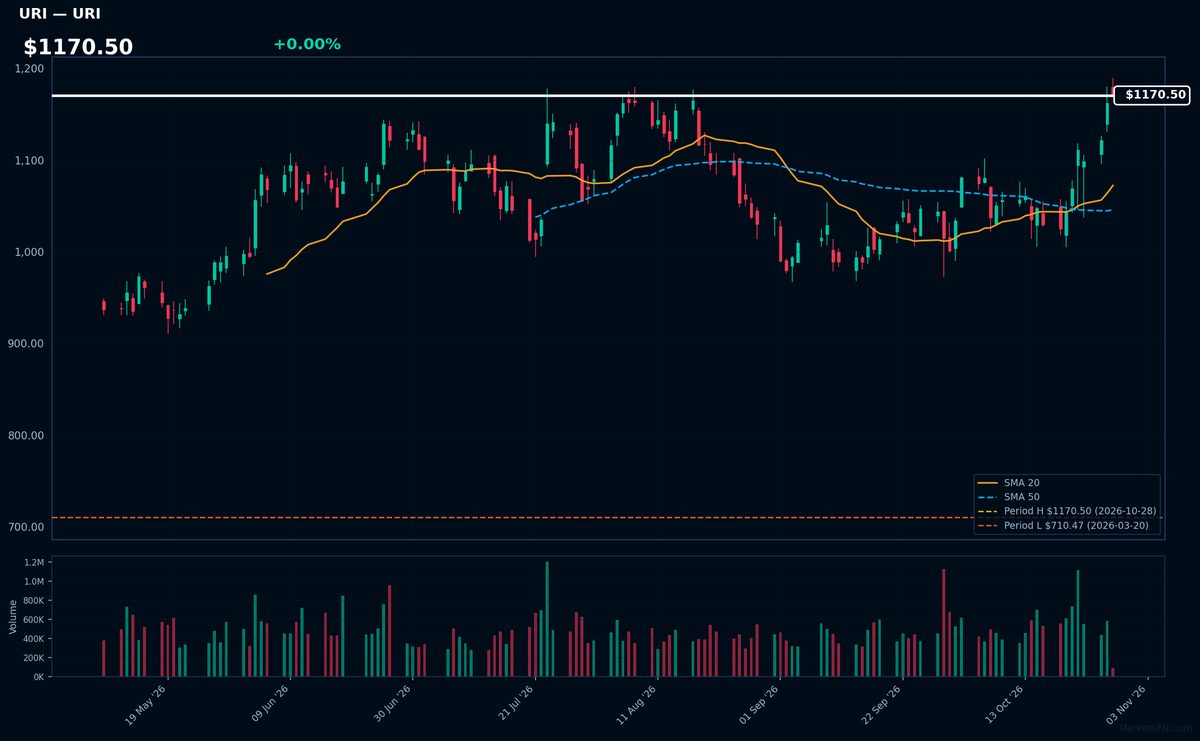
URI | United Rentals, Inc | Industrials | Price Last: $1170.50 | % Realized: +33.67% | RSI: 70.1 | % above MA200: +20.9% | Trend: Above MA20, MA50, MA200
United Rentals (URI) dominates North American equipment rentals, serving construction/industrial sectors with a $1.4M+ fleet. Investors care because infrastructure spending cycles drive recurring revenue, and their scale creates pricing power in a fragmented market.
Technically bullish (RSI 70.1, price > MA20 > MA50 > MA200) but extended - 33.7% YTD return at 52-week highs suggests momentum may be peaking. Watch for breakout confirmation.
📉 Nearest to 52-Week Low
Sectors represented: Communication Services (2), Technology (1), Consumer Cyclical (1), Industrials (1)
| Ticker | Company | Sector | Price Last | % Realized | 52-Week Low Date | RSI | % above MA200 | Trend |
|---|---|---|---|---|---|---|---|---|
| NFLX | Netflix Inc | Communication Services | $61.76 | -43.98% | 2026-10-28 | 29.9 | -24.6% | Below MA20, MA50, MA200 |
| TMUS | T-Mobile US Inc | Communication Services | $145.49 | -33.87% | 2026-10-28 | 34.8 | -22.3% | Below MA20, MA50, MA200 |
| UBER | Uber Technologies Inc | Technology | $64.78 | -32.12% | 2026-10-28 | 33.9 | -11.9% | Below MA20, MA50, MA200 |
| BKNG | Booking Holdings Inc | Consumer Cyclical | $147.65 | -27.91% | 2026-10-28 | 30.4 | -16.8% | Below MA20, MA50, MA200 |
| BA | Boeing Co | Industrials | $166.30 | -25.54% | 2026-10-28 | 24.3 | -23.6% | Below MA20, MA50, MA200 |
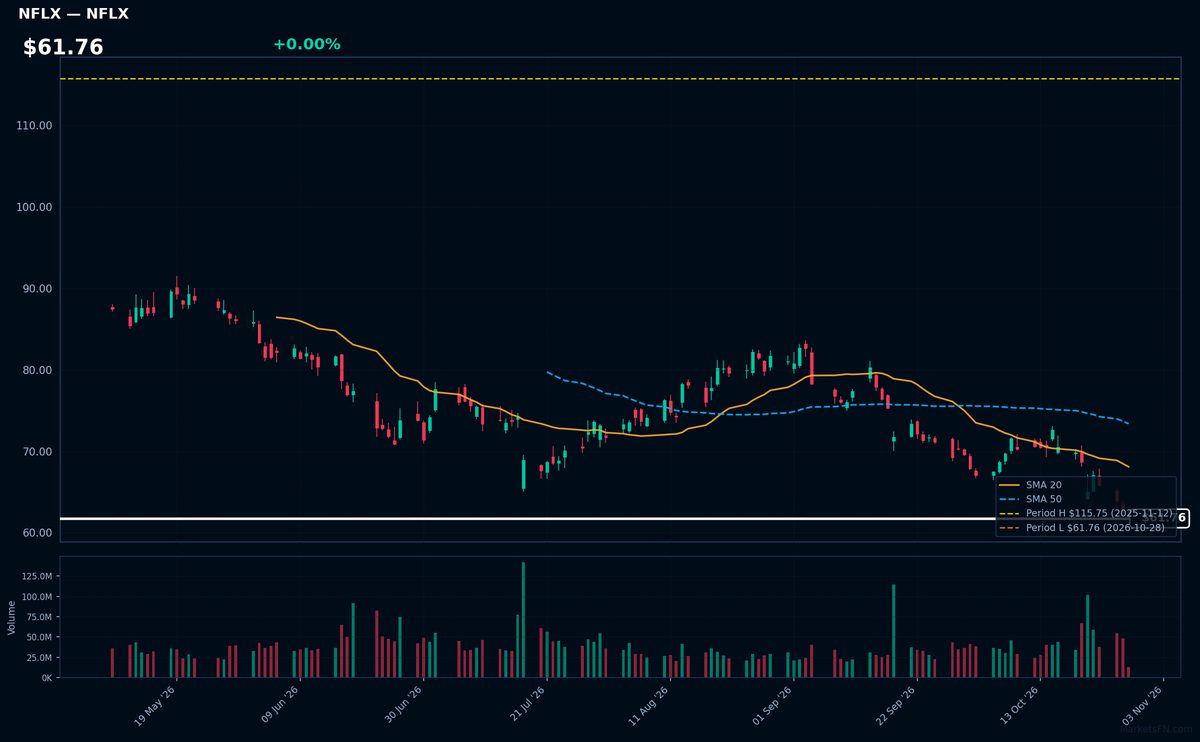
NFLX | Netflix Inc | Communication Services | Price Last: $61.76 | % Realized: -43.98% | RSI: 29.9 | % above MA200: -24.6% | Trend: Below MA20, MA50, MA200
Netflix Inc operates the world's leading streaming platform, producing original content while licensing third-party shows. Investors care due to its global subscriber growth potential and pricing power in the entertainment industry.
Severe technical warning: RSI(14) at 29.9 (nearly oversold) with bearish MA alignment (price < MA20 < MA50 < MA200). Stock tests 52-week low after -44.0% decline.
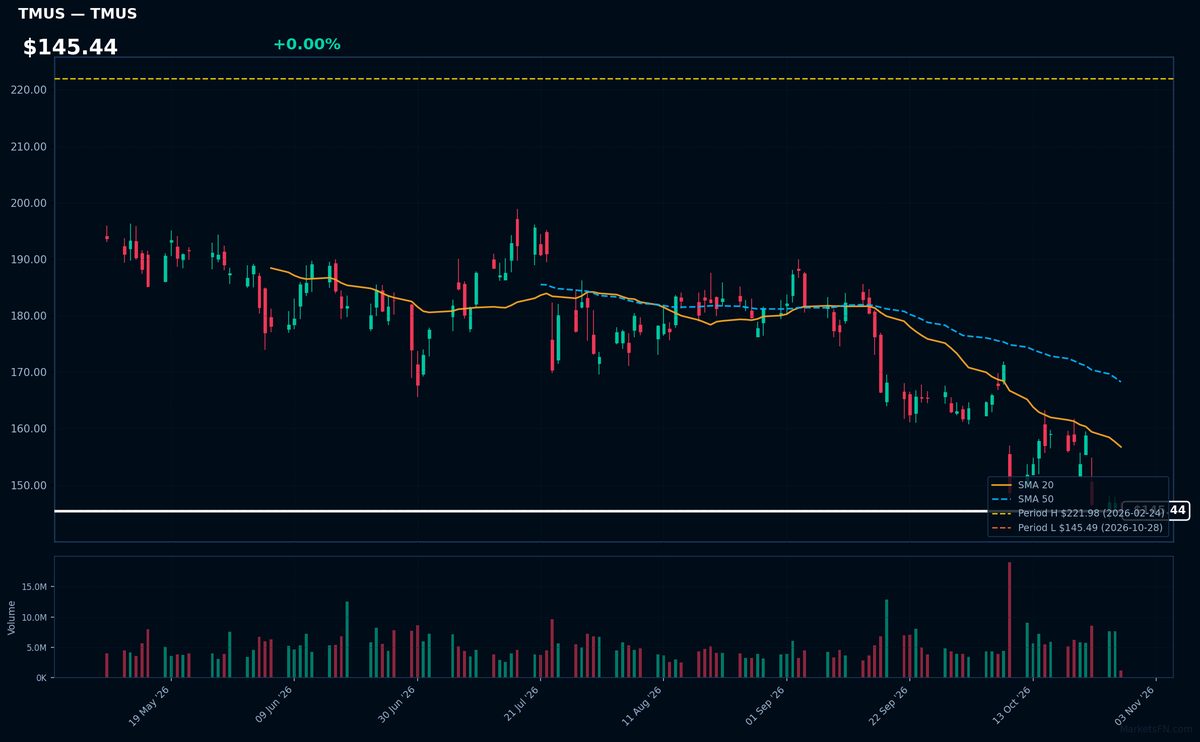
TMUS | T-Mobile US Inc | Communication Services | Price Last: $145.49 | % Realized: -33.87% | RSI: 34.8 | % above MA200: -22.3% | Trend: Below MA20, MA50, MA200
T-Mobile US Inc operates as a major wireless carrier in the U.S., known for disruptive pricing and aggressive 5G network expansion. Investors care due to its growth potential in broadband and sustained subscriber additions, challenging larger rivals Verizon and AT&T.
TMUS shows severe technical weakness: RSI(14) at 34.8 (near oversold), with bearish MA alignment (price < MA20 < MA50 < MA200) and just 0.0% above 52-week lows. The -33.9% annual return signals sustained downtrend—a clear warning, not momentum.
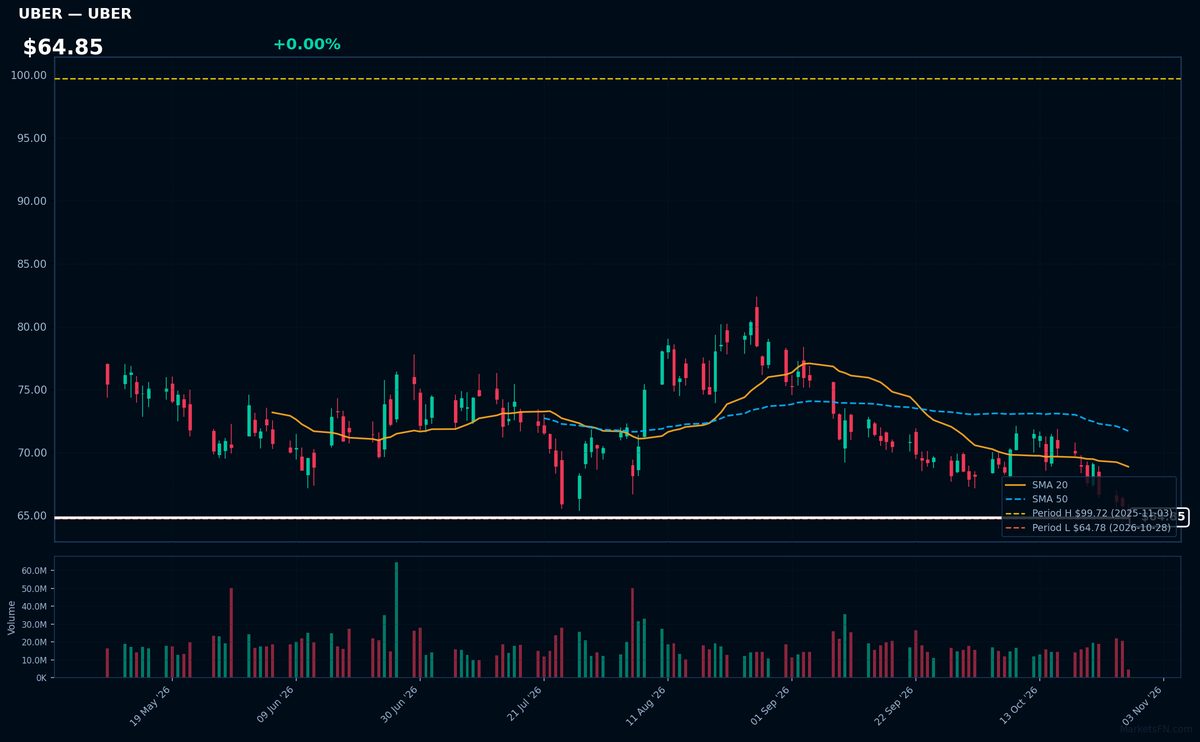
UBER | Uber Technologies Inc | Technology | Price Last: $64.78 | % Realized: -32.12% | RSI: 33.9 | % above MA200: -11.9% | Trend: Below MA20, MA50, MA200
Uber operates a global mobility platform connecting riders/drivers and a delivery network for restaurants/groceries. Investors care due to its dominant market share in ride-hailing, growing delivery segment, and potential to leverage its massive user base for profitability as it scales.
Technically concerning: RSI(14) at 33.9 shows oversold conditions amid a sustained downtrend (price < MA20 < MA50 < MA200). Stock tests 52-week low support after -32.1% annual decline — warning sign unless fundamentals improve.
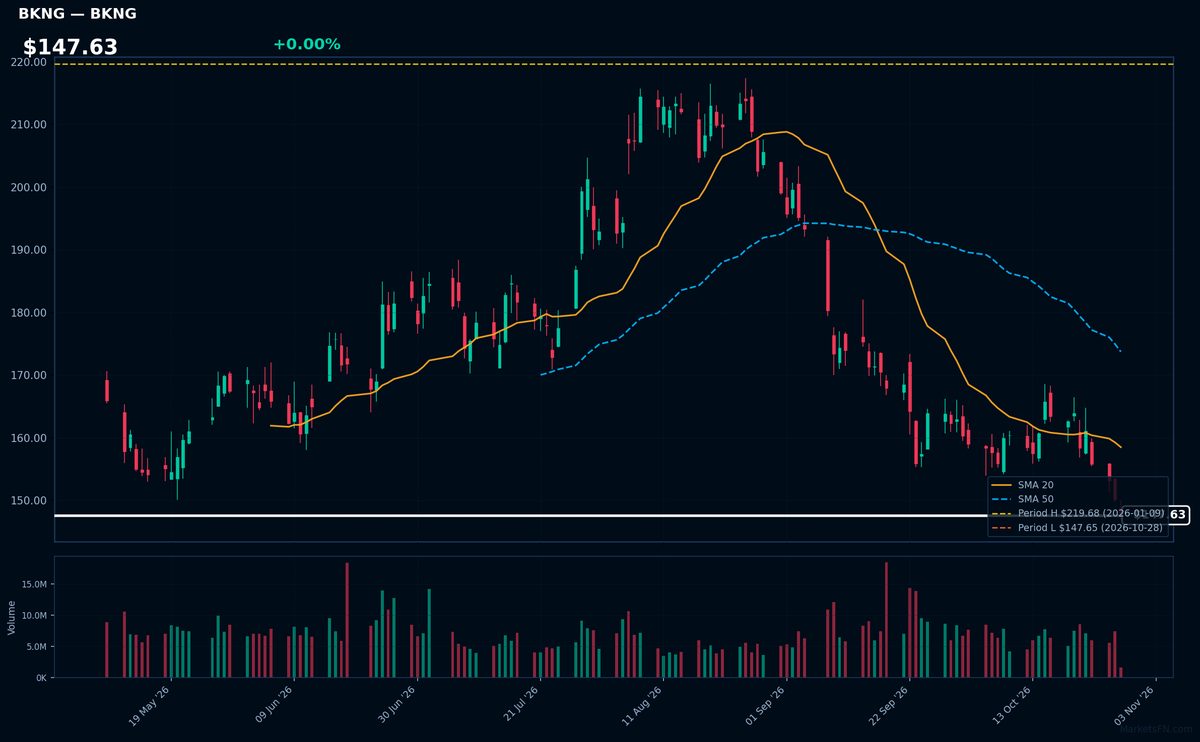
BKNG | Booking Holdings Inc | Consumer Cyclical | Price Last: $147.65 | % Realized: -27.91% | RSI: 30.4 | % above MA200: -16.8% | Trend: Below MA20, MA50, MA200
Booking Holdings operates leading online travel platforms (Booking.com, Priceline, Kayak) connecting travelers with lodging/transportation. Investors care because its global scale and pricing power in travel services drive high-margin recurring revenue, though cyclical exposure remains.
Technically concerning: RSI(14) at 30.4 shows oversold conditions amid sustained downtrend (price < MA20 < MA50 < MA200). Stock tests 52-week low support after -27.9% annual decline, signaling bearish momentum.
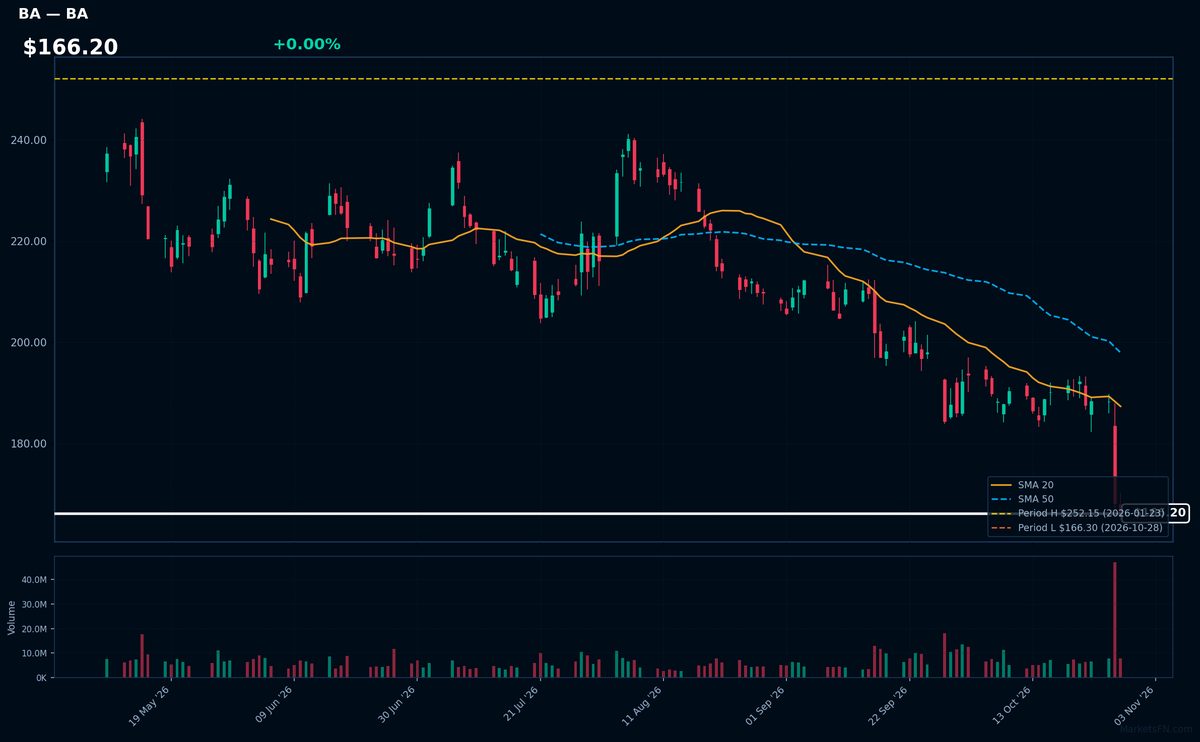
BA | Boeing Co | Industrials | Price Last: $166.30 | % Realized: -25.54% | RSI: 24.3 | % above MA200: -23.6% | Trend: Below MA20, MA50, MA200
Boeing Co designs and manufactures commercial jetliners, defense systems, and space technology. Investors watch BA as a proxy for global aerospace demand, airline industry health, and defense spending, with its 737 MAX program critical to cash flow recovery.
Technically distressed: RSI(14) at 24.3 shows oversold conditions amid bearish MA alignment (price < MA20 < MA50 < MA200). Trading at 52-week lows (-25.5% YoY) signals severe downside momentum, not fundamental strength.
Market Commentary
The clustering of S&P 500 stocks at 52-week extremes reflects divergent sector momentum amid macroeconomic crosscurrents. Thermo Fisher (TMO), Amgen (AMGN), and Gilead (GILD) – all healthcare/life sciences names – trade at highs alongside industrial plays Emerson Electric (EMR) and United Rentals (URI), signaling defensive rotation into stable cash flows and infrastructure exposure. Conversely, Netflix (NFLX), T-Mobile (TMUS), and Uber (UBER) languish near lows, highlighting pressure on consumer discretionary and capital-intensive growth stocks.
This bifurcation underscores a "risk-off" tilt favoring recession-resilient sectors over pandemic darlings, compounded by Fed tightening. Healthcare and industrials benefit from sticky demand and reshoring tailwinds, while streaming (NFLX), travel (BKNG), and aviation (BA) face demand normalization and cost inflation. Boeing’s persistent weakness at lows reflects operational and supply chain risks unique to aerospace.
Key levels to monitor include the 52-week highs of URI ($523.00) and EMR ($109.00) for confirmation of industrial strength, while NFLX ($162.00) and BKNG ($1,618.00) must hold their 52-week lows to avoid breakdowns. Catalysts include Q2 earnings guidance revisions, particularly for AMGN/TMO’s biotech margins and UBER’s ride-hailing profitability. Any Fed pivot could revive growth names, whereas prolonged inflation may extend the defensive trade.
Methodology: All 503 S&P 500 constituents screened. 52-week high = highest daily close over the past 252 trading days (approx. 1 year). 52-week low = lowest daily close over the same period. Distance = (current price / extreme − 1) × 100. Technical indicators computed on up to 1 year of daily OHLCV data.
Disclaimer: For informational purposes only. Not investment advice. Past performance is not indicative of future results.