S&P 500 2026 YTD Highs & Lows Radar: AMGEN (AMGN), Netflix (NFLX) and more
MarketsFN Team

Screening all 503 S&P 500 constituents for stocks nearest to their 2026 year-to-date high and their 2026 YTD low. Data as of October 28, 2026. % Realized = total return since Jan 1 2026.
Legend: RSI > 70 = overbought · RSI < 30 = oversold · Green % Realized = positive YTD return · Red = negative.
📈 Nearest to 2026 High
Sectors represented: Healthcare (3), Industrials (1), Technology (1)
| Ticker | Company | Sector | Price Last | % Realized | 2026 YTD High Date | RSI | % above MA200 | Trend |
|---|---|---|---|---|---|---|---|---|
| AMGN | AMGEN Inc | Healthcare | $447.95 | +36.72% | 2026-10-27 | 66.4 | +20.0% | Above MA20, MA50, MA200 |
| GILD | Gilead Sciences, Inc | Healthcare | $159.08 | +30.82% | 2026-10-27 | 63.9 | +14.1% | Above MA20, MA50, MA200 |
| EMR | Emerson Electric Co | Industrials | $166.27 | +22.42% | 2026-10-27 | 66.3 | +13.2% | Above MA20, MA50, MA200 |
| MTD | Mettler-Toledo International, Inc | Healthcare | $1685.32 | +19.41% | 2026-10-27 | 78.1 | +26.2% | Above MA20, MA50, MA200 |
| PTC | PTC Inc | Technology | $194.62 | +14.42% | 2026-10-27 | 77.5 | +32.6% | Above MA20, MA50, MA200 |
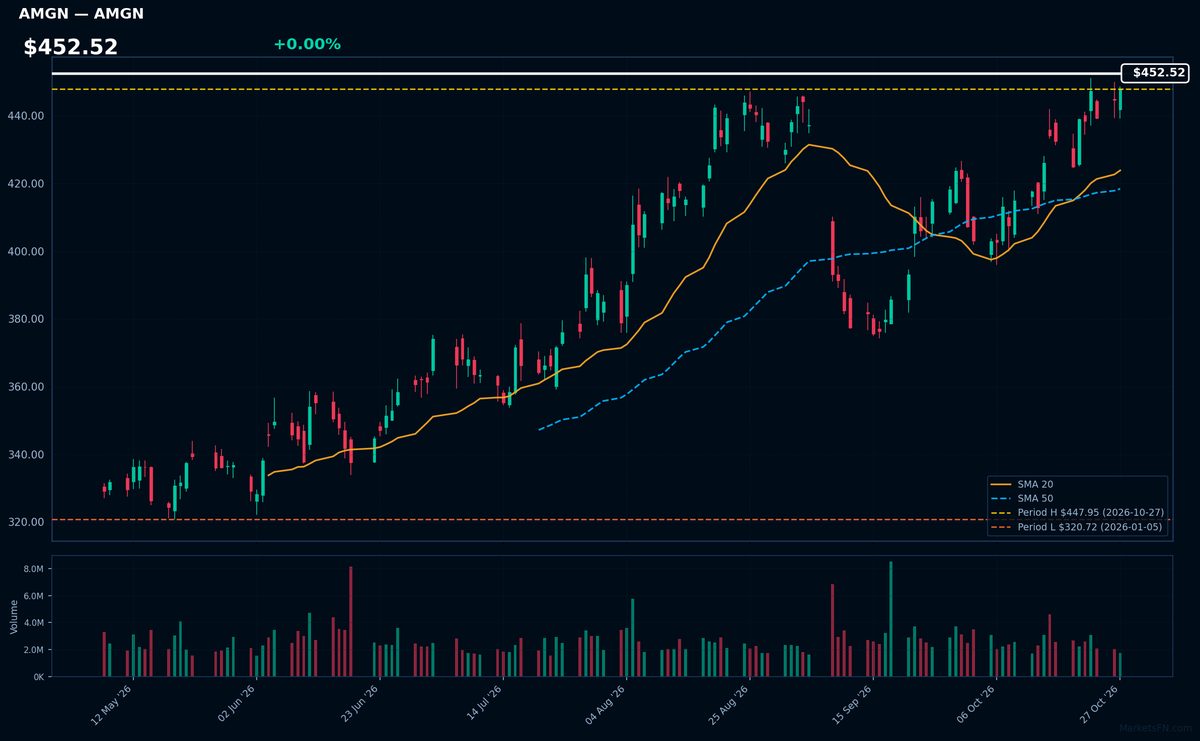
AMGN | AMGEN Inc | Healthcare | Price Last: $447.95 | % Realized: +36.72% | RSI: 66.4 | % above MA200: +20.0% | Trend: Above MA20, MA50, MA200
Amgen develops biologic medicines for serious illnesses, including cancer, cardiovascular disease, and osteoporosis. Investors care because its targeted therapies command premium pricing, with blockbusters like Enbrel and Otezla generating stable cash flows despite biosimilar competition.
AMGN shows strong bullish momentum with RSI(14) at 66.4 and price > MA20 > MA50 > MA200. The stock sits 0.0% below its YTD high after gaining 36.7% in 2026, suggesting breakout potential but nearing overbought territory.
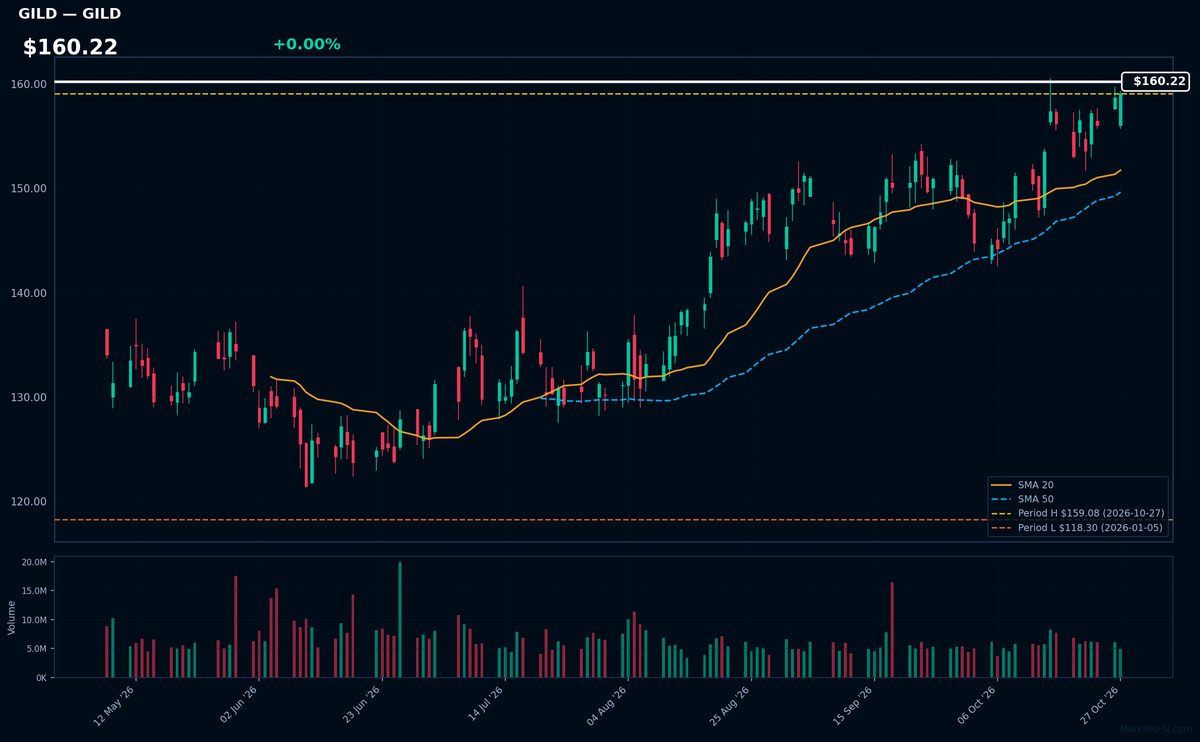
GILD | Gilead Sciences, Inc | Healthcare | Price Last: $159.08 | % Realized: +30.82% | RSI: 63.9 | % above MA200: +14.1% | Trend: Above MA20, MA50, MA200
Gilead Sciences is a biopharmaceutical leader in HIV, hepatitis C, and oncology treatments. Investors should monitor its antiviral drug pipeline and CAR-T cell therapy expansion, which drive revenue in specialty pharmaceuticals with high barriers to entry.
GILD shows bullish momentum with RSI(14) at 63.9 and price > MA20 > MA50 > MA200. The stock sits 0.0% below its YTD high after gaining 30.8% in 2026, suggesting sustained uptrend potential but nearing overbought territory.
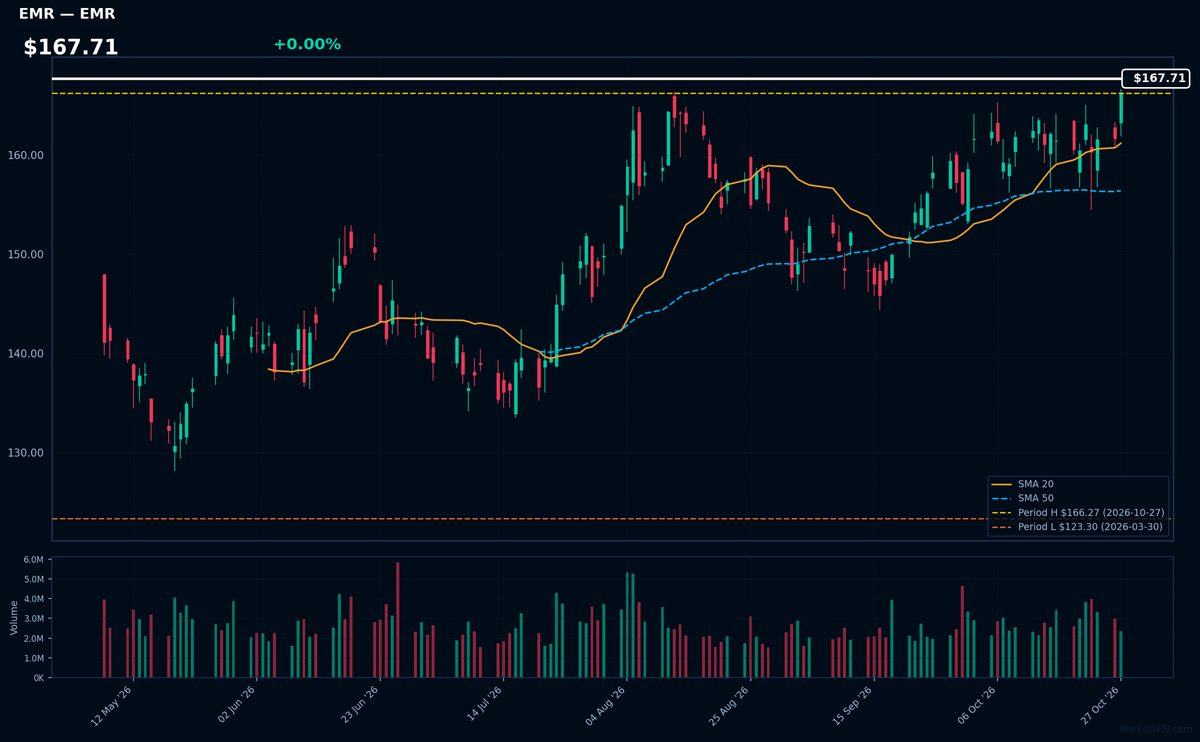
EMR | Emerson Electric Co | Industrials | Price Last: $166.27 | % Realized: +22.42% | RSI: 66.3 | % above MA200: +13.2% | Trend: Above MA20, MA50, MA200
Emerson Electric designs industrial automation systems and climate technologies for factories, data centers, and energy infrastructure. Investors care because its digital transformation solutions address critical efficiency needs in manufacturing and energy transition sectors.
Technically bullish with RSI(14) at 66.3 (approaching overbought) and sustained uptrend (price > MA20 > MA50 > MA200). Stock tests 2026 highs after 22.4% YTD rally — watch for breakout confirmation.
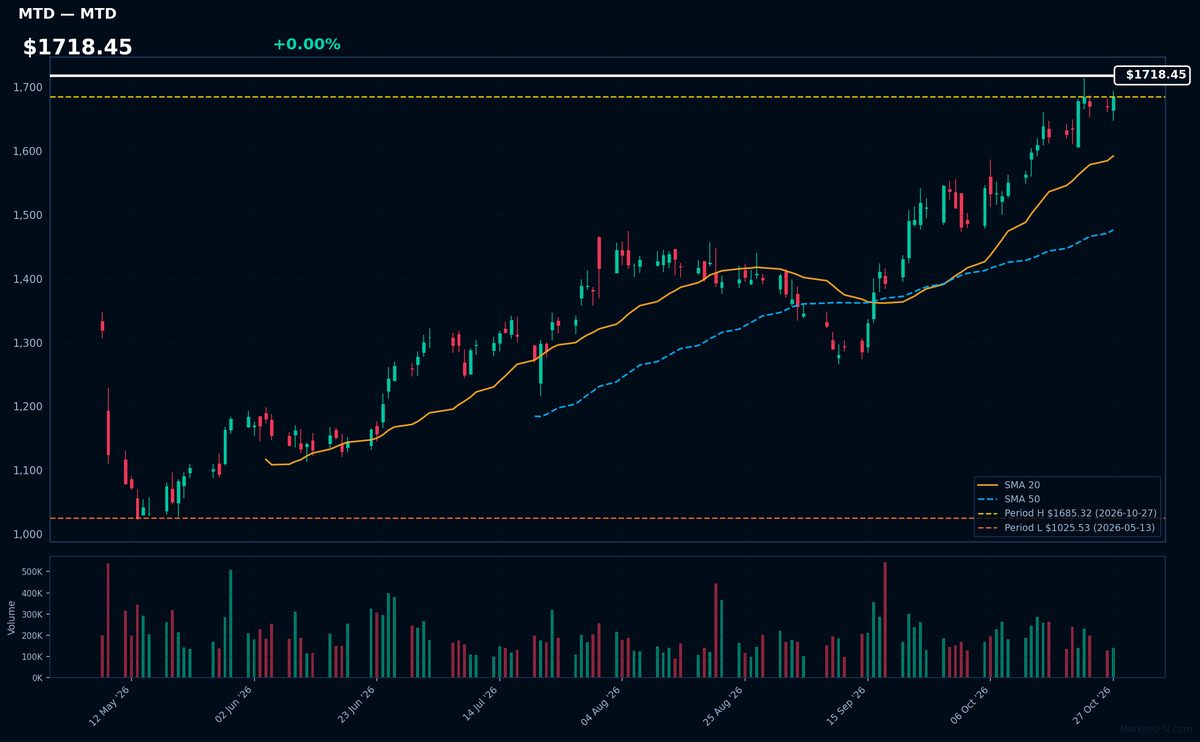
MTD | Mettler-Toledo International, Inc | Healthcare | Price Last: $1685.32 | % Realized: +19.41% | RSI: 78.1 | % above MA200: +26.2% | Trend: Above MA20, MA50, MA200
Mettler-Toledo provides precision instruments for lab/industrial weighing, analytics, and inspection. Investors care due to its mission-critical role in pharma, food safety, and materials science—sectors with steady demand growth and high regulatory barriers.
Technically overbought (RSI 78.1) but bullish MA alignment (price > MA20 > MA50 > MA200) suggests momentum. At 19.4% YTD return, the stock tests 2026 highs—watch for breakout confirmation or mean reversion.
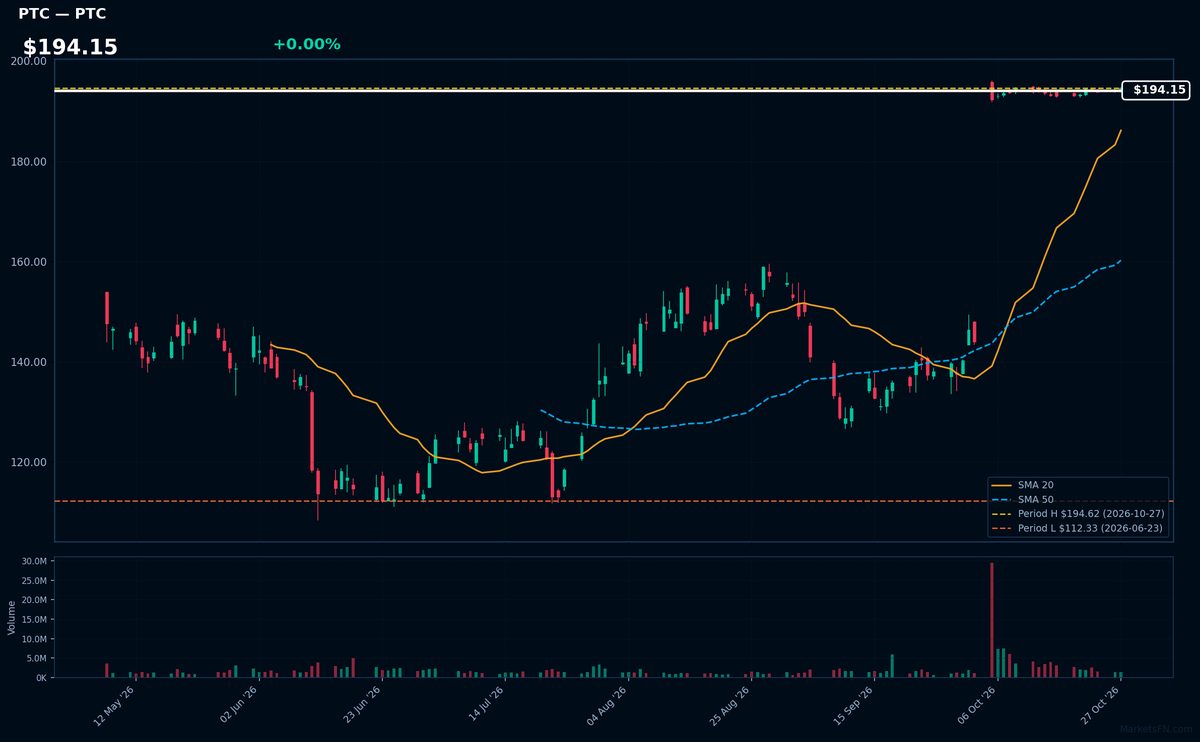
PTC | PTC Inc | Technology | Price Last: $194.62 | % Realized: +14.42% | RSI: 77.5 | % above MA200: +32.6% | Trend: Above MA20, MA50, MA200
PTC Inc provides industrial IoT and CAD/PLM software for manufacturing firms, enabling digital transformation of product development and operations. Investors care because its solutions drive efficiency in aerospace, automotive, and heavy industries — sectors undergoing massive tech modernization.
Technically overbought (RSI 77.5) but in strong uptrend (price > MA20 > MA50 > MA200). YTD +14.4% suggests momentum, though extreme proximity to YTD highs warrants caution.
📉 Nearest to 2026 Low
Sectors represented: Industrials (2), Communication Services (1), Technology (1), Consumer Cyclical (1)
| Ticker | Company | Sector | Price Last | % Realized | 2026 YTD Low Date | RSI | % above MA200 | Trend |
|---|---|---|---|---|---|---|---|---|
| NFLX | Netflix Inc | Communication Services | $62.52 | -31.29% | 2026-10-27 | 29.9 | -23.6% | Below MA20, MA50, MA200 |
| UBER | Uber Technologies Inc | Technology | $65.78 | -20.61% | 2026-10-27 | 33.9 | -10.5% | Below MA20, MA50, MA200 |
| BKNG | Booking Holdings Inc | Consumer Cyclical | $150.14 | -29.49% | 2026-10-27 | 30.8 | -15.4% | Below MA20, MA50, MA200 |
| BA | Boeing Co | Industrials | $168.18 | -26.16% | 2026-10-27 | 24.6 | -22.7% | Below MA20, MA50, MA200 |
| PCAR | Paccar Inc | Industrials | $103.73 | -7.02% | 2026-10-27 | 23.7 | -13.8% | Below MA20, MA50, MA200 |
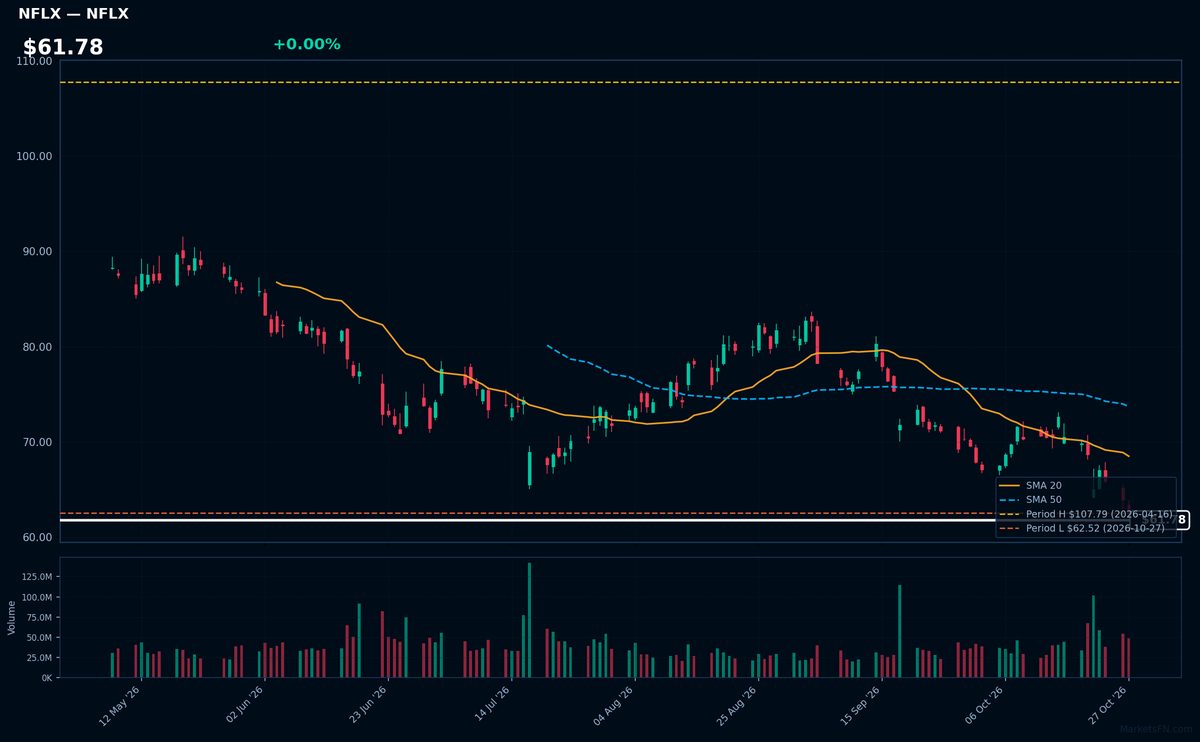
NFLX | Netflix Inc | Communication Services | Price Last: $62.52 | % Realized: -31.29% | RSI: 29.9 | % above MA200: -23.6% | Trend: Below MA20, MA50, MA200
Netflix Inc operates the world's dominant subscription streaming platform, monetizing original content and licensed programming globally. Investors care due to its first-mover advantage in streaming, pricing power, and ability to scale content investments across 200+ million subscribers.
NFLX shows extreme technical weakness: RSI(14) at 29.9 (oversold) with bearish MA alignment (price < MA20 < MA50 < MA200). Trading at 2026 YTD lows after -31.3% decline, testing critical support. Current setup signals capitulation, not fundamental strength.
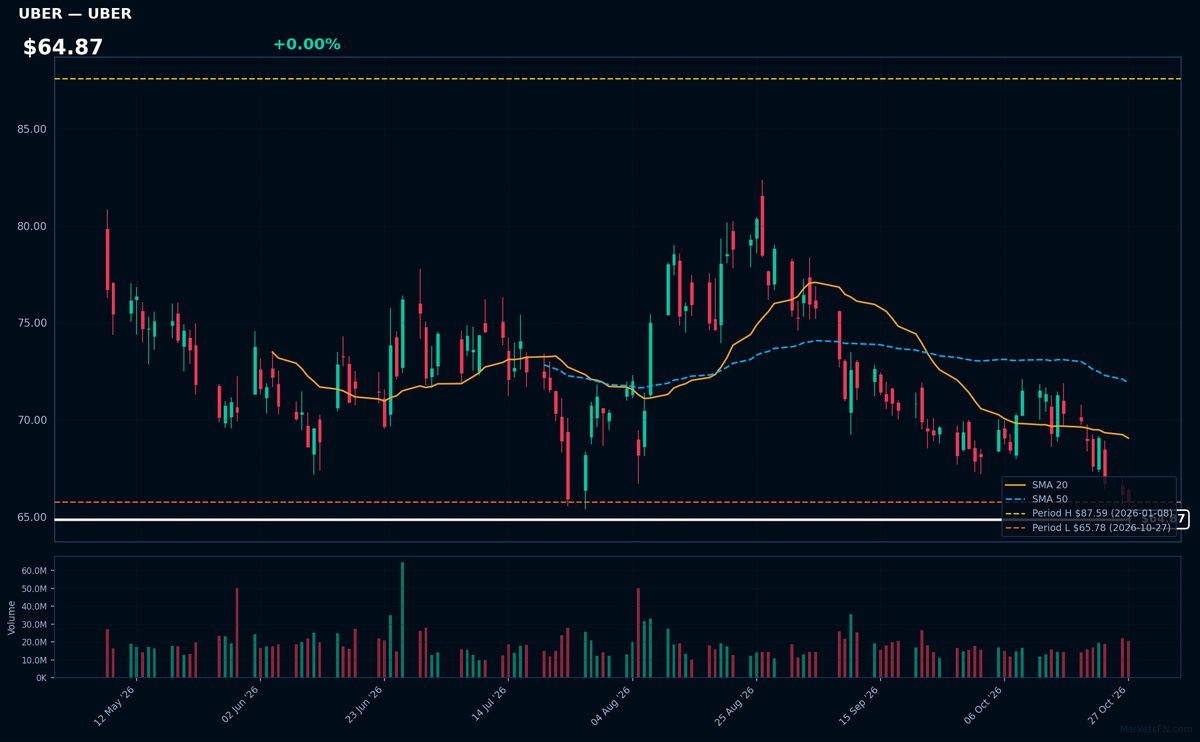
UBER | Uber Technologies Inc | Technology | Price Last: $65.78 | % Realized: -20.61% | RSI: 33.9 | % above MA200: -10.5% | Trend: Below MA20, MA50, MA200
Uber operates a global mobility platform connecting riders/drivers and a delivery network for restaurants/groceries. Investors care due to its dominant market share in ride-hailing, expanding delivery margins, and potential to leverage its massive user base for profitability as urban mobility grows.
Technically concerning: RSI(14) at 33.9 shows near-oversold conditions, but bearish MA alignment (price < MA20 < MA50 < MA200) confirms sustained downtrend. Stock tests critical support, down 20.6% YTD — warning sign until MA structure improves.
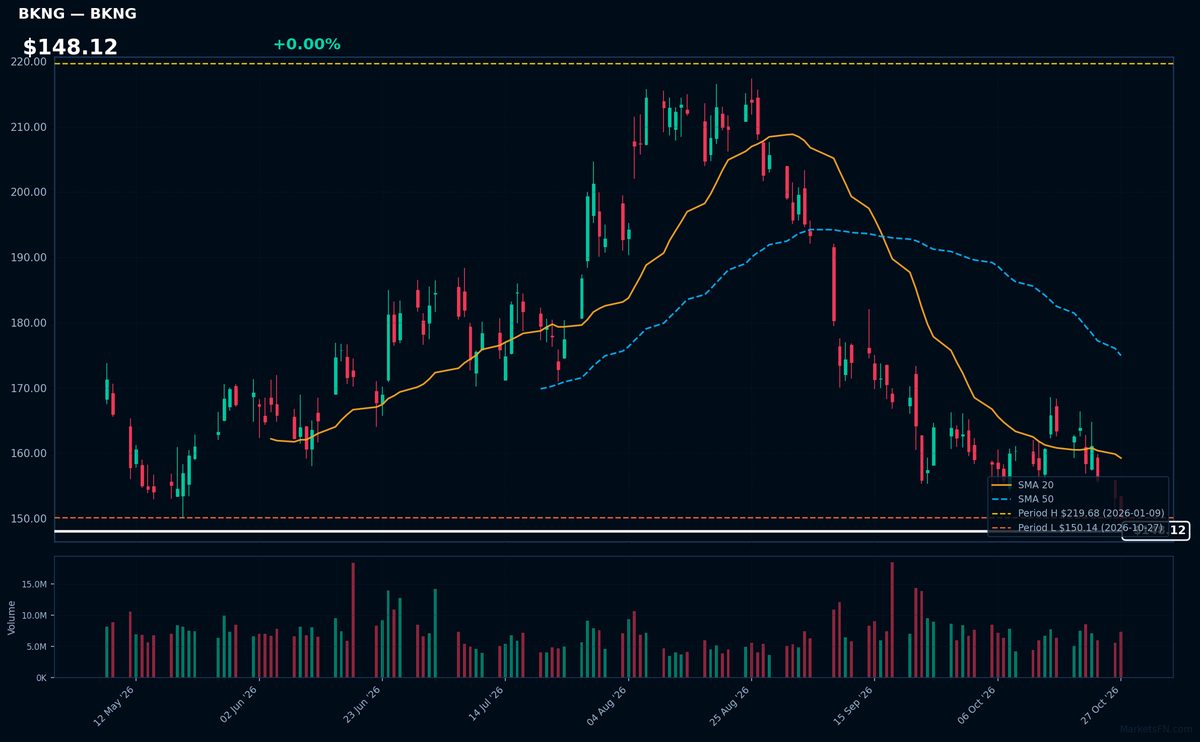
BKNG | Booking Holdings Inc | Consumer Cyclical | Price Last: $150.14 | % Realized: -29.49% | RSI: 30.8 | % above MA200: -15.4% | Trend: Below MA20, MA50, MA200
Booking Holdings operates leading online travel platforms (Booking.com, Priceline, Kayak) connecting travelers with accommodations, flights, and rental cars. Investors care due to its global scale in the $1.6T travel market, capital-light model, and pricing power in fragmented hospitality sectors.
Technically concerning: RSI(14) at 30.8 signals oversold conditions amid sustained downtrend (price < MA20 < MA50 < MA200). Stock tests 2026 lows (-29.5% YTD) with 0.0% buffer above YTD low — critical support breach risks acceleration.
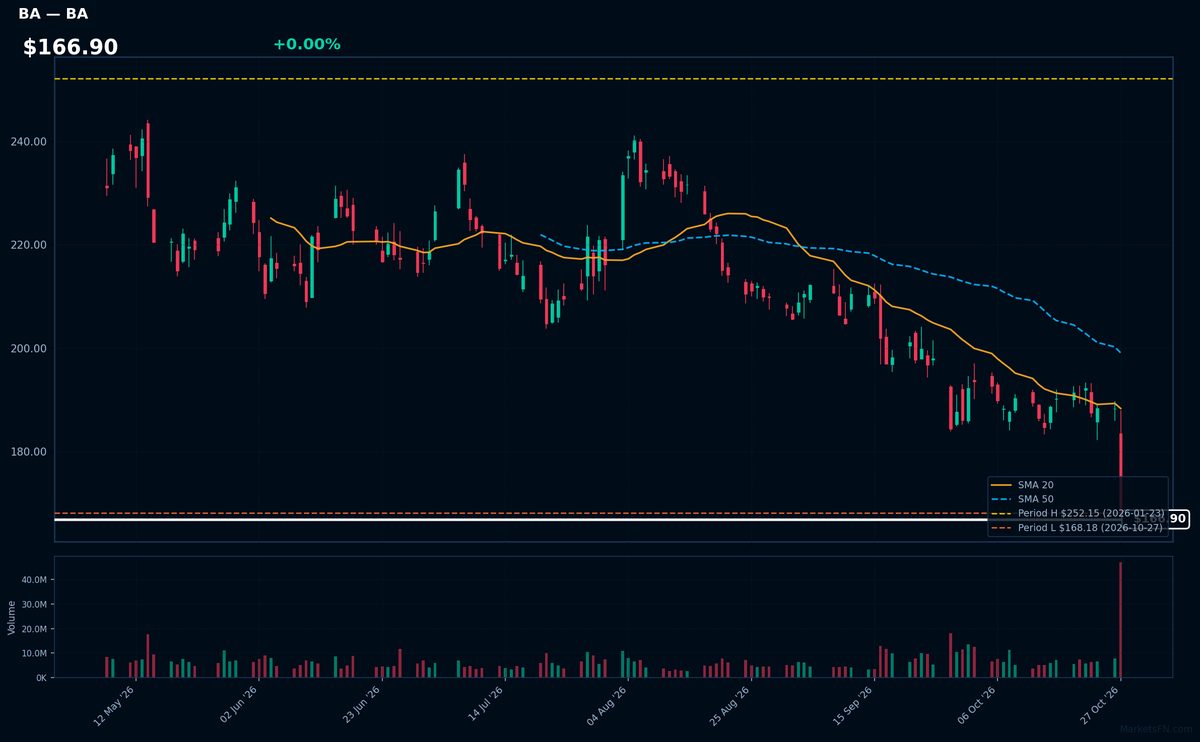
BA | Boeing Co | Industrials | Price Last: $168.18 | % Realized: -26.16% | RSI: 24.6 | % above MA200: -22.7% | Trend: Below MA20, MA50, MA200
Boeing designs and manufactures commercial jetliners, defense systems, and space technology. Investors monitor its aerospace dominance, but production delays and safety concerns create volatility, making it a high-stakes industrial play.
Technically dire: RSI(14) at 24.6 shows oversold conditions, but bearish MA alignment (price < MA20 < MA50 < MA200) confirms sustained downtrend. Testing YTD lows after -26.2% decline signals critical support breach risk.
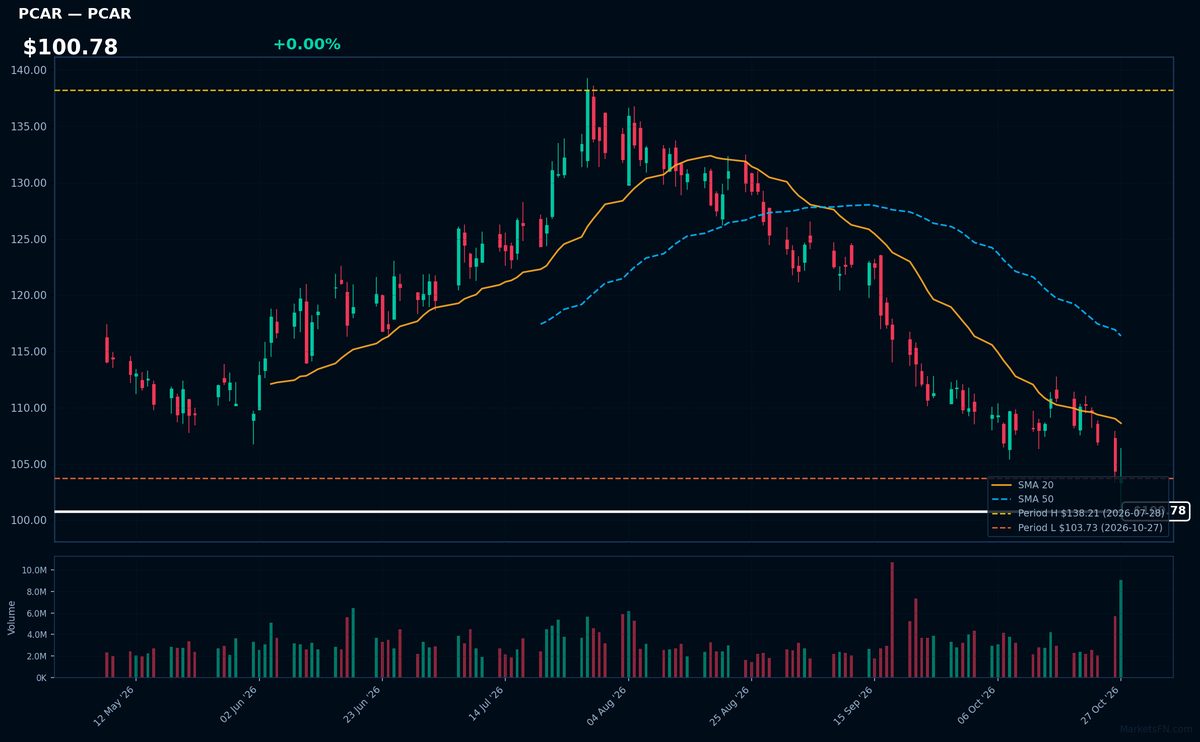
PCAR | Paccar Inc | Industrials | Price Last: $103.73 | % Realized: -7.02% | RSI: 23.7 | % above MA200: -13.8% | Trend: Below MA20, MA50, MA200
Paccar Inc designs/manufactures premium trucks under Kenworth, Peterbilt, and DAF brands, serving commercial freight markets. Investors watch PCAR as a cyclical industrial bellwether with strong aftermarket parts margins.
PCAR shows extreme technical weakness: RSI(14) at 23.7 (oversold) with bearish MA alignment (price < MA20 < MA50 < MA200). Testing 2026 lows (-7.0% YTD) signals breakdown risk.
Market Commentary
The S&P 500 stocks at their 2026 highs—AMGN, GILD, EMR, MTD, and PTC—reflect strong investor confidence in defensive healthcare (AMGN, GILD), industrial automation (EMR, PTC), and precision instruments (MTD). These sectors typically outperform in uncertain economic climates due to stable demand and high-margin recurring revenue models. Conversely, stocks near 2026 lows—NFLX, UBER, BKNG, BA, and PCAR—signal pressure on cyclical and discretionary spending sectors, with streaming (NFLX), ride-hailing (UBER), travel (BKNG), aerospace (BA), and heavy trucks (PCAR) facing macroeconomic or company-specific headwinds.
The divergence suggests a risk-off tilt, with capital rotating toward stable cash flows and away from growth-dependent or economically sensitive names. Healthcare and industrials benefit from resilient earnings, while consumer discretionary and transport stocks struggle with softening demand or operational challenges. Market conditions appear cautious, favoring quality and defensiveness over high-beta exposure.
Investors should monitor earnings revisions, guidance from industrial and healthcare leaders (EMR, AMGN), and discretionary spending trends (NFLX, BKNG). Any shift in Fed policy or macroeconomic resilience could revive cyclical stocks, while prolonged weakness may extend the defensive rally. Key risks include sector rotation or abrupt sentiment changes in these tightly clustered extremes.
Methodology: All 503 S&P 500 constituents screened. Close prices downloaded from 2026-01-01. Period high = highest close since Jan 1 2026; period low = lowest close since Jan 1 2026. Distance = (current price / period extreme − 1) × 100. Technical indicators computed on up to 1 year of daily OHLCV data.
Disclaimer: For informational purposes only. Not investment advice. Past performance is not indicative of future results.