Nasdaq 100 2026 YTD Highs & Lows Radar: AMGEN (AMGN), Netflix (NFLX) and more
MarketsFN Team

Screening all 101 Nasdaq 100 constituents for stocks nearest to their 2026 year-to-date high and their 2026 YTD low. Data as of October 28, 2026. % Realized = total return since Jan 1 2026.
Legend: RSI > 70 = overbought · RSI < 30 = oversold · Green % Realized = positive YTD return · Red = negative.
📈 Nearest to 2026 High
Sectors represented: Healthcare (3), Technology (2)
| Ticker | Company | Sector | Price Last | % Realized | 2026 YTD High Date | RSI | % above MA200 | Trend |
|---|---|---|---|---|---|---|---|---|
| AMGN | AMGEN Inc | Healthcare | $447.95 | +36.72% | 2026-10-27 | 66.8 | +20.0% | Above MA20, MA50, MA200 |
| GILD | Gilead Sciences, Inc | Healthcare | $159.08 | +30.82% | 2026-10-27 | 64.1 | +14.1% | Above MA20, MA50, MA200 |
| ZS | Zscaler Inc | Technology | $260.15 | +17.94% | 2026-10-26 | 73.8 | +56.1% | Above MA20, MA50, MA200 |
| AAPL | Apple Inc | Technology | $347.10 | +28.08% | 2026-10-22 | 57.8 | +17.4% | Above MA20, MA50, MA200 |
| BIIB | Biogen Inc | Healthcare | $252.73 | +42.13% | 2026-10-22 | 73.6 | +26.1% | Above MA20, MA50, MA200 |
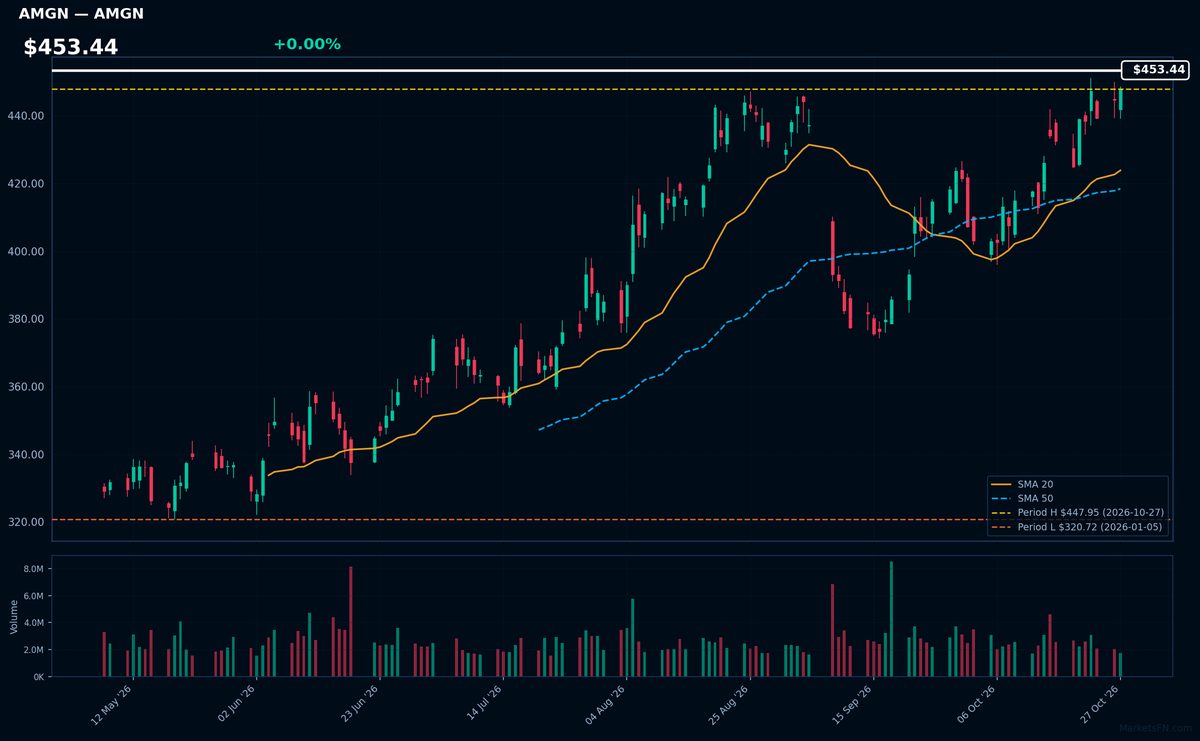
AMGN | AMGEN Inc | Healthcare | Price Last: $447.95 | % Realized: +36.72% | RSI: 66.8 | % above MA200: +20.0% | Trend: Above MA20, MA50, MA200
Amgen develops biologic medicines for serious illnesses, including top-selling autoimmune drug Enbrel and cancer treatment Kyprolis. Investors care because its pipeline targets high-margin conditions with limited competition, driving consistent cash flow.
AMGN shows bullish momentum with price > MA20 > MA50 > MA200 (RSI 66.8 nearing overbought). At YTD highs (+36.7% in 2026), this reflects sustained uptrend strength, not warning signs yet.
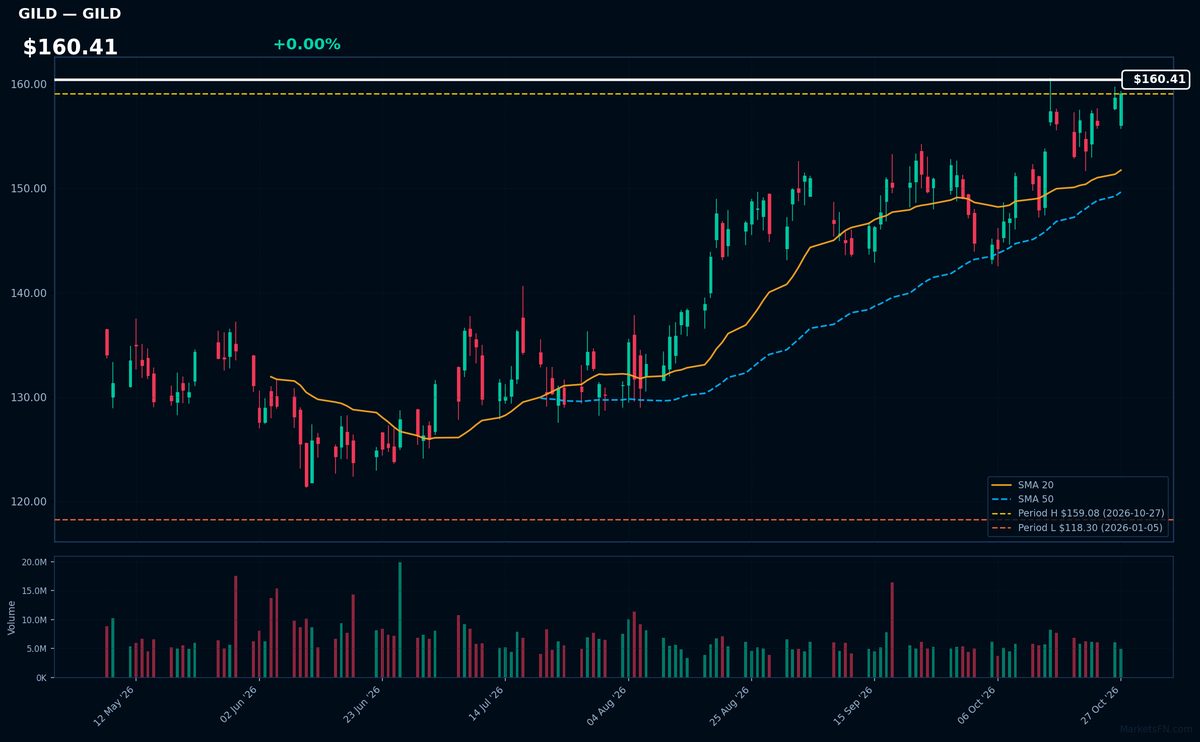
GILD | Gilead Sciences, Inc | Healthcare | Price Last: $159.08 | % Realized: +30.82% | RSI: 64.1 | % above MA200: +14.1% | Trend: Above MA20, MA50, MA200
Gilead Sciences is a biopharma leader in HIV, hepatitis C, and oncology treatments, with blockbuster drugs like Biktarvy and CAR-T therapy Yescarta. Investors watch its antiviral dominance and cancer pipeline for growth beyond its $160.41 share price.
Technically bullish: RSI(14) at 64.1 shows momentum without overbought risk, with price > MA20 > MA50 > MA200 confirming the 30.8% YTD uptrend. At 0.0% below its YTD high, it tests breakout potential.
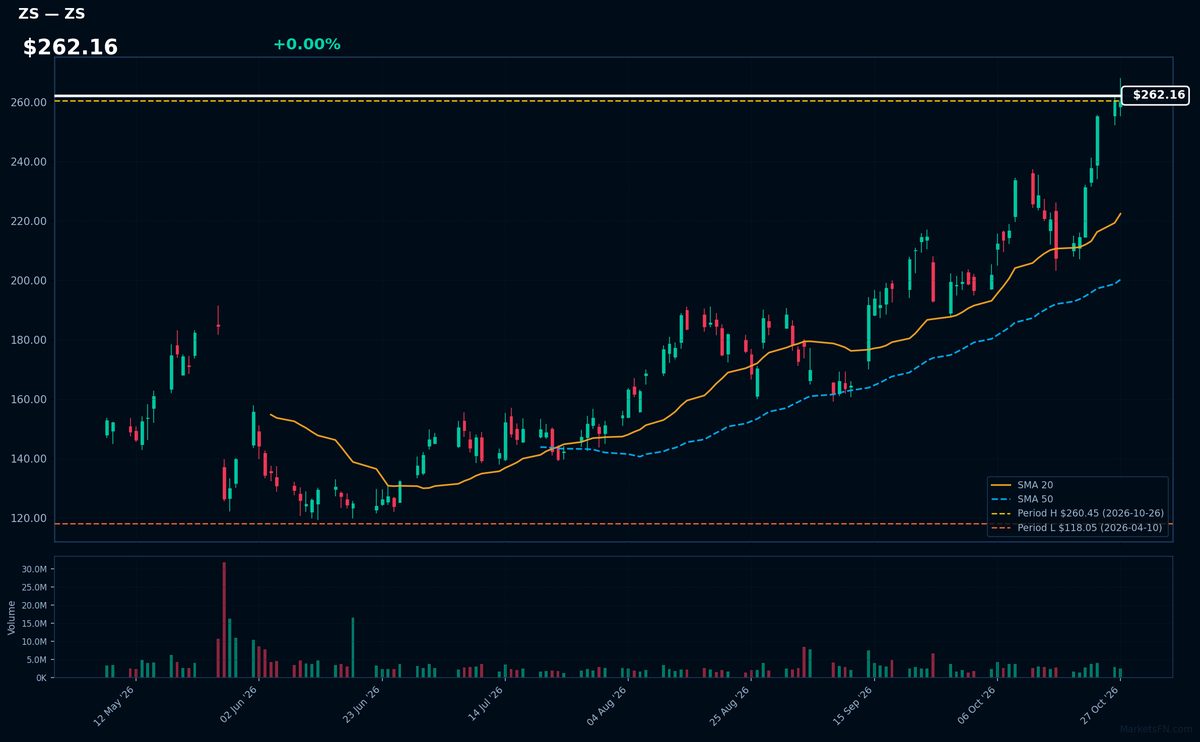
ZS | Zscaler Inc | Technology | Price Last: $260.15 | % Realized: +17.94% | RSI: 73.8 | % above MA200: +56.1% | Trend: Above MA20, MA50, MA200
Zscaler provides cloud-based cybersecurity solutions, specializing in zero-trust network access. Investors care as enterprises shift from VPNs to its scalable platform for secure remote work, with recurring revenue from cloud subscriptions showing durable growth.
Technically overbought (RSI 73.8) but bullish MA alignment (price > MA20 > MA50 > MA200) suggests sustained momentum. Near YTD high (+17.9% YTD), watch for breakout confirmation.
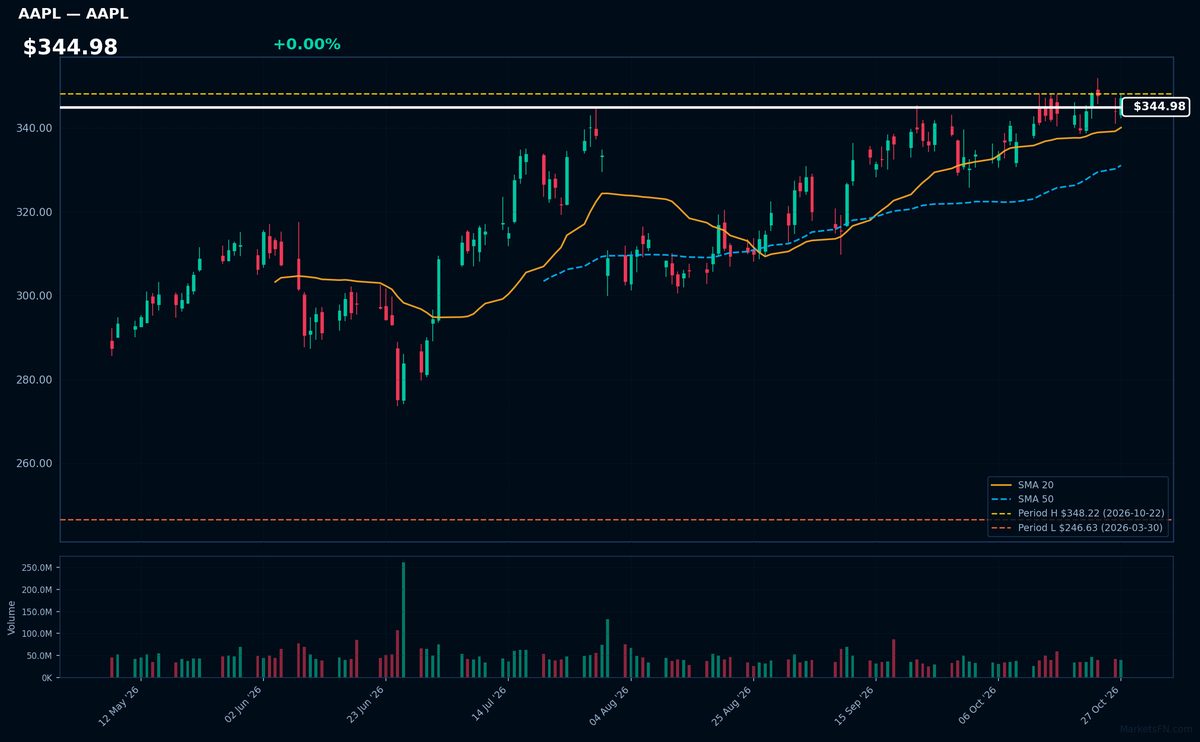
AAPL | Apple Inc | Technology | Price Last: $347.10 | % Realized: +28.08% | RSI: 57.8 | % above MA200: +17.4% | Trend: Above MA20, MA50, MA200
Apple Inc designs premium consumer electronics (iPhone, Mac, iPad), operates services (App Store, iCloud), and develops proprietary silicon chips. Investors care due to its pricing power, ecosystem lock-in, and $28B annual R&D spend driving iterative hardware upgrades.
AAPL shows bullish momentum (RSI 57.8, price > MA20 > MA50 > MA200) but nears overbought territory at 0.3% below YTD high after 28.1% YTD gain — watch for consolidation.
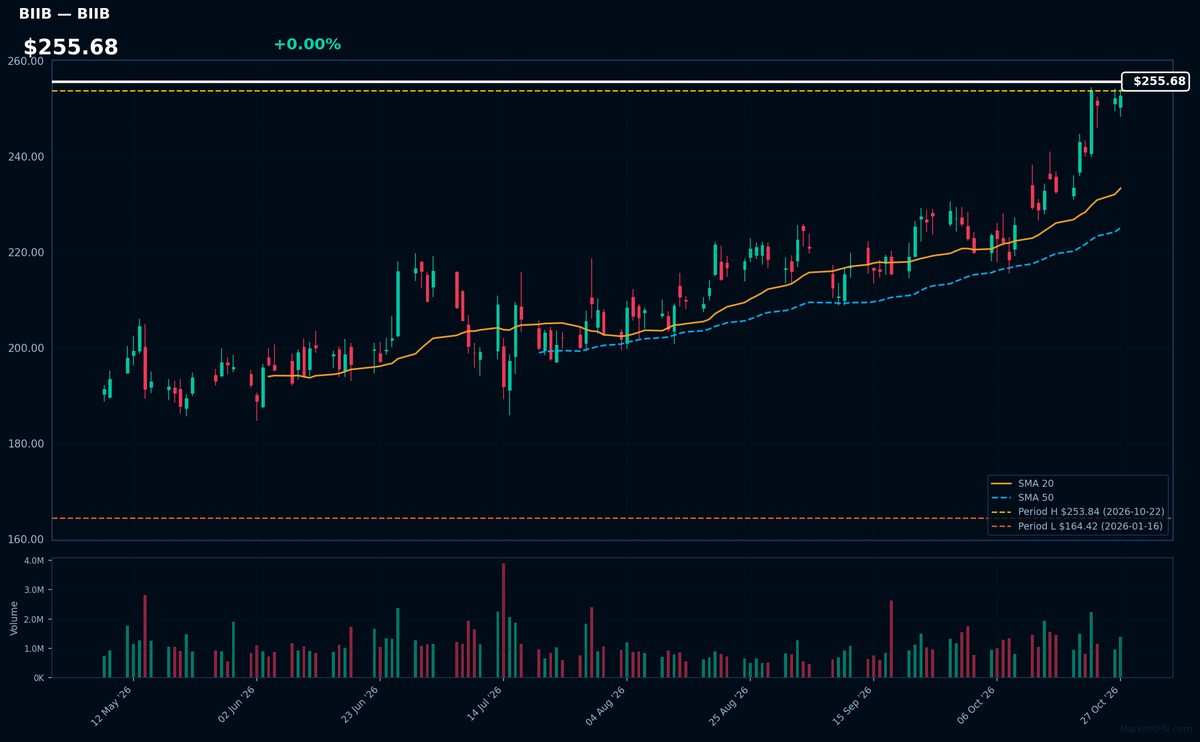
BIIB | Biogen Inc | Healthcare | Price Last: $252.73 | % Realized: +42.13% | RSI: 73.6 | % above MA200: +26.1% | Trend: Above MA20, MA50, MA200
Biogen Inc specializes in neuroscience therapies, including multiple sclerosis and Alzheimer's treatments. Investors care because its pipeline targets high-need neurological conditions with limited treatment options, creating potential for outsized returns if clinical successes convert to commercial wins.
Biogen shows strong bullish momentum with RSI(14) at 73.6 and price > MA20 > MA50 > MA200. The stock sits just 0.4% below its 2026 high after gaining 42.1% YTD, suggesting sustained uptrend but nearing overbought territory given elevated RSI.
📉 Nearest to 2026 Low
Sectors represented: Communication Services (3), Consumer Cyclical (1), Industrials (1)
| Ticker | Company | Sector | Price Last | % Realized | 2026 YTD Low Date | RSI | % above MA200 | Trend |
|---|---|---|---|---|---|---|---|---|
| NFLX | Netflix Inc | Communication Services | $62.52 | -31.29% | 2026-10-27 | 29.9 | -23.6% | Below MA20, MA50, MA200 |
| BKNG | Booking Holdings Inc | Consumer Cyclical | $150.14 | -29.49% | 2026-10-27 | 30.6 | -15.4% | Below MA20, MA50, MA200 |
| PCAR | Paccar Inc | Industrials | $103.73 | -7.02% | 2026-10-27 | 23.7 | -13.8% | Below MA20, MA50, MA200 |
| TMUS | T-Mobile US Inc | Communication Services | $146.83 | -26.43% | 2026-10-23 | 34.8 | -21.6% | Below MA20, MA50, MA200 |
| APP | Applovin Corp | Communication Services | $262.82 | -57.49% | 2026-10-23 | 35.6 | -37.4% | Below MA20, MA50, MA200 |
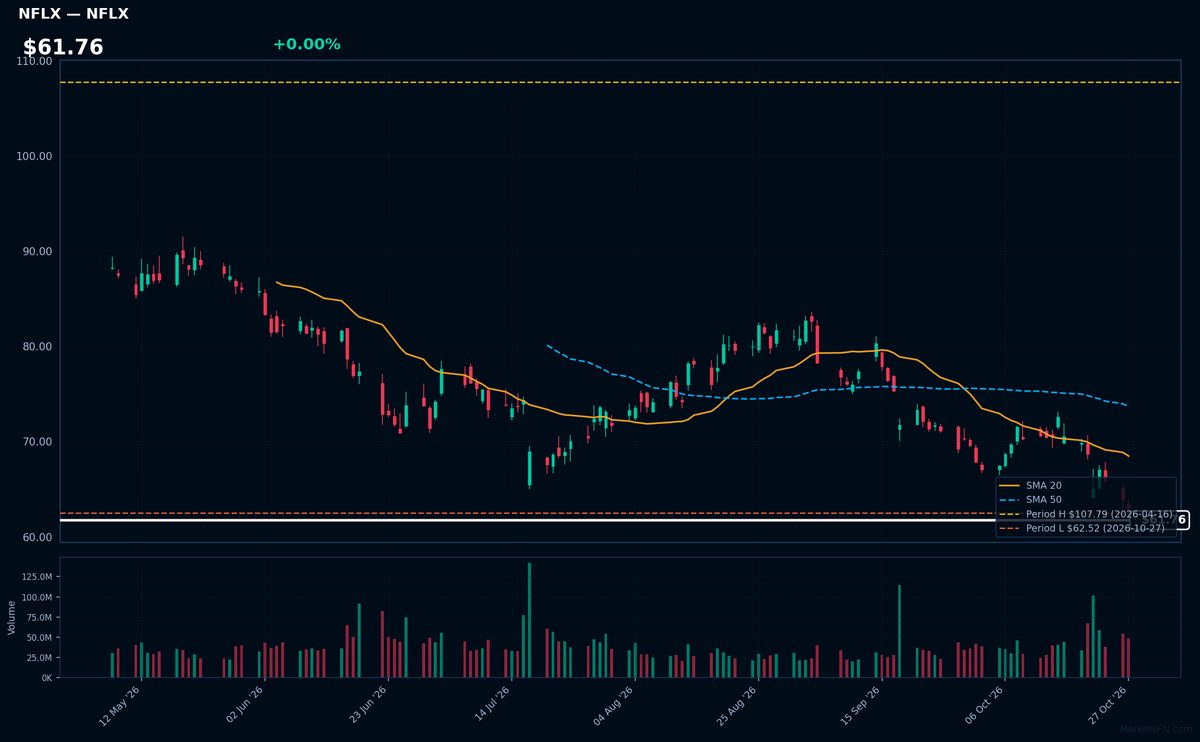
NFLX | Netflix Inc | Communication Services | Price Last: $62.52 | % Realized: -31.29% | RSI: 29.9 | % above MA200: -23.6% | Trend: Below MA20, MA50, MA200
Netflix Inc operates the world's dominant subscription streaming platform, producing original content while licensing third-party shows. Investors care due to its global scale, pricing power in entertainment, and ability to monetize engagement through ads and tiered subscriptions.
Netflix shows extreme technical weakness: RSI(14) at 29.9 (oversold) with bearish MA alignment (price < MA20 < MA50 < MA200). Trading just 0.0% above 2026 lows after a -31.3% YTD drop, this signals breakdown risk, not momentum. Strictly a warning sign per the data.
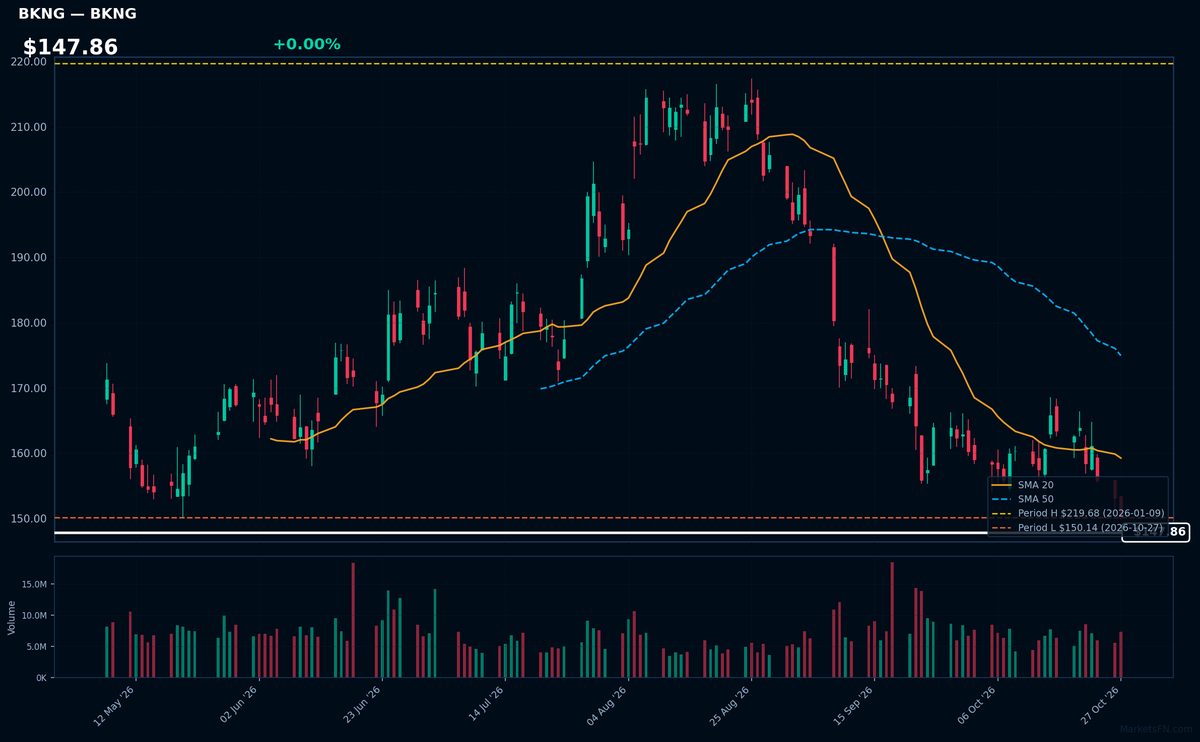
BKNG | Booking Holdings Inc | Consumer Cyclical | Price Last: $150.14 | % Realized: -29.49% | RSI: 30.6 | % above MA200: -15.4% | Trend: Below MA20, MA50, MA200
Booking Holdings operates leading online travel platforms (Booking.com, Priceline, Kayak) connecting travelers with lodging/transportation. Investors care due to its global scale in the $1.8T travel market and high-margin digital model.
Technically concerning: RSI(14) at 30.6 shows oversold conditions amid bearish MA alignment (price < MA20 < MA50 < MA200). Stock tests 2026 lows after -29.5% YTD decline.
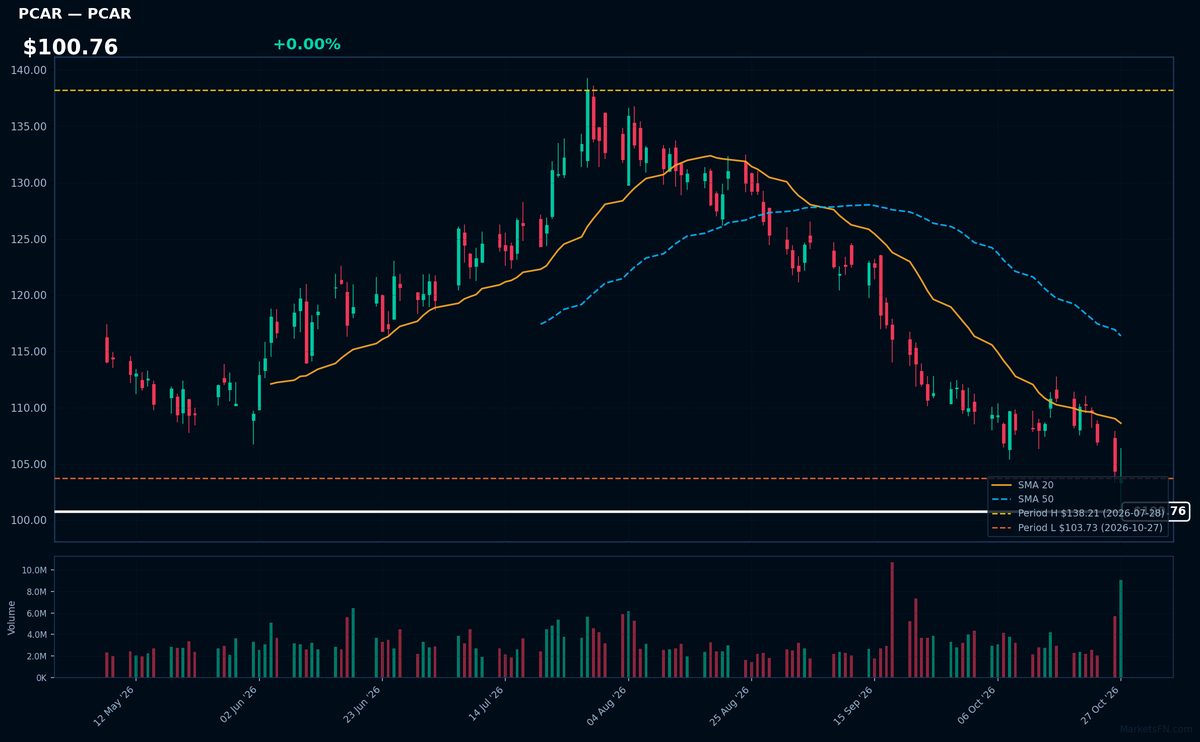
PCAR | Paccar Inc | Industrials | Price Last: $103.73 | % Realized: -7.02% | RSI: 23.7 | % above MA200: -13.8% | Trend: Below MA20, MA50, MA200
Paccar Inc designs/manufactures premium trucks under Kenworth, Peterbilt, and DAF brands, serving commercial freight markets. Investors watch PCAR as a cyclical bellwether for truck demand, fleet replacement cycles, and diesel/EV truck adoption trends.
Technically oversold (RSI 23.7) in sustained downtrend (price < MA20 < MA50 < MA200), testing YTD lows after -7.0% 2026 decline. Bearish momentum extreme.
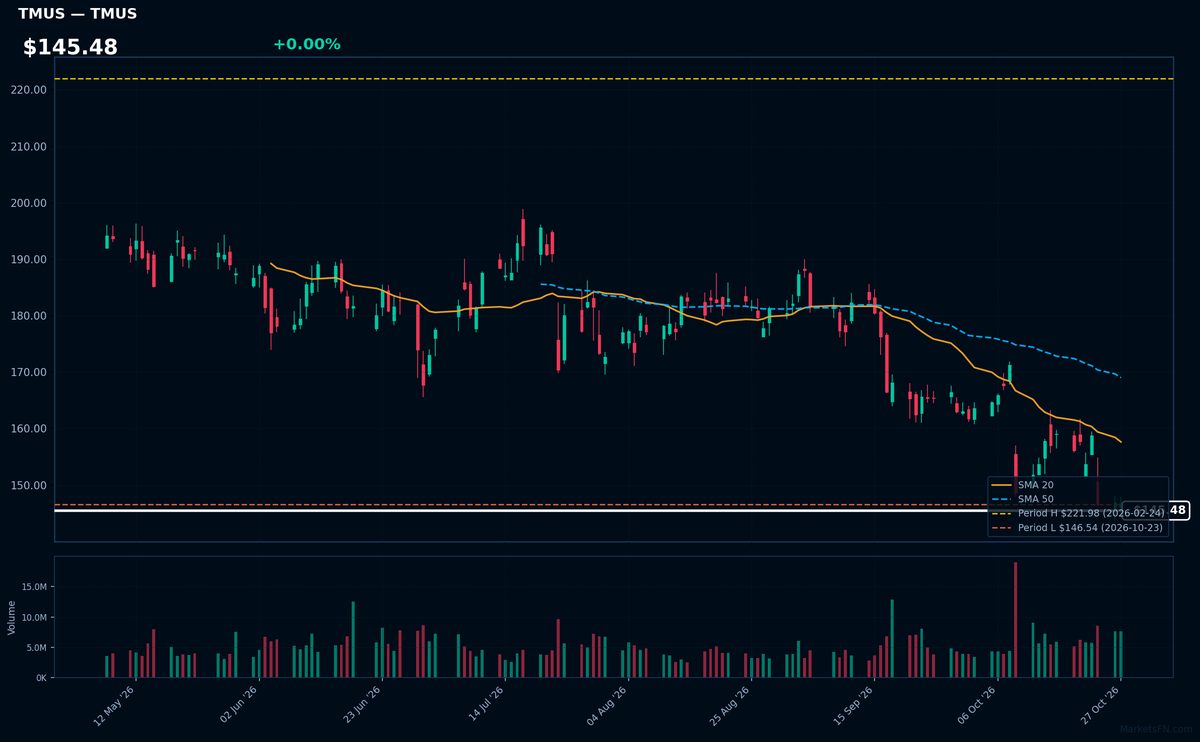
TMUS | T-Mobile US Inc | Communication Services | Price Last: $146.83 | % Realized: -26.43% | RSI: 34.8 | % above MA200: -21.6% | Trend: Below MA20, MA50, MA200
T-Mobile US Inc operates as a major wireless carrier in the U.S., known for aggressive pricing and network expansion. Investors watch its subscriber growth and 5G rollout, which drive revenue in the competitive telecom sector.
TMUS shows bearish momentum with RSI(14) at 34.8 and sustained downtrend (price < MA20 < MA50 < MA200). The stock tests critical support, down 26.4% YTD—a clear warning sign per the technicals.
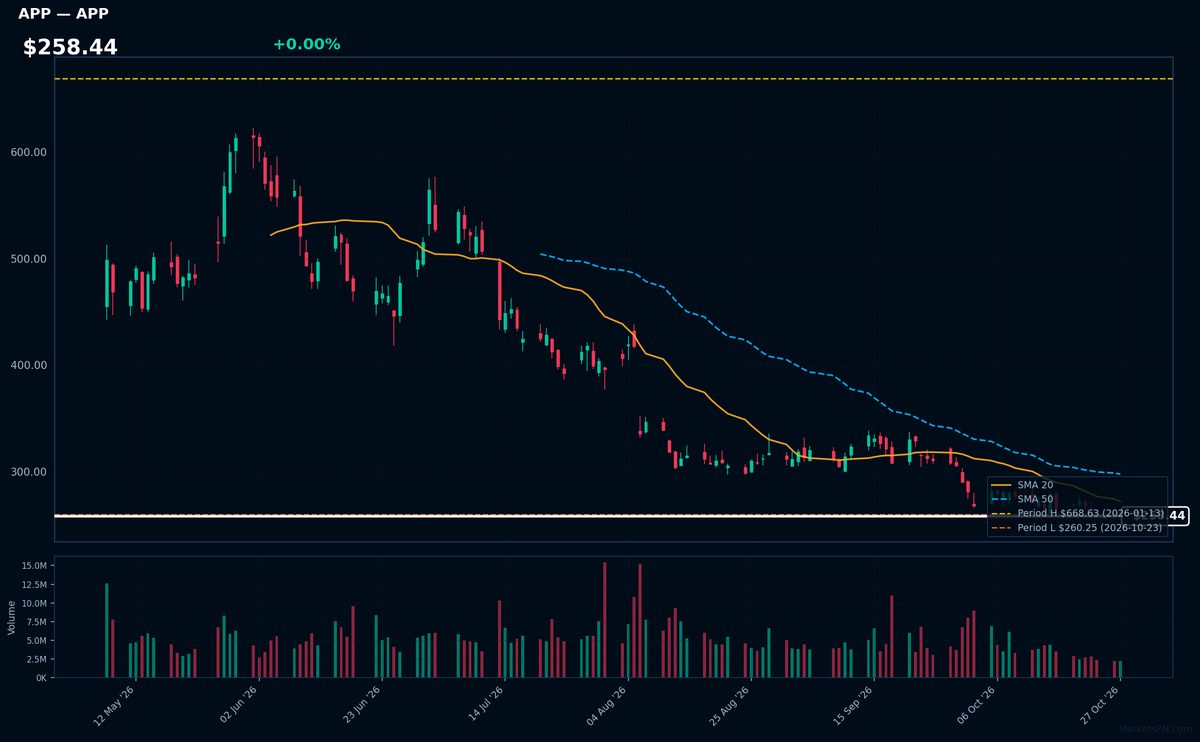
APP | Applovin Corp | Communication Services | Price Last: $262.82 | % Realized: -57.49% | RSI: 35.6 | % above MA200: -37.4% | Trend: Below MA20, MA50, MA200
Applovin operates a mobile app technology platform that helps developers monetize and grow their apps through advertising and analytics tools. Investors care due to its exposure to the high-growth mobile ad market and programmatic advertising trends.
Technically, APP shows extreme weakness: RSI(14) at 35.6, bearish MA alignment (price < MA20 < MA50 < MA200), and -57.5% YTD decline. Testing 2026 lows just 1.0% above support signals severe downside momentum.
Market Commentary
The Nasdaq 100's 2026 extremes reveal a divergence between defensive healthcare/biotech names (AMGN, GILD, BIIB) and high-growth tech (AAPL, ZS) near highs, while consumer discretionary (NFLX, BKNG) and telecom (TMUS) hover near lows. This suggests investors favor stable cash flows in uncertain macro conditions, while former momentum darlings face pressure from valuation concerns or slowing growth expectations.
Biopharma resilience likely reflects durable demand for therapies, while Apple and Zscaler benefit from entrenched ecosystems and cybersecurity tailwinds. Conversely, streaming (NFLX) and travel (BKNG) may be pricing in consumer spending fatigue, with TMUS potentially weighed by capex fears. AppLovin's (+1.0% from low) relative outperformance in ad-tech hints at selective appetite for AI-driven earnings.
Traders should monitor whether healthcare extends leadership or if oversold discretionary names rebound on Fed pivot hopes. Key catalysts include Q2 earnings guidance from AAPL (July 30) and NFLX (July 18), plus CPI prints influencing rate expectations. Confirmation of ZS's breakout or BIIB's breakdown could signal sector rotation acceleration.
Methodology: All 101 Nasdaq 100 constituents screened. Close prices downloaded from 2026-01-01. Period high = highest close since Jan 1 2026; period low = lowest close since Jan 1 2026. Distance = (current price / period extreme − 1) × 100. Technical indicators computed on up to 1 year of daily OHLCV data.
Disclaimer: For informational purposes only. Not investment advice. Past performance is not indicative of future results.