S&P 500 52-Week Highs & Lows Radar: Chevron (CVX), Transdigmorporated (TDG) and more
MarketsFN Team

S&P 500 52-Week Highs & Lows Radar: Chevron (CVX), Transdigmorporated (TDG) and more
Screening all 503 S&P 500 constituents for stocks nearest to their 52-week high and their 52-week low. Data as of September 14, 2026. % Realized = 52-week total return.
Legend: RSI > 70 = overbought · RSI < 30 = oversold · Green % Realized = positive 52W return · Red = negative.
📈 Nearest to 52-Week High
Sectors represented: Energy (5)
| Ticker | Company | Sector | Price Last | % Realized | 52-Week High Date | RSI | % above MA200 | Trend |
|---|---|---|---|---|---|---|---|---|
| CVX | Chevron Corp | Energy | $216.16 | +37.41% | 2026-09-14 | 71.3 | +18.3% | Above MA20, MA50, MA200 |
| COP | Conoco Phillips | Energy | $138.66 | +50.18% | 2026-09-14 | 69.6 | +21.7% | Above MA20, MA50, MA200 |
| MPC | Marathon Petroleum Corp | Energy | $406.42 | +125.86% | 2026-09-14 | 77.8 | +64.7% | Above MA20, MA50, MA200 |
| PSX | Phillips 66 | Energy | $264.18 | +101.39% | 2026-09-14 | 77.1 | +50.5% | Above MA20, MA50, MA200 |
| VLO | Valero Energy Corp | Energy | $398.37 | +152.82% | 2026-09-14 | 80.9 | +62.6% | Above MA20, MA50, MA200 |
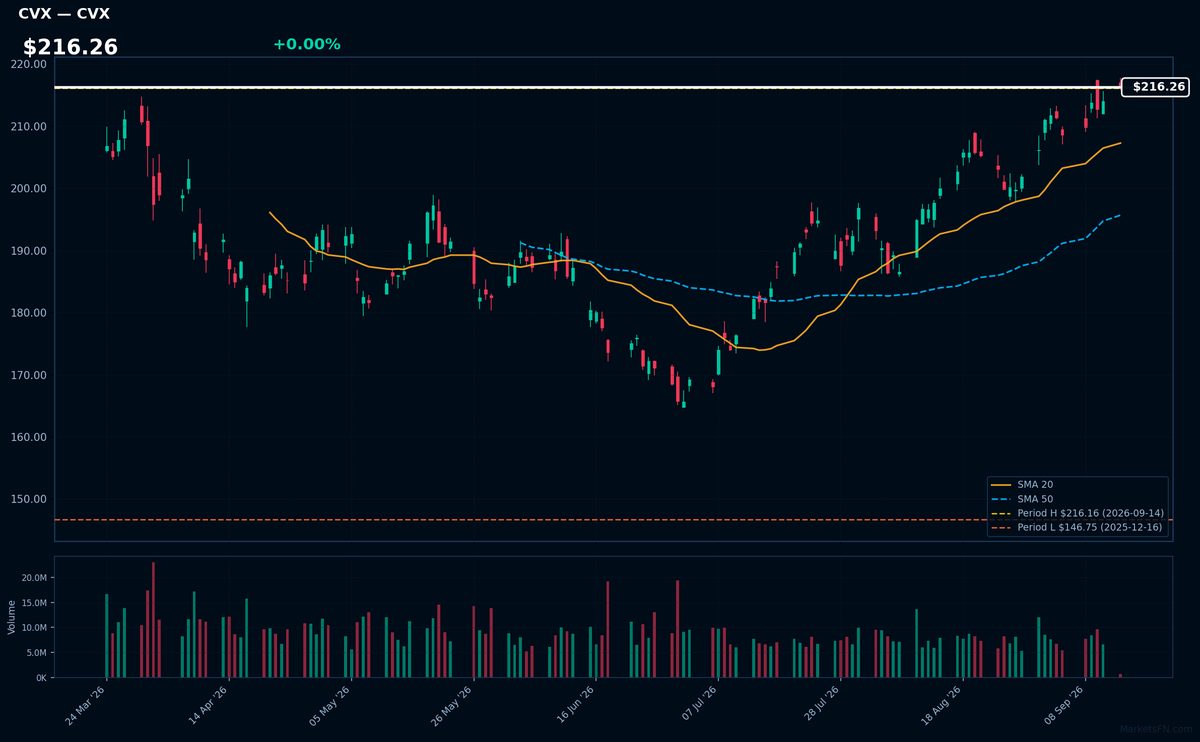
CVX | Chevron Corp | Energy | Price Last: $216.16 | % Realized: +37.41% | RSI: 71.3 | % above MA200: +18.3% | Trend: Above MA20, MA50, MA200
Chevron Corp is a multinational energy corporation that engages in the exploration, production, and refining of oil and natural gas. Investors care due to its significant role in the energy sector and potential for dividend income.
Chevron Corp's current technical situation indicates strong momentum with an RSI(14) of 71.3 and a bullish MA alignment (price > MA20 > MA50 > MA200), suggesting a sustained uptrend. The stock is near its 52-Week high, 0.0% below, indicating a potential breakout level.
Related headlines
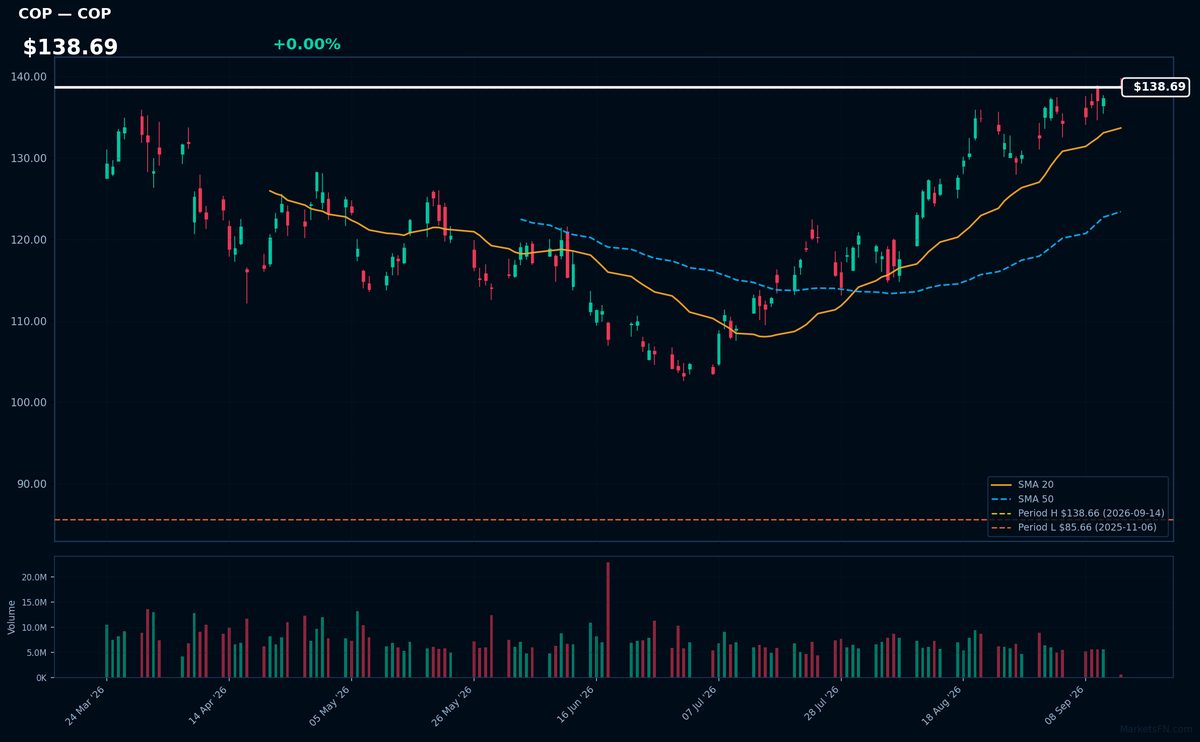
COP | Conoco Phillips | Energy | Price Last: $138.66 | % Realized: +50.18% | RSI: 69.6 | % above MA200: +21.7% | Trend: Above MA20, MA50, MA200
ConocoPhillips is an energy company focused on hydrocarbon exploration and production. Investors should care about its operational efficiency, reserve replacement, and production growth as these factors directly impact its profitability and ability to generate cash.
ConocoPhillips is near a potential breakout at its 52-Week high with an RSI(14) of 69.6, indicating strong momentum. The bullish MA alignment (price > MA20 > MA50 > MA200) supports a sustained uptrend, suggesting continued upward pressure.
Related headlines
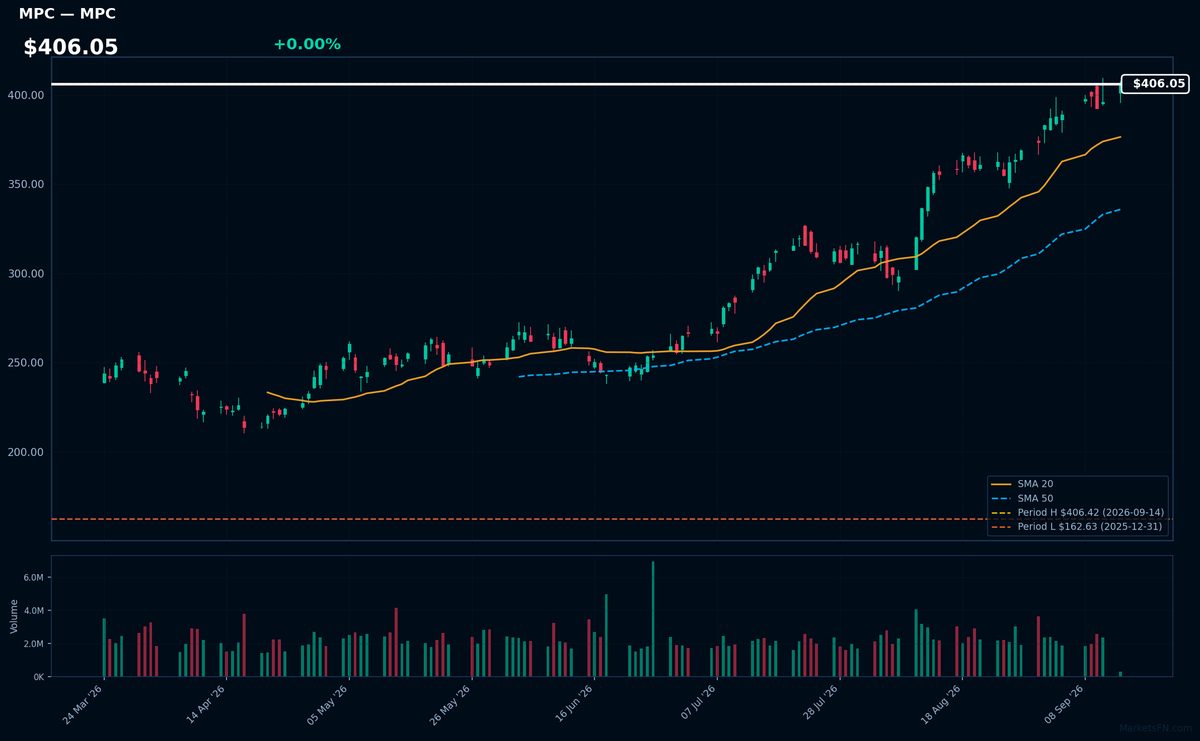
MPC | Marathon Petroleum Corp | Energy | Price Last: $406.42 | % Realized: +125.86% | RSI: 77.8 | % above MA200: +64.7% | Trend: Above MA20, MA50, MA200
Marathon Petroleum Corp (MPC) operates as an energy company, primarily involved in refining, marketing, and transporting petroleum products. Investors should care due to its significant role in the energy sector, influencing supply chains and potentially benefiting from demand fluctuations.
MPC's RSI(14) is 77.8, indicating strong momentum with price > MA20 > MA50 > MA200, a bullish alignment. The stock is 0.0% below its 52-Week high, suggesting a potential breakout, reinforcing the uptrend signal.
Related headlines
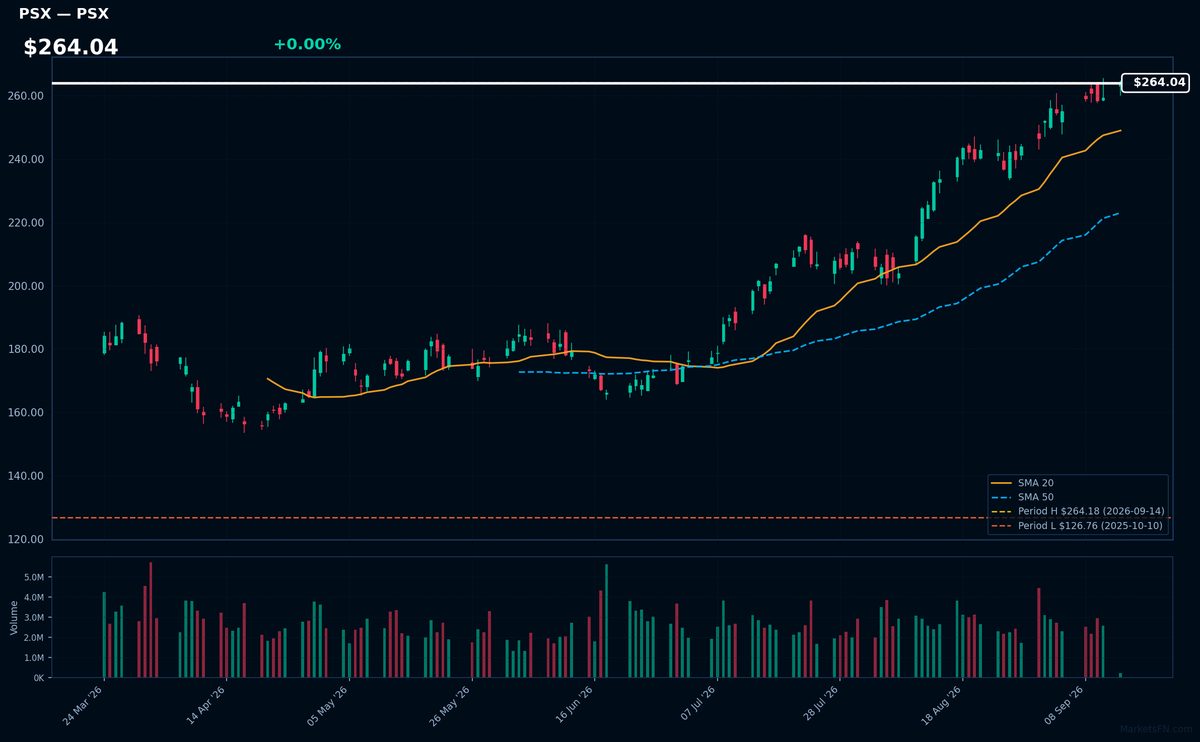
PSX | Phillips 66 | Energy | Price Last: $264.18 | % Realized: +101.39% | RSI: 77.1 | % above MA200: +50.5% | Trend: Above MA20, MA50, MA200
Phillips 66 is a diversified energy company with midstream, chemicals, refining, and marketing segments. Investors should care about its refining margins, midstream volumes, and chemicals demand, as these drive cash flow and dividend sustainability.
PSX's RSI(14) is 77.1, nearing overbought territory, with a bullish MA alignment (price > MA20 > MA50 > MA200) and 0.0% below its 52-Week high, indicating strong momentum; the 101.4% 52-Week return reinforces this trend.
Related headlines
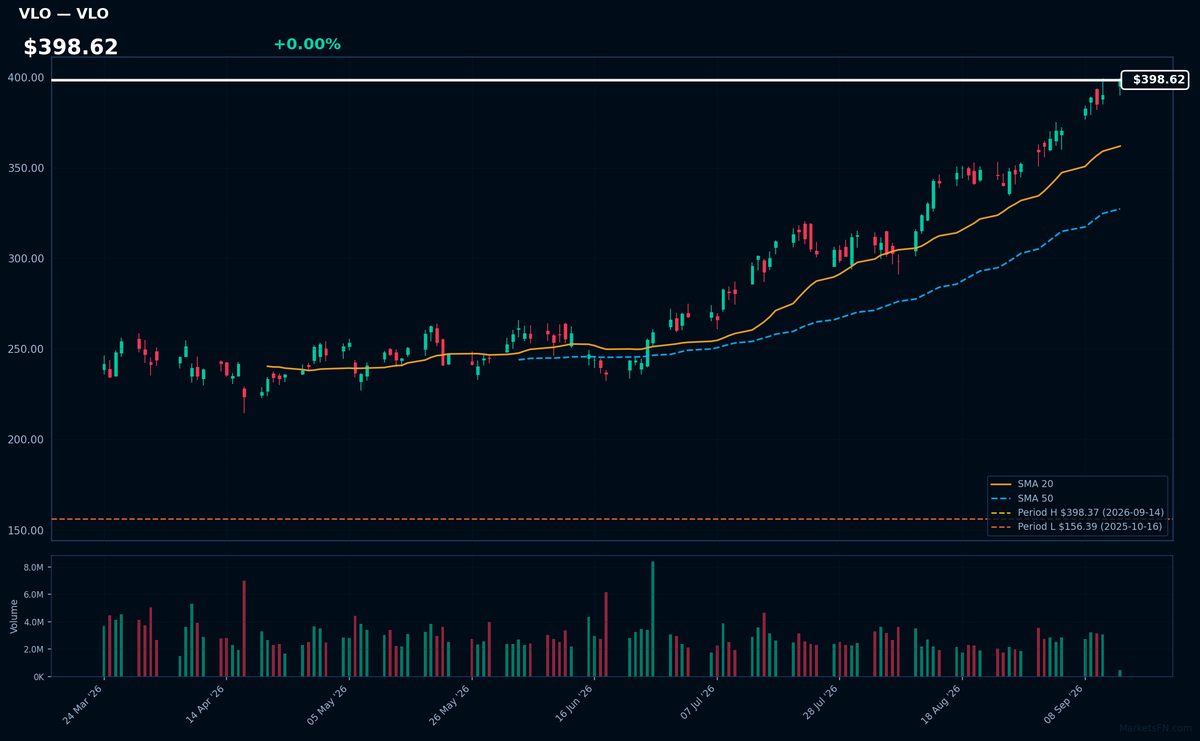
VLO | Valero Energy Corp | Energy | Price Last: $398.37 | % Realized: +152.82% | RSI: 80.9 | % above MA200: +62.6% | Trend: Above MA20, MA50, MA200
Valero Energy Corp is a refining company that operates a large network of refineries, producing fuels like gasoline and diesel, making it a key player in the energy sector; investors care due to its significant role in the global energy supply chain.
Valero Energy Corp's RSI is 80.9, indicating overbought conditions, with a bullish MA alignment (price > MA20 > MA50 > MA200) and 0.0% below its 52-Week high, suggesting potential momentum; however, the high RSI may be a warning sign.
Related headlines
📉 Nearest to 52-Week Low
Sectors represented: Industrials (2), Real Estate (2), Utilities (1)
| Ticker | Company | Sector | Price Last | % Realized | 52-Week Low Date | RSI | % above MA200 | Trend |
|---|---|---|---|---|---|---|---|---|
| TDG | Transdigm Group Incorporated | Industrials | $1112.28 | -13.65% | 2026-09-14 | 30.3 | -12.0% | Below MA20, MA50, MA200 |
| CCI | Crown Castle Inc | Real Estate | $73.58 | -21.37% | 2026-09-14 | 42.2 | -12.8% | Below MA20, MA50, MA200 |
| PEG | Public Service Enterprise Group Inc | Utilities | $72.14 | -13.06% | 2026-09-14 | 33.2 | -9.5% | Below MA20, MA50, MA200 |
| EQR | Equity Residential Properties Trust | Real Estate | $63.66 | -7.74% | 2026-08-17 | 21.2 | — | — |
| LII | Lennox International Inc | Industrials | $360.91 | -34.60% | 2026-09-14 | 27.2 | -27.2% | Below MA20, MA50, MA200 |
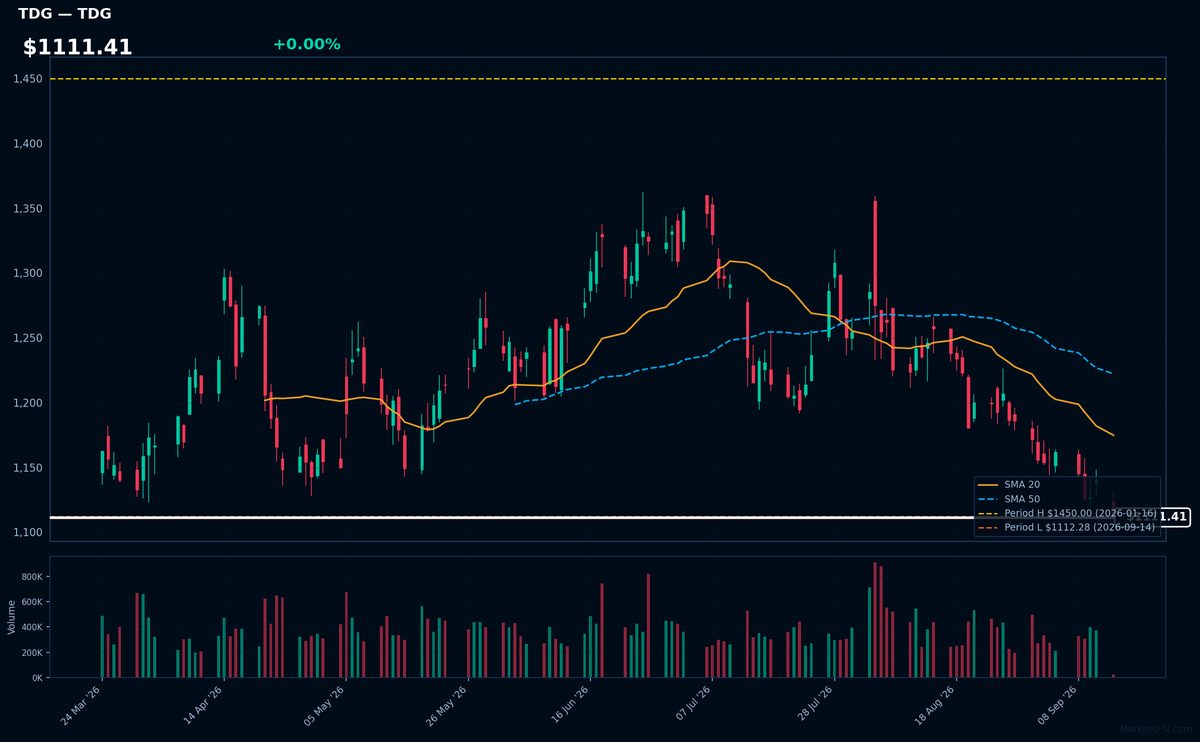
TDG | Transdigm Group Incorporated | Industrials | Price Last: $1112.28 | % Realized: -13.65% | RSI: 30.3 | % above MA200: -12.0% | Trend: Below MA20, MA50, MA200
Transdigm Group Incorporated is a leading aerospace components manufacturer, producing proprietary, highly-engineered products for commercial and defense aircraft. Investors should care due to its significant market share and potential for long-term growth driven by increasing demand for air travel and defense spending.
TDG's technical situation indicates a warning sign with an RSI(14) of 30.3, suggesting oversold conditions, and a bearish MA alignment (price < MA20 < MA50 < MA200), indicating a sustained downtrend. The stock is 0.0% above its 52-Week low, testing major support.
Related headlines
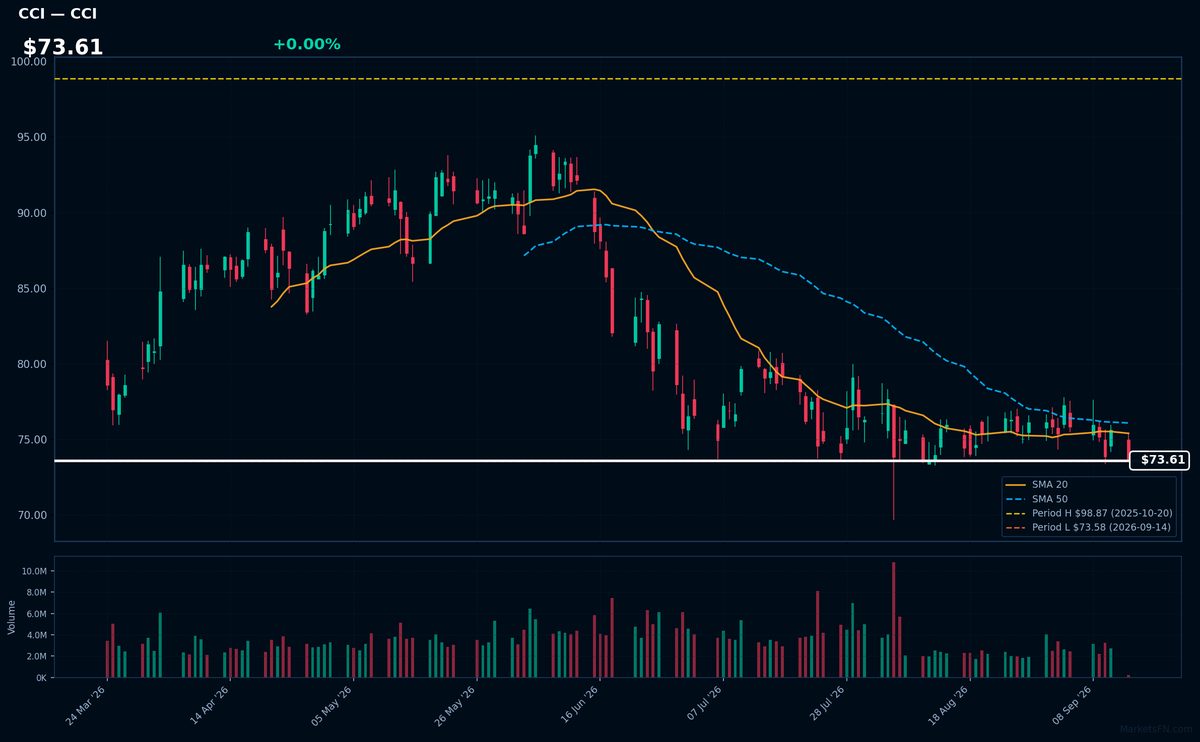
CCI | Crown Castle Inc | Real Estate | Price Last: $73.58 | % Realized: -21.37% | RSI: 42.2 | % above MA200: -12.8% | Trend: Below MA20, MA50, MA200
Crown Castle Inc (CCI) owns and operates a large portfolio of cell towers and fiber infrastructure, crucial for telecommunications. Investors care due to its significant role in supporting 5G networks and potential for steady cash flows from long-term lease agreements.
CCI's technicals indicate a sustained downtrend with price ($73.61) below MA20, MA50, and MA200. RSI(14) is 42.2, nearing oversold territory. The stock is 0.0% above its 52-Week low, testing major support, and has returned -21.4% over the 52-Week period, signaling a warning.
Related headlines
- Crown Castle to Present at the Bank of America 2026 Media, Communications & Entertainment Conference
- Crown Castle to Present at the Goldman Sachs 2026 Communacopia & Technology Conference
- Crown Castle to Present at Citi's 2026 Global TMT Conference
- Barclays upgrades American Tower and Crown Castle on valuation, growth catalysts
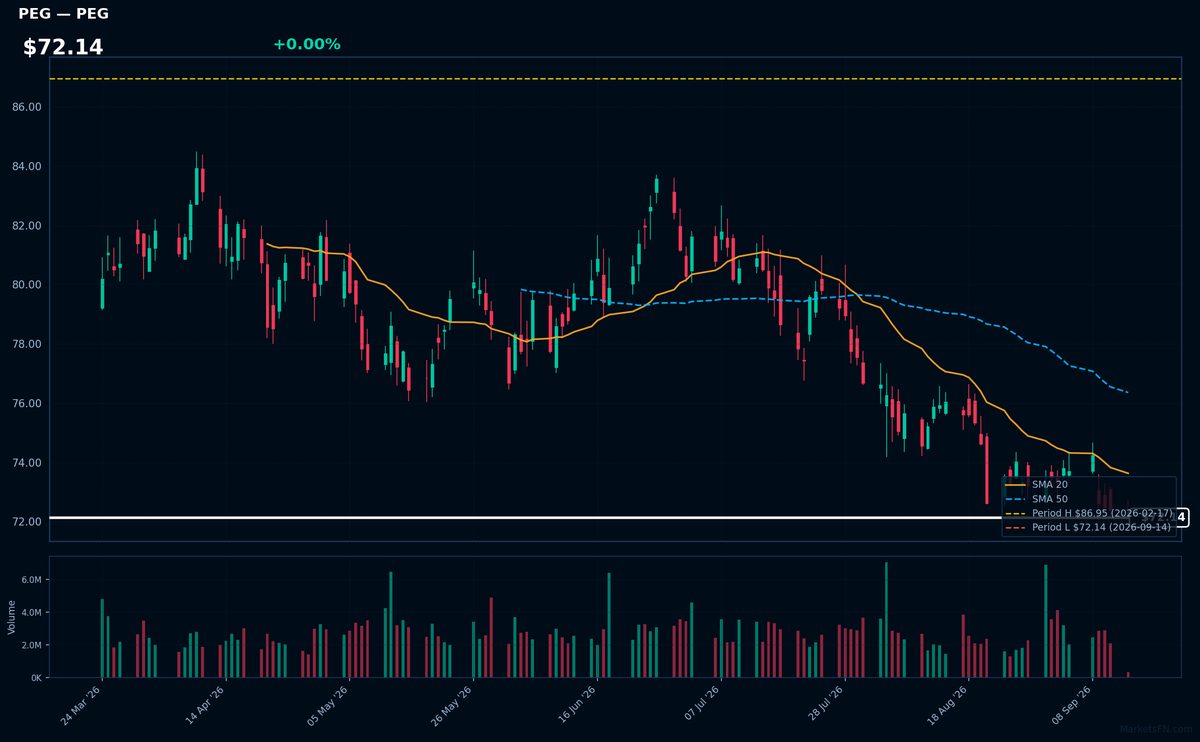
PEG | Public Service Enterprise Group Inc | Utilities | Price Last: $72.14 | % Realized: -13.06% | RSI: 33.2 | % above MA200: -9.5% | Trend: Below MA20, MA50, MA200
Public Service Enterprise Group Inc (PEG) is an energy company that generates and distributes electricity, providing essential services to a large customer base, making it an attractive investment for those seeking stable returns from a utility with a significant presence in the energy market.
PEG's current technical situation indicates a warning sign with an RSI(14) of 33.2, suggesting oversold conditions, and a bearish MA alignment (price < MA20 < MA50 < MA200), indicating a sustained downtrend, with the stock testing major support at its 52-Week low.
Related headlines
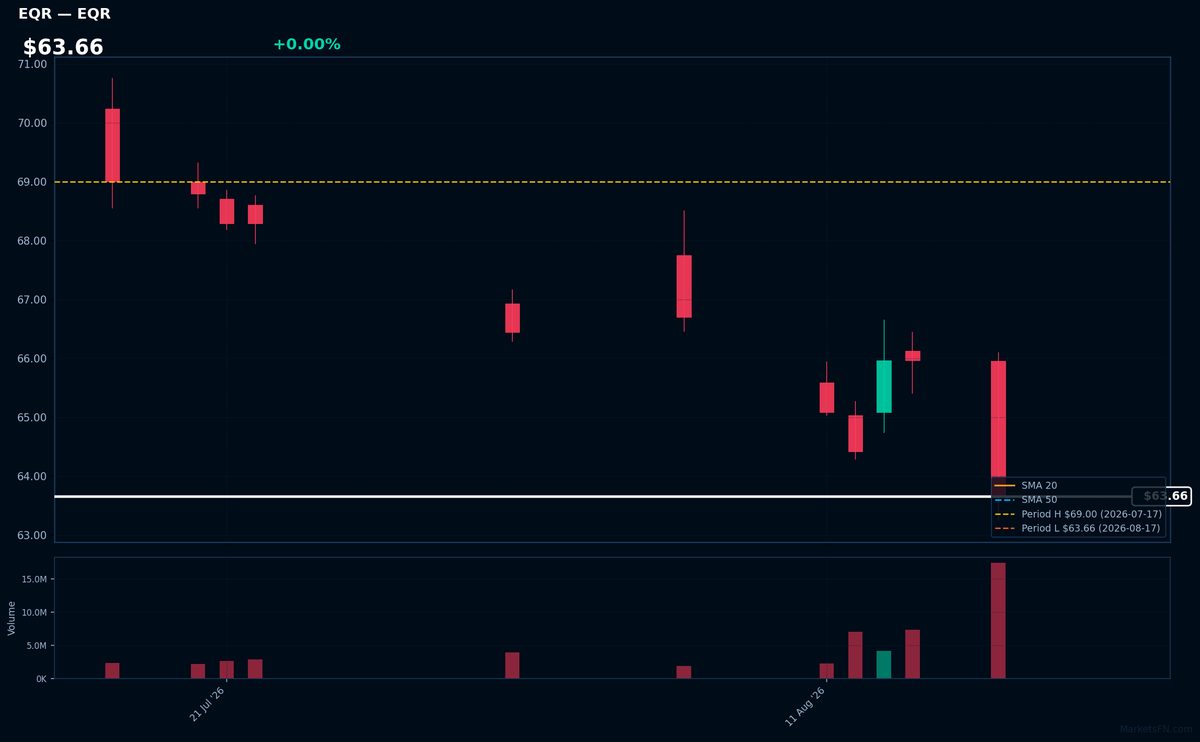
EQR | Equity Residential Properties Trust | Real Estate | Price Last: $63.66 | % Realized: -7.74% | RSI: 21.2 | % above MA200: — | Trend: —
Equity Residential Properties Trust is a real estate investment trust that owns and operates apartment properties. Investors should care because its performance reflects demand for rental housing and the overall health of the residential real estate market.
The stock's RSI(14) is 21.2, indicating oversold conditions, and is 0.0% above its 52-Week low, testing major support, with a -7.7% return over the 52-Week period, suggesting a warning sign.
Related headlines
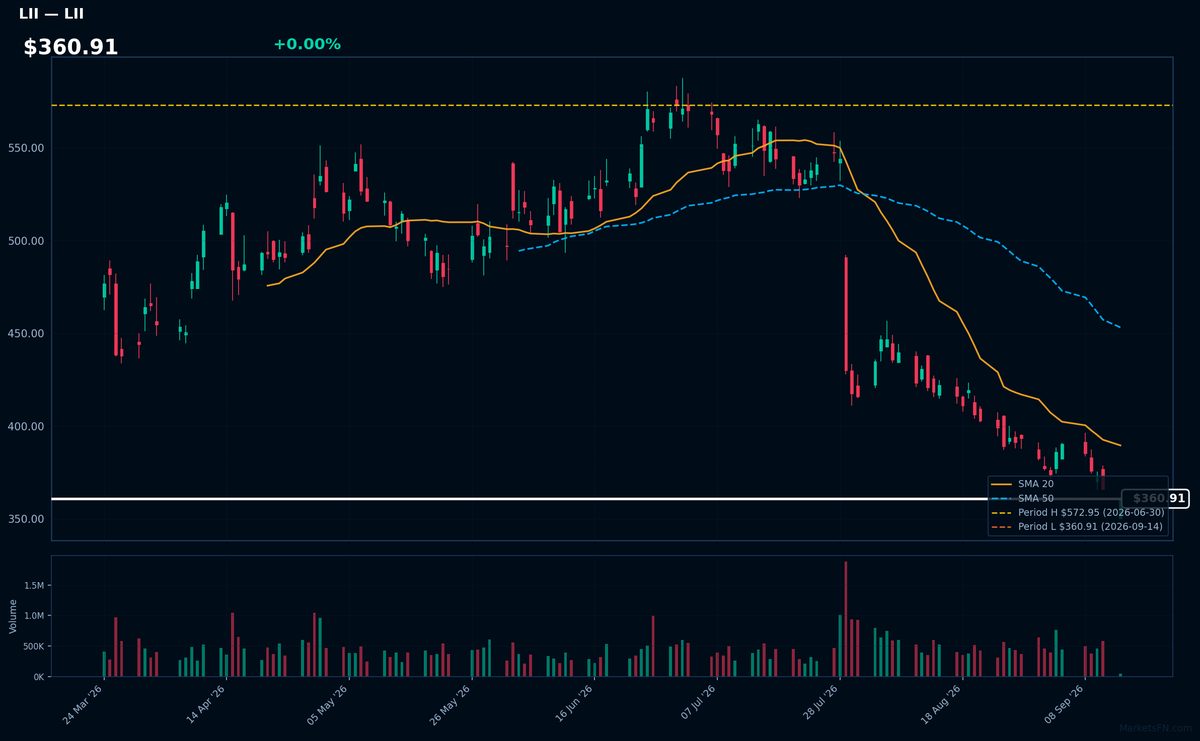
LII | Lennox International Inc | Industrials | Price Last: $360.91 | % Realized: -34.60% | RSI: 27.2 | % above MA200: -27.2% | Trend: Below MA20, MA50, MA200
Lennox International Inc is a leading manufacturer of climate control solutions, including HVAC systems for residential and commercial buildings. Investors should care because the company's performance is tied to the construction industry and energy efficiency trends.
The stock is in a sustained downtrend with price ($360.91) below MA20, MA50, and MA200. RSI(14) is 27.2, nearing oversold territory, and the stock is 0.0% above its 52-Week low, testing major support after a -34.6% 52-Week return.
Related headlines
Market Commentary
The S&P 500 stocks listed are currently trading near their 52-week extremes, with energy stocks CVX, COP, MPC, PSX, and VLO at new highs, while TDG, CCI, PEG, EQR, and LII are near their 52-week lows. This indicates a significant price movement, potentially driven by fundamental factors.
The concentration of energy stocks near 52-week highs may signal a strong sector rotation towards energy, potentially driven by macroeconomic themes such as supply and demand imbalances or geopolitical events. Conversely, the stocks near 52-week lows are from diverse sectors, including industrials (TDG, LII), real estate (EQR), and utilities (PEG, CCI), which may indicate sector-specific challenges or broader market concerns.
Key levels to watch include the sustainability of current price levels for these stocks. Potential catalysts could include earnings reports, industry trends, and macroeconomic developments. Investors should monitor these stocks closely, as a break from these extreme levels could signal a shift in market sentiment and potentially impact the broader S&P 500 index.
Methodology: All 503 S&P 500 constituents screened. 52-week high = highest daily close over the past 252 trading days (approx. 1 year). 52-week low = lowest daily close over the same period. Distance = (current price / extreme − 1) × 100. Technical indicators computed on up to 1 year of daily OHLCV data.
Disclaimer: For informational purposes only. Not investment advice. Past performance is not indicative of future results.

