S&P 500 52-Week Highs & Lows Radar: Block (XYZ), Equity Residential Properties Trust (EQR) and more
MarketsFN Team

S&P 500 52-Week Highs & Lows Radar: Block (XYZ), Equity Residential Properties Trust (EQR) and more
Screening all 503 S&P 500 constituents for stocks nearest to their 52-week high and their 52-week low. Data as of August 28, 2026. % Realized = 52-week total return.
Legend: RSI > 70 = overbought · RSI < 30 = oversold · Green % Realized = positive 52W return · Red = negative.
📈 Nearest to 52-Week High
Sectors represented: Technology (2), Communication Services (2), Financial (1)
| Ticker | Company | Sector | Price Last | % Realized | 52-Week High Date | RSI | % above MA200 | Trend |
|---|---|---|---|---|---|---|---|---|
| XYZ | Block Inc | Technology | $85.33 | +5.64% | 2026-08-28 | 61.9 | +24.9% | Above MA20, MA50, MA200 |
| EA | Electronic Arts, Inc | Communication Services | $209.70 | +0.38% | 2026-08-04 | — | — | — |
| STT | State Street Corp | Financial | $193.87 | +68.23% | 2026-08-28 | 62.6 | +31.8% | Above MA20, MA50, MA200 |
| GEN | Gen Digital Inc | Technology | $30.51 | +0.99% | 2026-08-28 | 68.3 | +24.5% | Above MA20, MA50, MA200 |
| NWSA | News Corp | Communication Services | $31.21 | +5.87% | 2026-08-28 | 71.3 | +19.6% | Above MA20, MA50, MA200 |
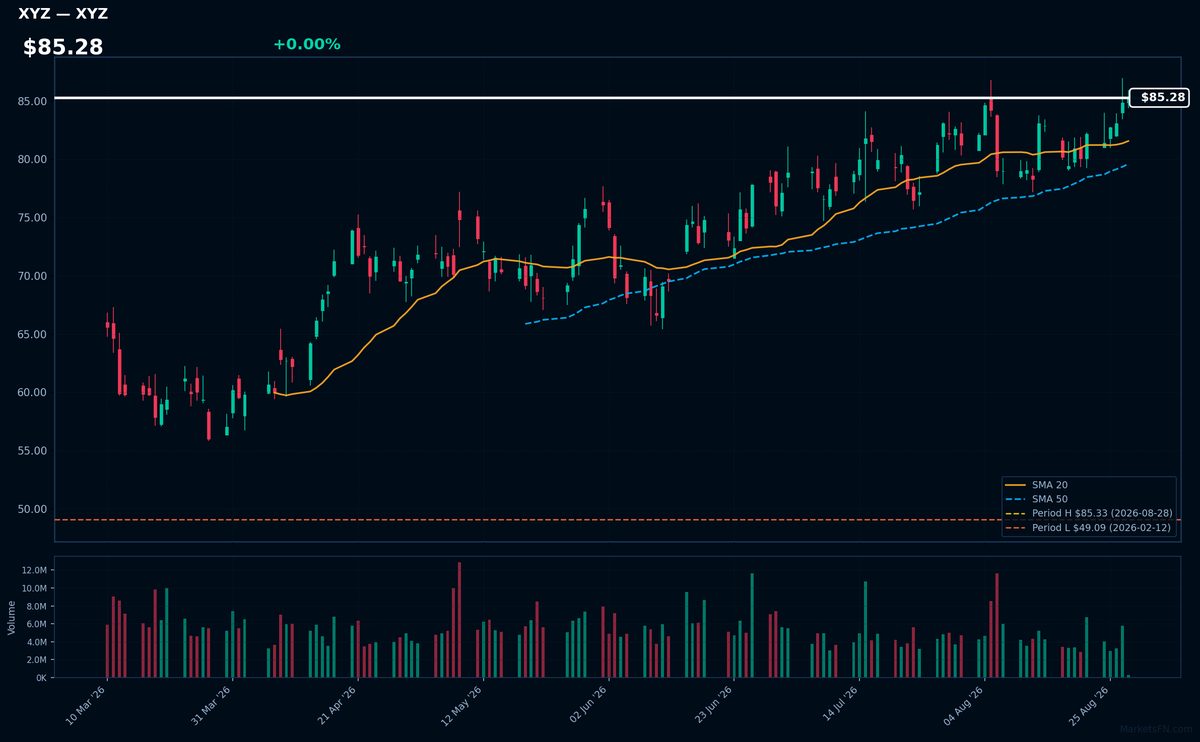
XYZ | Block Inc | Technology | Price Last: $85.33 | % Realized: +5.64% | RSI: 61.9 | % above MA200: +24.9% | Trend: Above MA20, MA50, MA200
Block Inc operates financial technology services, including payment processing and financial services for businesses and individuals. Investors should care about its innovative disruption in the financial services industry and its potential for growth.
Block Inc's current technical situation indicates sustained uptrend momentum with price > MA20 > MA50 > MA200, RSI(14) at 61.9, and 0.0% below its 52-Week high, suggesting potential for a breakout.
Related headlines
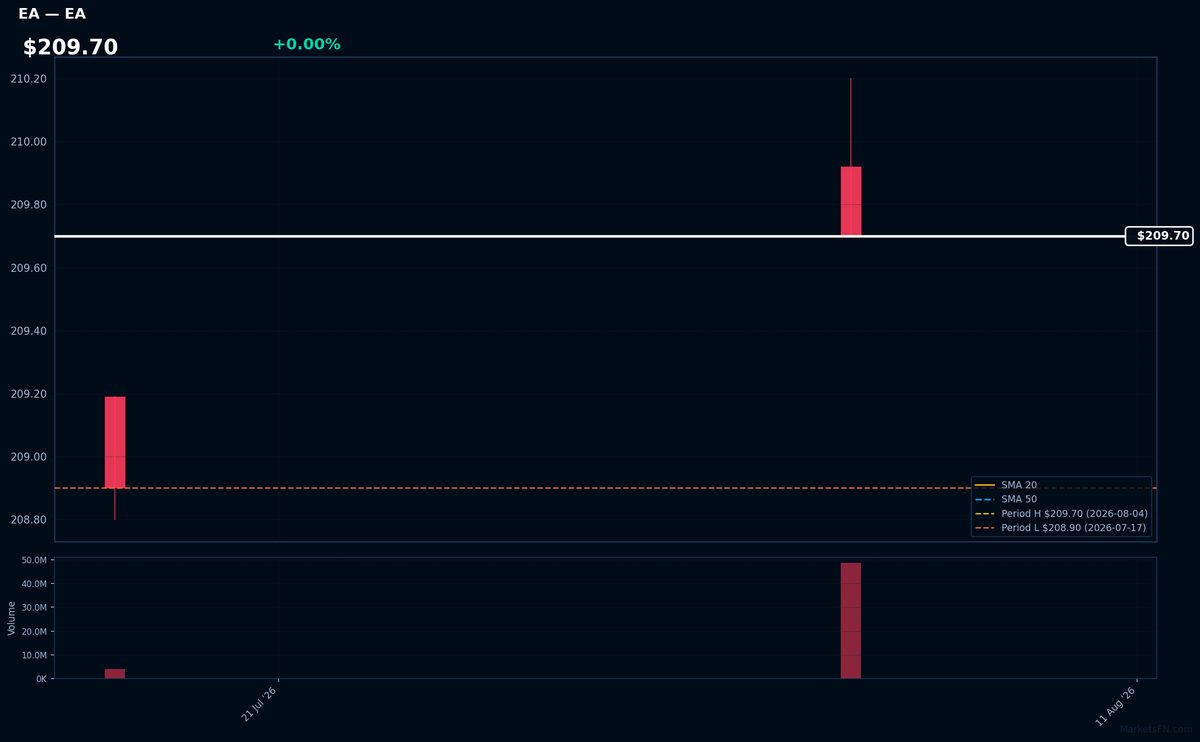
EA | Electronic Arts, Inc | Communication Services | Price Last: $209.70 | % Realized: +0.38% | RSI: — | % above MA200: — | Trend: —
Electronic Arts, Inc (EA) is a video game company that develops and publishes games such as FIFA, Madden NFL, and The Sims. Investors should care because its games have a large and dedicated player base, driving revenue.
The stock is near a potential breakout, 0.0% below its 52-Week high. The 52-Week return is 0.4%. MA alignment and RSI(14) data are unavailable for further technical assessment.
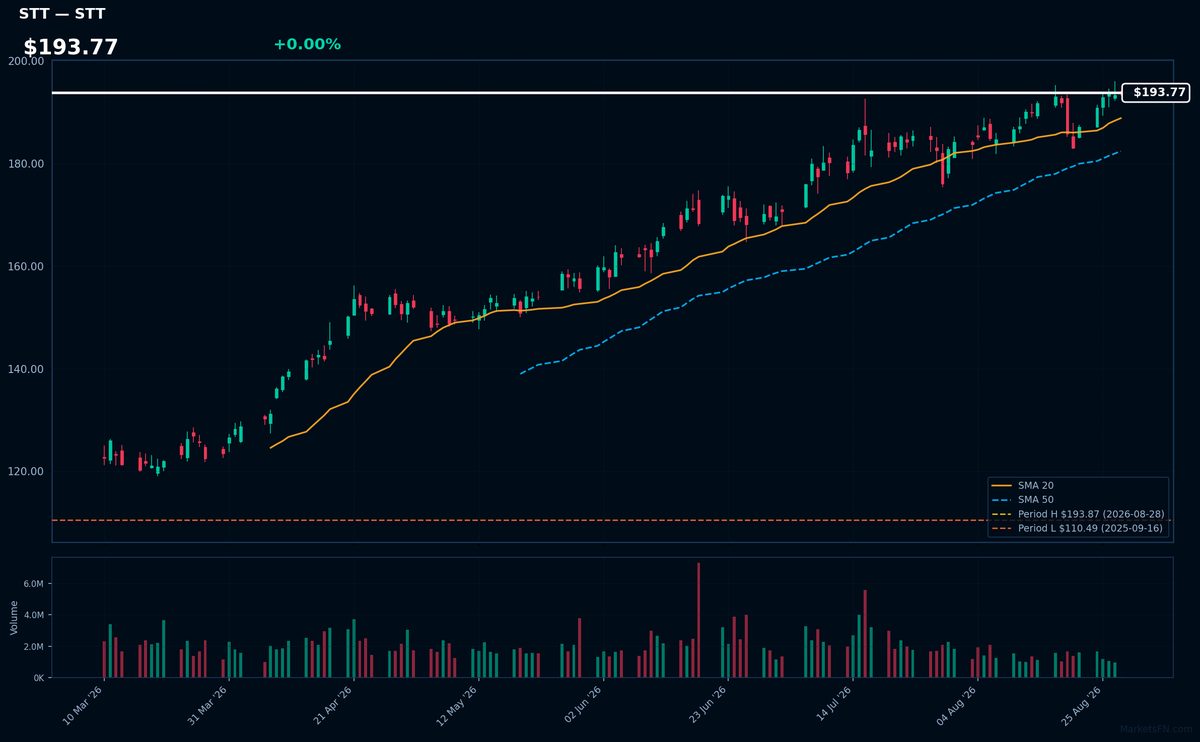
STT | State Street Corp | Financial | Price Last: $193.87 | % Realized: +68.23% | RSI: 62.6 | % above MA200: +31.8% | Trend: Above MA20, MA50, MA200
State Street Corp is a global financial services provider specializing in custody, trust, and investment management services for institutional investors. Investors care due to its critical role in facilitating global capital flows and its exposure to the growing asset management industry.
State Street Corp's current technical situation indicates sustained uptrend with price > MA20 > MA50 > MA200, RSI(14) at 62.6, and 0.0% below its 52-Week high, suggesting momentum with a potential breakout; the 68.2% 52-Week return reinforces this.
Related headlines
- New ETF Issuers Are Chipping Away at BlackRock, Vanguard, State Street Dominance
- State Street Corporation (NYSE: STT) Announces Remaining 2026 Quarterly Financial Results Release Dates and Conference Call Webcasts
- State Street to Expand Latin America Footprint with Santander CACEIS Latam Securities Services
- Biggest Debate at State Street Is Where Bessent Bond Metric Goes
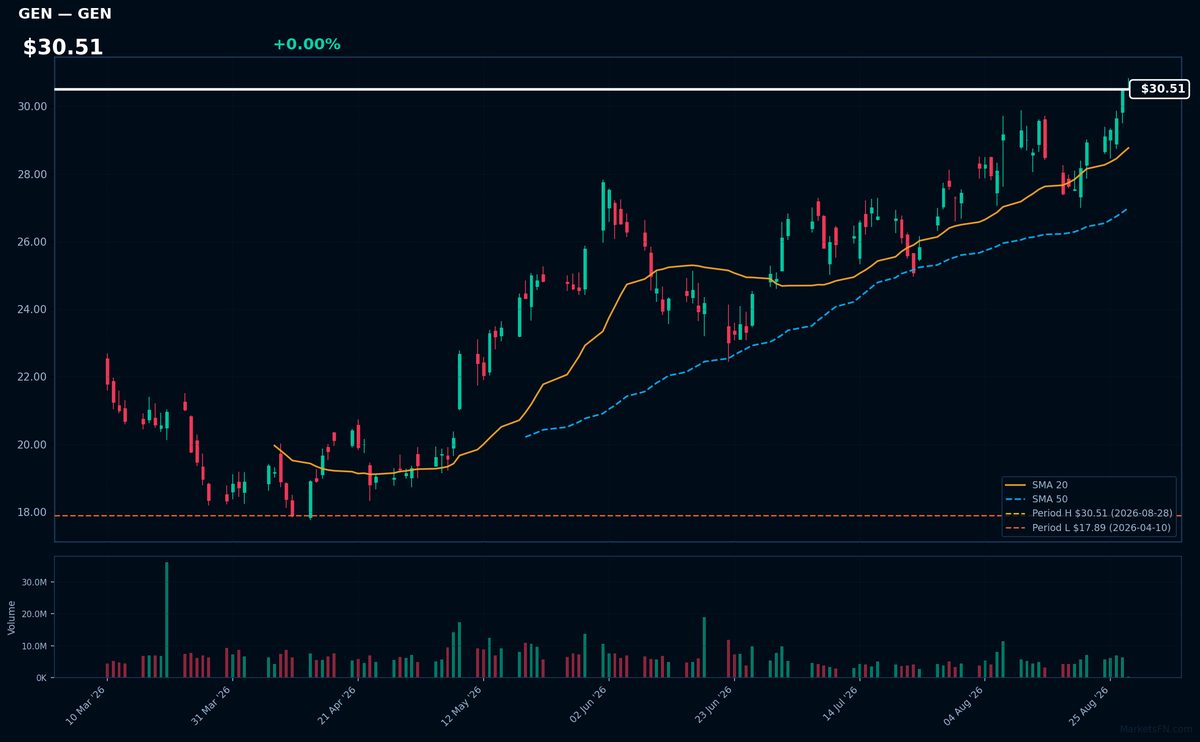
GEN | Gen Digital Inc | Technology | Price Last: $30.51 | % Realized: +0.99% | RSI: 68.3 | % above MA200: +24.5% | Trend: Above MA20, MA50, MA200
Gen Digital Inc's specific business operations and investor relevance are not detailed in the provided data; thus, a factual description cannot be given.
Gen Digital Inc is near a potential breakout at $30.51, 0.0% below its 52-Week high. The RSI(14) is 68.3, and MA alignment is bullish with price > MA20 > MA50 > MA200, indicating sustained uptrend and potential momentum.
Related headlines
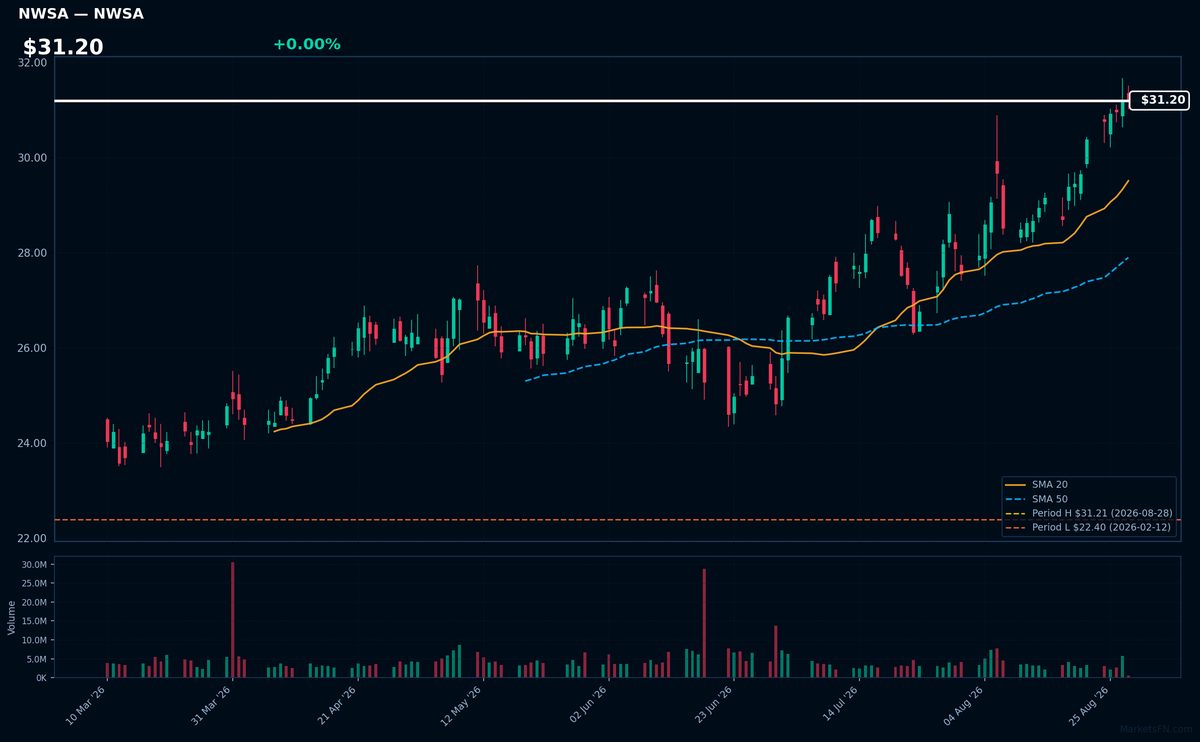
NWSA | News Corp | Communication Services | Price Last: $31.21 | % Realized: +5.87% | RSI: 71.3 | % above MA200: +19.6% | Trend: Above MA20, MA50, MA200
News Corp is a global media company owning prominent assets like Dow Jones, Wall Street Journal, and HarperCollins. Investors should care about its diversified revenue streams from publishing, digital media, and education, providing a relatively stable source of income amidst media industry disruption.
News Corp's RSI(14) is 71.3, indicating strong momentum as it nears its 52-Week high with 0.0% downside. The MA alignment (price > MA20 > MA50 > MA200) confirms a sustained uptrend, suggesting continued upward pressure with the stock at $31.20.
Related headlines
📉 Nearest to 52-Week Low
Sectors represented: Consumer Cyclical (2), Real Estate (1), Industrials (1), Communication Services (1)
| Ticker | Company | Sector | Price Last | % Realized | 52-Week Low Date | RSI | % above MA200 | Trend |
|---|---|---|---|---|---|---|---|---|
| EQR | Equity Residential Properties Trust | Real Estate | $63.66 | -7.74% | 2026-08-17 | 21.2 | — | — |
| PNR | Pentair plc | Industrials | $61.44 | -43.73% | 2026-08-28 | 36.1 | -29.3% | Below MA20, MA50, MA200 |
| APTV | Aptiv PLC | Consumer Cyclical | $45.01 | -43.95% | 2026-08-28 | 30.9 | -33.1% | Below MA20, MA50, MA200 |
| TJX | TJX Companies, Inc | Consumer Cyclical | $134.40 | -1.98% | 2026-08-27 | 19.9 | -13.3% | Below MA20, MA50, MA200 |
| EA | Electronic Arts, Inc | Communication Services | $209.70 | +0.38% | 2026-07-17 | — | — | — |
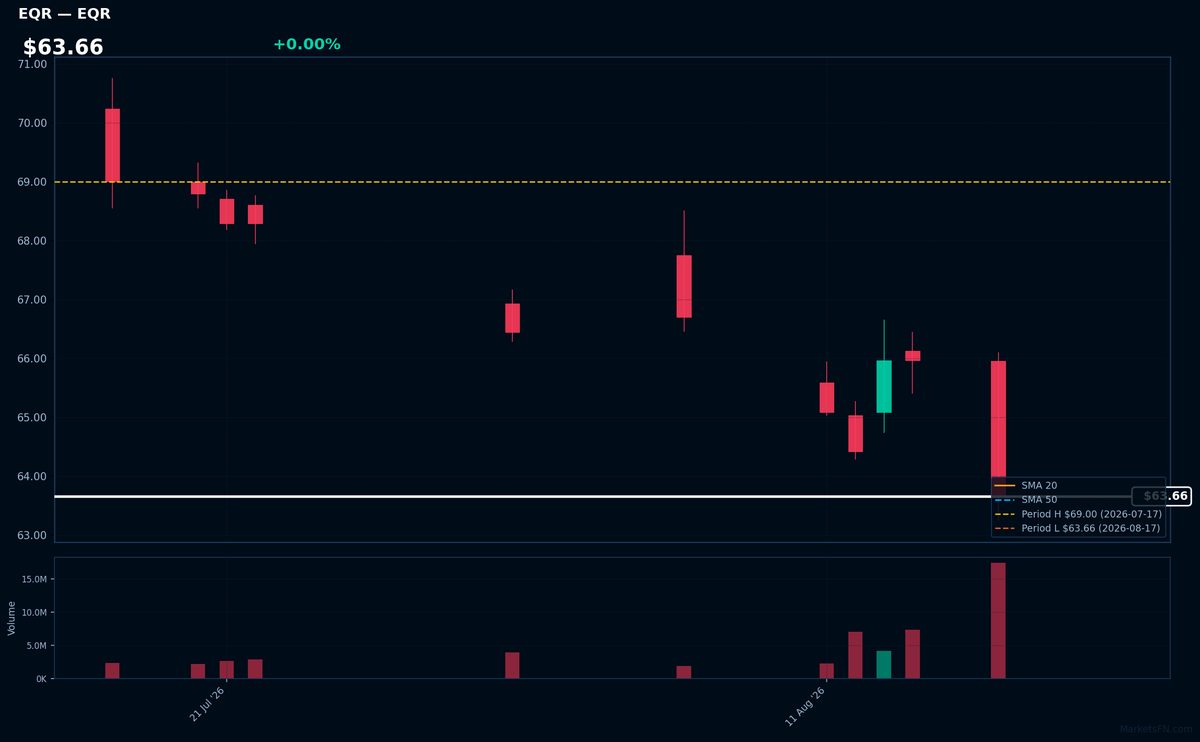
EQR | Equity Residential Properties Trust | Real Estate | Price Last: $63.66 | % Realized: -7.74% | RSI: 21.2 | % above MA200: — | Trend: —
Equity Residential Properties Trust is a real estate investment trust that owns and operates apartment properties, providing rental housing. Investors care about its performance as it reflects demand for rental housing and the company's ability to generate income.
The stock's RSI(14) is 21.2, indicating oversold conditions, and is 0.0% above its 52-Week low, testing major support. The 52-Week return is -7.7%. This is a warning sign, suggesting potential further downside.
Related headlines
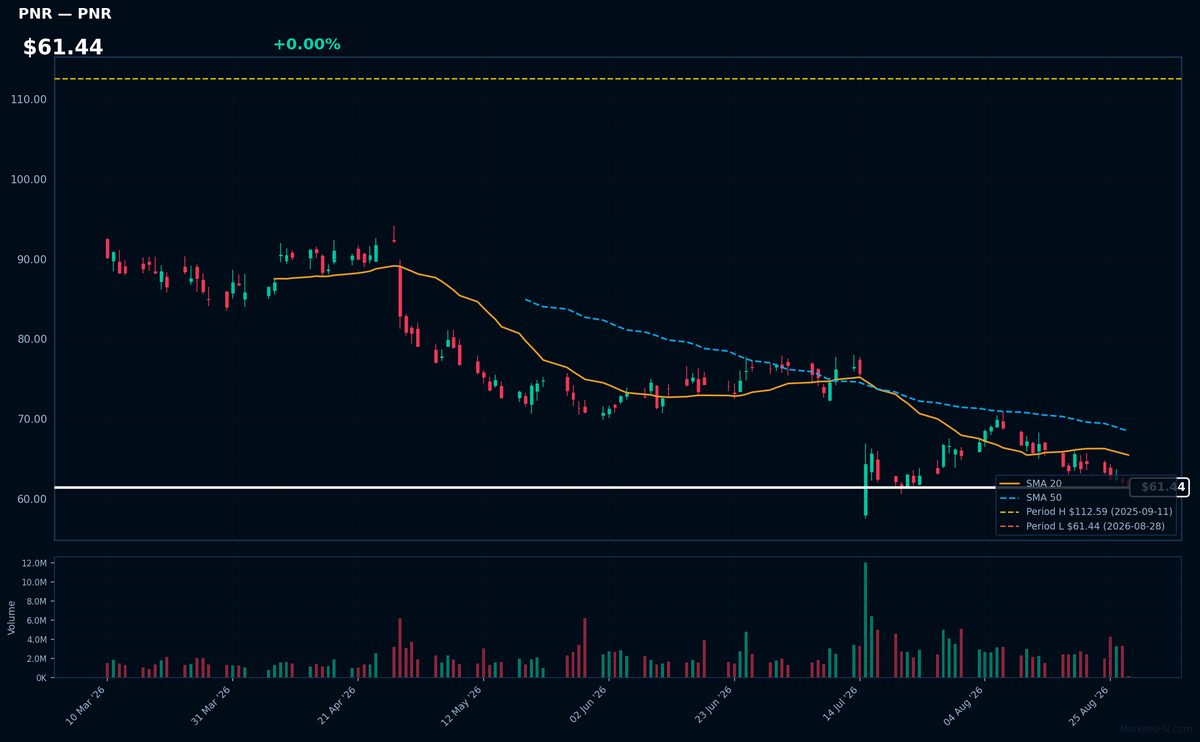
PNR | Pentair plc | Industrials | Price Last: $61.44 | % Realized: -43.73% | RSI: 36.1 | % above MA200: -29.3% | Trend: Below MA20, MA50, MA200
Pentair plc is a global water, fluid, and filtration solutions provider, serving industrial and commercial customers; investors should care about its performance as it indicates demand for water treatment and filtration technologies.
Pentair plc is testing major support at its 52-Week low, with RSI(14) at 36.1, indicating oversold conditions, and a bearish MA alignment (price < MA20 < MA50 < MA200), suggesting a sustained downtrend; the 52-Week return is -43.7%.
Related headlines
- Pentair Shares Plunge 15% After Undisclosed Pool Channel Destocking Comes to Light
- Pentair plc Sued for Securities Law Violations - Contact the DJS Law Group to Discuss Your Rights - PNR
- Did You Lose Money Investing in Pentair plc.? Robbins LLP Urges Investors with Significant Losses to Contact the Firm for Information About Their Rights Against PNR
- Kaplan Fox Encourages Pentair plc (PNR) Investors with Losses to Contact the Firm Before October 2, 2026
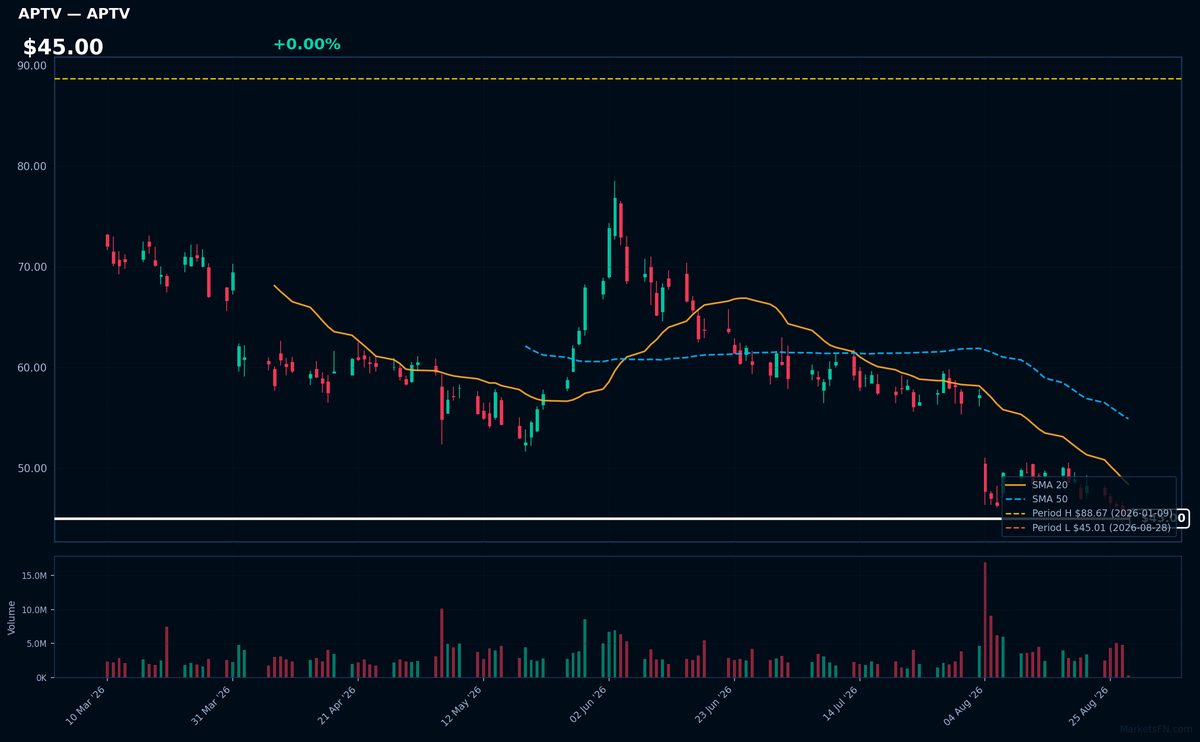
APTV | Aptiv PLC | Consumer Cyclical | Price Last: $45.01 | % Realized: -43.95% | RSI: 30.9 | % above MA200: -33.1% | Trend: Below MA20, MA50, MA200
Aptiv PLC is a global technology company that designs, develops, and manufactures vehicle architecture and software solutions for the automotive industry, enabling advanced safety, connectivity, and autonomous driving features.
Aptiv PLC's technicals indicate a sustained downtrend with price ($45.00) below MA20, MA50, and MA200. The RSI(14) is 30.9, nearing oversold territory, and the stock is 0.0% above its 52-Week low, testing major support after a -43.9% 52-Week return.
Related headlines
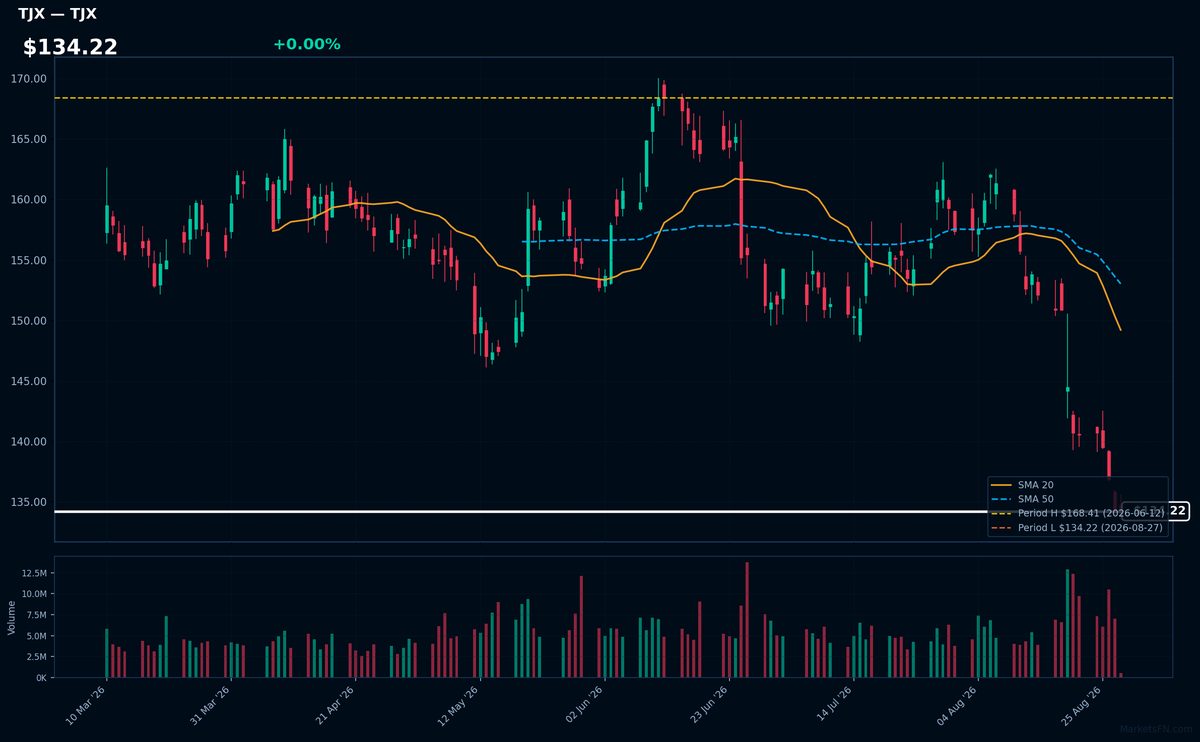
TJX | TJX Companies, Inc | Consumer Cyclical | Price Last: $134.40 | % Realized: -1.98% | RSI: 19.9 | % above MA200: -13.3% | Trend: Below MA20, MA50, MA200
TJX Companies, Inc operates as an off-price retailer, selling brand-name clothing, home goods, and accessories at discounted prices. Investors should care about its ability to maintain margins and sales growth amidst competitive pressures.
TJX is in a sustained downtrend with price < MA20 < MA50 < MA200, RSI(14) at 19.9, near its 52-Week low. This indicates a warning sign of potential further downside, as the stock tests major support.
Related headlines
EA | Electronic Arts, Inc | Communication Services | Price Last: $209.70 | % Realized: +0.38% | RSI: — | % above MA200: — | Trend: —
Electronic Arts, Inc (EA) is a video game company that develops and publishes games such as FIFA, Madden NFL, and The Sims. Investors should care because its games have a large and dedicated player base, driving revenue.
The stock is near a potential breakout, 0.0% below its 52-Week high. The 52-Week return is 0.4%. MA alignment and RSI(14) data are unavailable for further technical assessment.
Market Commentary
The S&P 500 stocks near 52-week extremes signal a potential shift in market sentiment. Stocks like XYZ, EA, STT, GEN, and NWSA are at 52-week highs, while EQR, PNR, APTV, TJX, and EA are near 52-week lows. This dichotomy may indicate sector rotation and changing investor preferences.
The presence of EA at both 52-week high and near low lists is notable. Stocks at 52-week highs are from diverse sectors, including technology (GEN), finance (STT), and media (NWSA, EA). Those near lows are from real estate (EQR), industrials (PNR), and consumer discretionary (TJX, APTV). This mix suggests various macro themes are at play, potentially related to interest rates, consumer spending, and economic growth.
Key levels to watch include the 52-week extremes for these stocks. Potential catalysts could be earnings reports, macroeconomic data releases, or sector-specific news. For instance, EA's proximity to both a high and a low may indicate volatility ahead of its earnings report or new game releases. Monitoring these levels and catalysts will be crucial for understanding the direction of these stocks and the broader market.
Methodology: All 503 S&P 500 constituents screened. 52-week high = highest daily close over the past 252 trading days (approx. 1 year). 52-week low = lowest daily close over the same period. Distance = (current price / extreme − 1) × 100. Technical indicators computed on up to 1 year of daily OHLCV data.
Disclaimer: For informational purposes only. Not investment advice. Past performance is not indicative of future results.