S&P 500 52-Week Highs & Lows Radar: Apple (AAPL), D.R. Horton (DHI) and more
MarketsFN Team

Screening all 503 S&P 500 constituents for stocks nearest to their 52-week high and their 52-week low. Data as of October 14, 2026. % Realized = 52-week total return.
Legend: RSI > 70 = overbought · RSI < 30 = oversold · Green % Realized = positive 52W return · Red = negative.
📈 Nearest to 52-Week High
Sectors represented: Energy (3), Technology (1), Healthcare (1)
| Ticker | Company | Sector | Price Last | % Realized | 52-Week High Date | RSI | % above MA200 | Trend |
|---|---|---|---|---|---|---|---|---|
| AAPL | Apple Inc | Technology | $345.69 | +39.52% | 2026-10-14 | 64.5 | +18.5% | Above MA20, MA50, MA200 |
| XOM | Exxon Mobil Corp | Energy | $175.01 | +55.85% | 2026-10-14 | 72.9 | +15.8% | Above MA20, MA50, MA200 |
| CVX | Chevron Corp | Energy | $219.85 | +44.27% | 2026-10-14 | 69.3 | +16.2% | Above MA20, MA50, MA200 |
| PFE | Pfizer Inc | Healthcare | $29.08 | +18.62% | 2026-10-14 | 65.2 | +9.7% | Above MA20, MA50, MA200 |
| COP | Conoco Phillips | Energy | $141.41 | +60.38% | 2026-10-14 | 70.2 | +19.6% | Above MA20, MA50, MA200 |
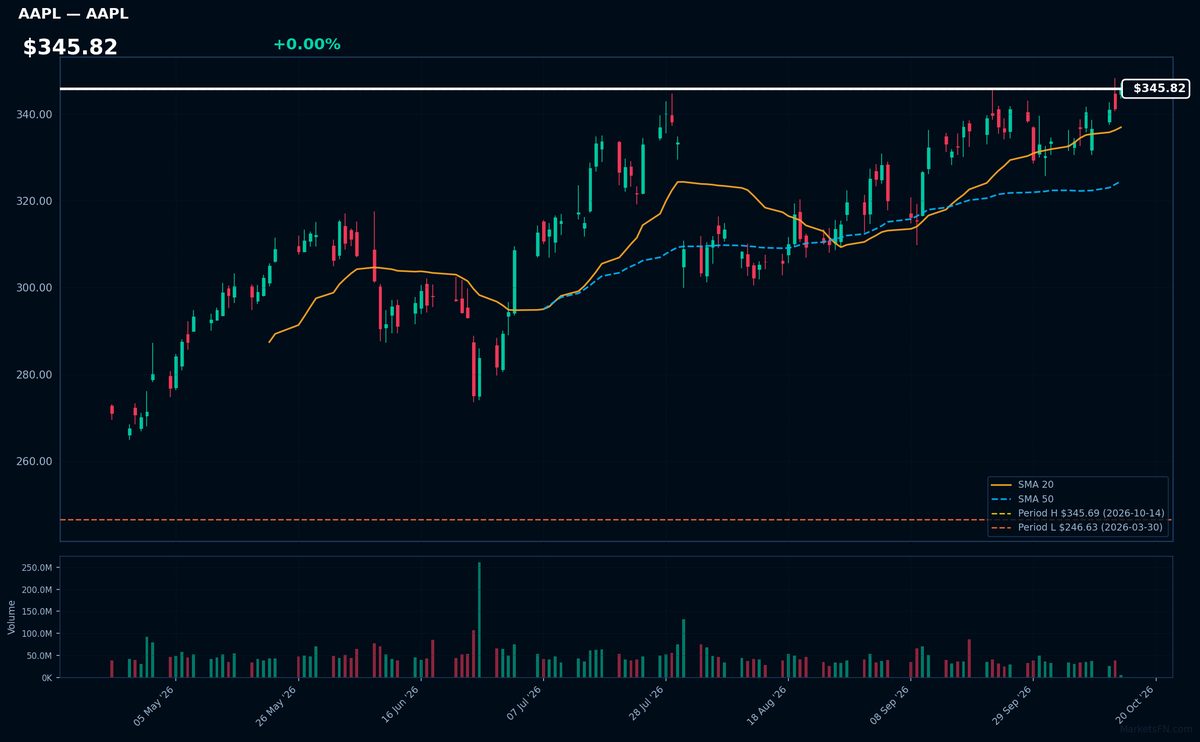
AAPL | Apple Inc | Technology | Price Last: $345.69 | % Realized: +39.52% | RSI: 64.5 | % above MA200: +18.5% | Trend: Above MA20, MA50, MA200
Apple Inc designs premium consumer electronics (iPhone, Mac, iPad), operates services (App Store, iCloud), and leads wearables (Apple Watch, AirPods). Investors care due to its ecosystem lock-in, pricing power, and $39.5B annual R&D driving iterative hardware upgrades and services growth.
Technically bullish: $345.82 price shows sustained uptrend (MA20>MA50>MA200) with RSI(14) at 64.5 indicating strong momentum. Stock tests 52-week high (0.0% below) — watch for breakout confirmation or overbought reversal.
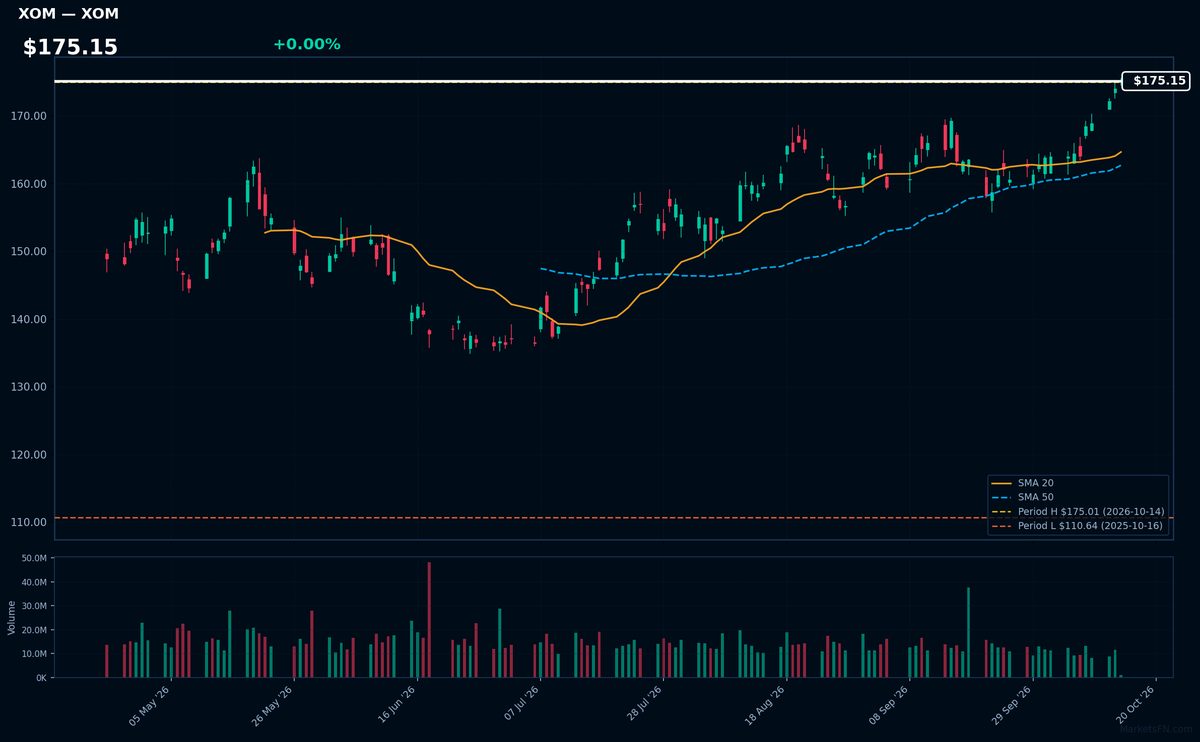
XOM | Exxon Mobil Corp | Energy | Price Last: $175.01 | % Realized: +55.85% | RSI: 72.9 | % above MA200: +15.8% | Trend: Above MA20, MA50, MA200
Exxon Mobil Corp (XOM) explores, produces, and sells crude oil, natural gas, and petroleum products globally. Investors care because its integrated energy model provides stability across commodity cycles, and its 55.9% 52-week return reflects both operational scale and sensitivity to oil prices.
Technically, XOM shows strong momentum with a bullish MA alignment (price > MA20 > MA50 > MA200) and overbought RSI(14) at 72.9. At 0.0% below its 52-week high, it tests resistance but risks a pullback given extreme RSI levels.
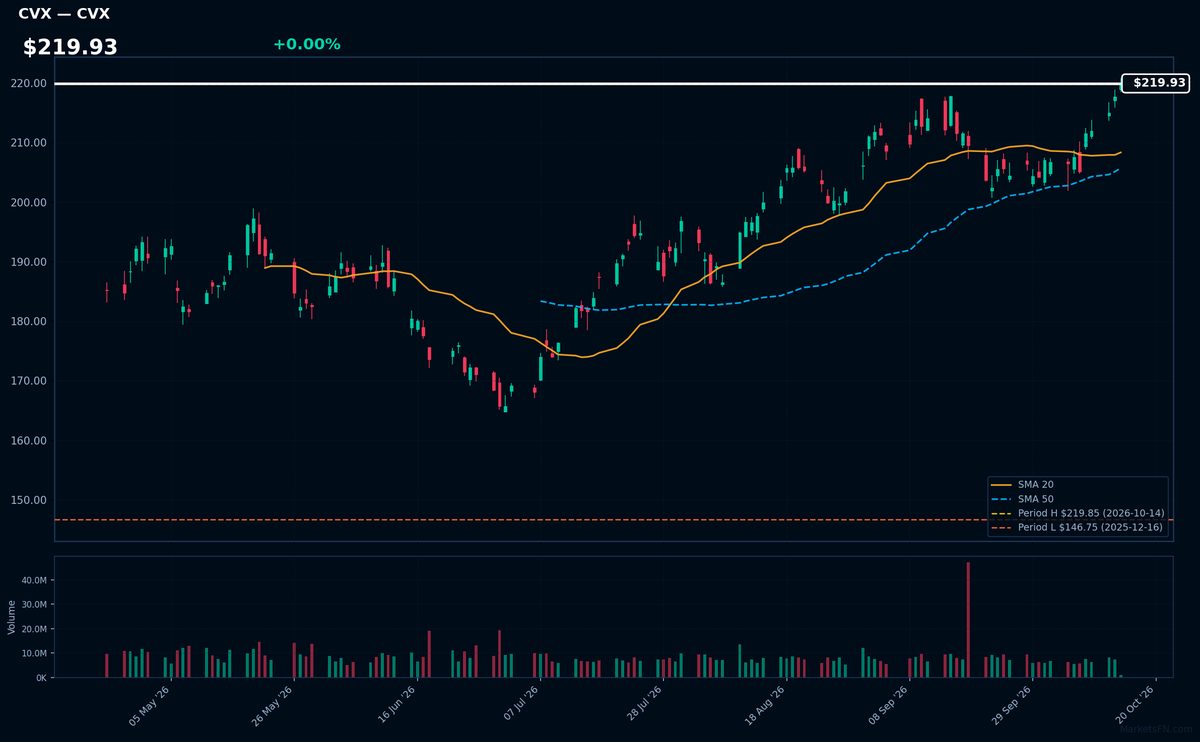
CVX | Chevron Corp | Energy | Price Last: $219.85 | % Realized: +44.27% | RSI: 69.3 | % above MA200: +16.2% | Trend: Above MA20, MA50, MA200
Chevron Corp (CVX) is an integrated energy major with upstream oil/gas production and downstream refining/marketing operations. Investors care for its dividend reliability (3.4% yield), global LNG exposure, and Permian Basin dominance where it's the top acreage holder.
Technically bullish with RSI(14) at 69.3 (near overbought) and sustained uptrend (price > MA20 > MA50 > MA200). The stock tests 52-week highs (+44.3% YoY), suggesting momentum but warranting caution at extended levels.
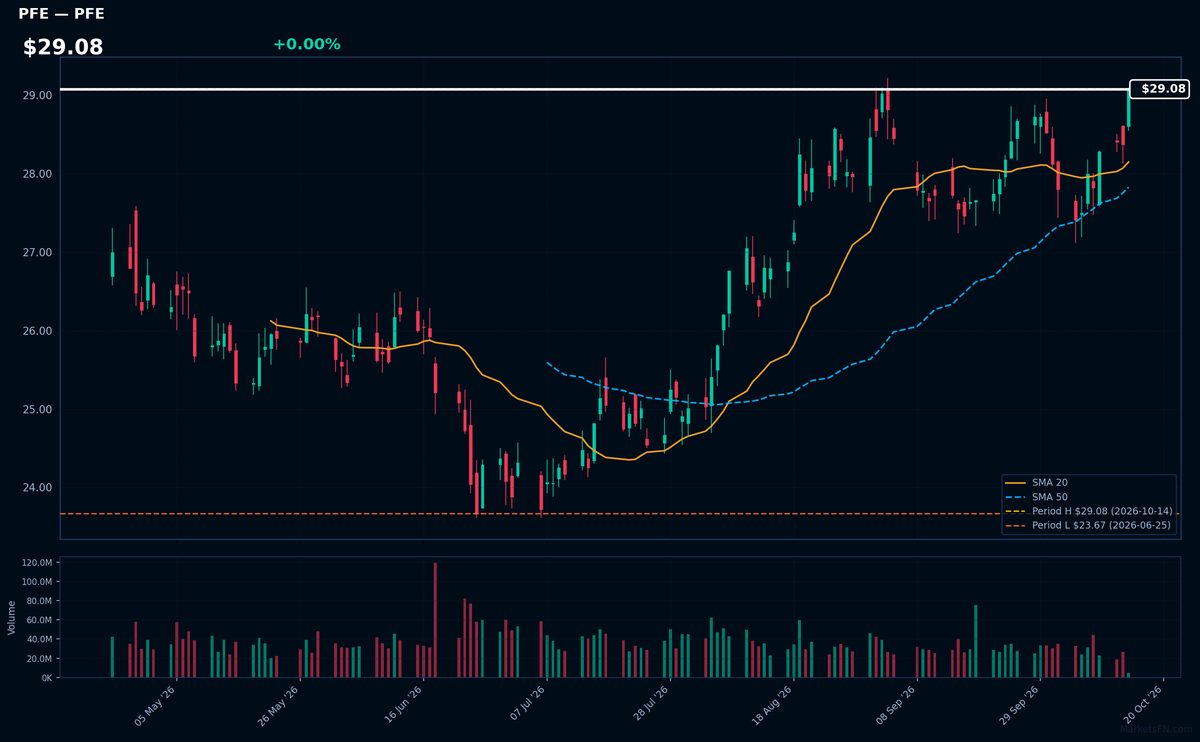
PFE | Pfizer Inc | Healthcare | Price Last: $29.08 | % Realized: +18.62% | RSI: 65.2 | % above MA200: +9.7% | Trend: Above MA20, MA50, MA200
Pfizer develops and commercializes biopharmaceuticals including COVID-19 vaccines (Comirnaty), antiviral Paxlovid, and oncology drugs like Ibrance. Investors watch its pipeline execution and patent cliffs as key revenue drivers in a volatile post-pandemic market.
Technically bullish with price at $29.08 (0.0% below 52W high), RSI(14) at 65.2 (approaching overbought), and sustained uptrend (price > MA20 > MA50 > MA200). 18.6% 52W return suggests momentum but warrants caution near resistance.
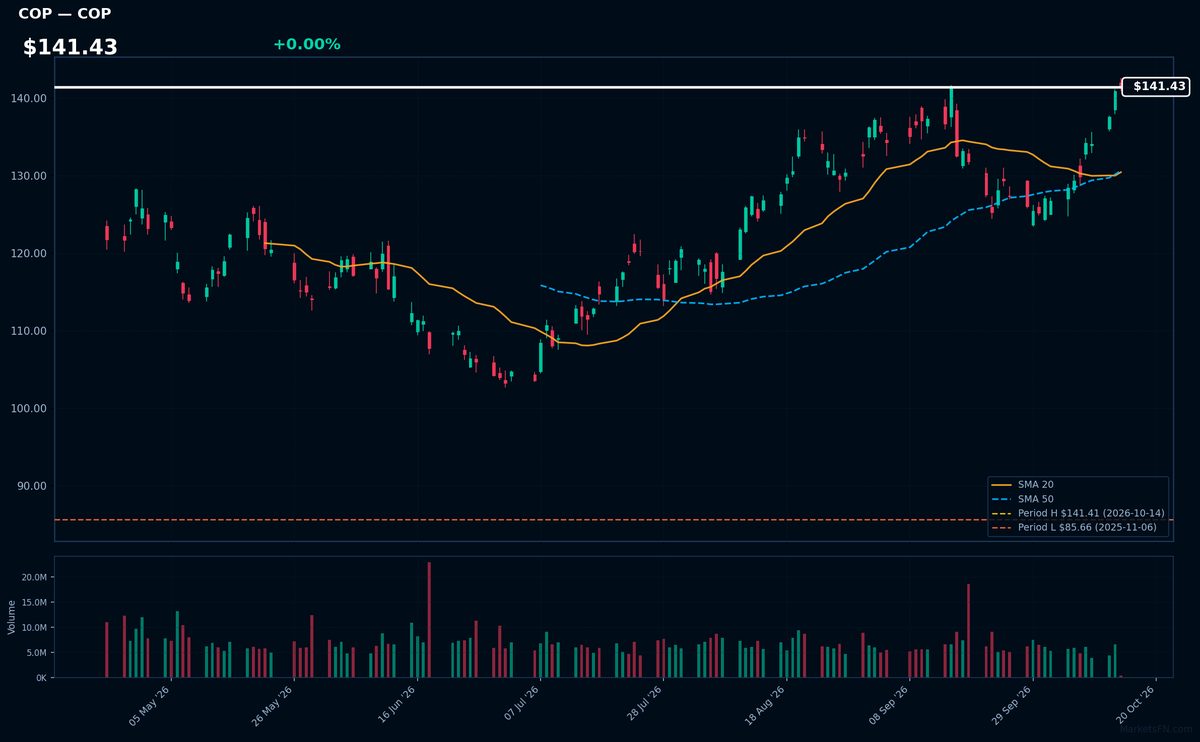
COP | Conoco Phillips | Energy | Price Last: $141.41 | % Realized: +60.38% | RSI: 70.2 | % above MA200: +19.6% | Trend: Above MA20, MA50, MA200
ConocoPhillips explores and produces crude oil/natural gas globally, with major US shale operations. Investors care because its 60.4% 52-week return reflects direct leverage to energy prices and disciplined capital returns, making it a pure-play energy stock with volatile upside potential.
Technically overbought (RSI 70.2) near 52-week highs, with mixed MA alignment (above MA20/MA50/MA200). This suggests stretched momentum—watch for either breakout confirmation or mean reversion.
📉 Nearest to 52-Week Low
Sectors represented: Consumer Cyclical (2), Industrials (1), Communication Services (1), Basic Materials (1)
| Ticker | Company | Sector | Price Last | % Realized | 52-Week Low Date | RSI | % above MA200 | Trend |
|---|---|---|---|---|---|---|---|---|
| DHI | D.R. Horton Inc | Consumer Cyclical | $131.26 | -16.26% | 2026-10-14 | 38.1 | -11.3% | Below MA20, MA50, MA200 |
| CPRT | Copart, Inc | Industrials | $26.07 | -41.77% | 2026-10-14 | 31.3 | -21.0% | Below MA20, MA50, MA200 |
| TKO | TKO Group Holdings Inc | Communication Services | $171.41 | -9.77% | 2026-10-14 | 34.6 | -12.1% | Below MA20, MA50, MA200 |
| MLM | Martin Marietta Materials, Inc | Basic Materials | $471.68 | -28.19% | 2026-10-14 | 35.0 | -19.1% | Below MA20, MA50, MA200 |
| LEN | Lennar Corp | Consumer Cyclical | $72.61 | -40.60% | 2026-10-14 | 35.2 | -21.9% | Below MA20, MA50, MA200 |
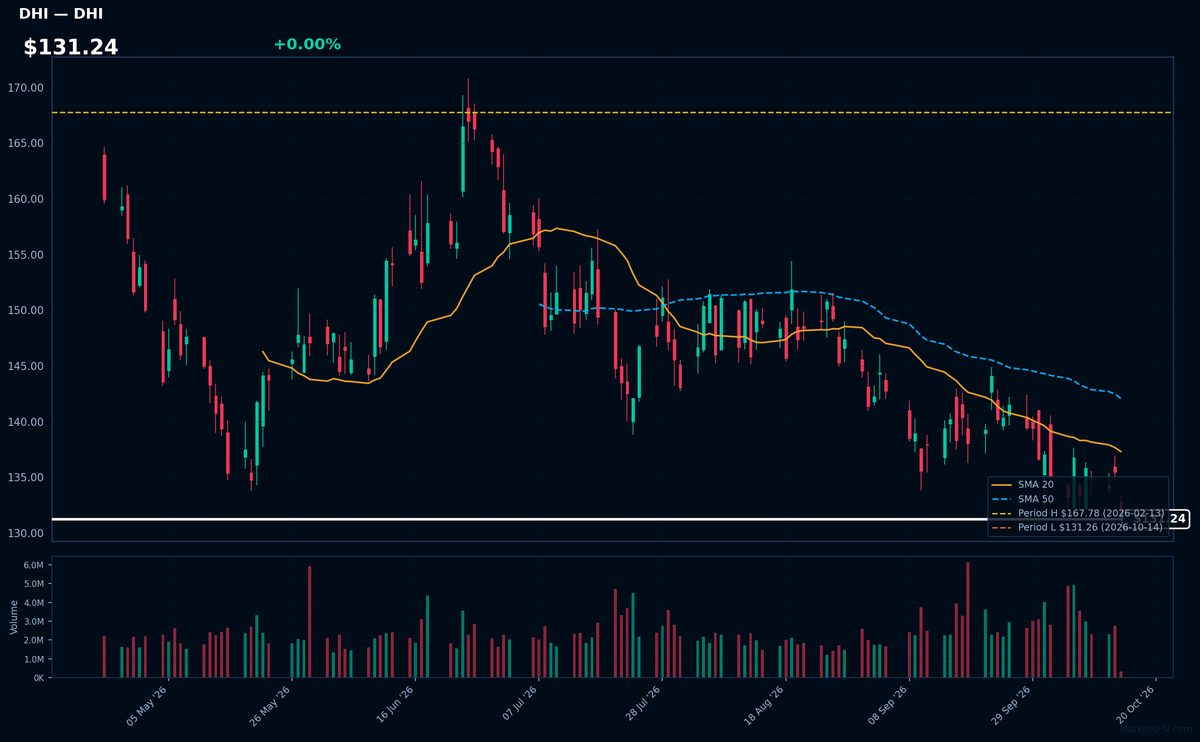
DHI | D.R. Horton Inc | Consumer Cyclical | Price Last: $131.26 | % Realized: -16.26% | RSI: 38.1 | % above MA200: -11.3% | Trend: Below MA20, MA50, MA200
D.R. Horton is the largest U.S. homebuilder by volume, specializing in affordable single-family homes. Investors watch it as a cyclical play on housing demand, mortgage rates, and construction costs—key drivers of earnings in this capital-intensive business.
Technically concerning: RSI(14) at 38.1 shows weak momentum, with bearish MA alignment (price < MA20 < MA50 < MA200) and the stock testing its 52-week low after a -16.3% decline. A breakdown risk looms.
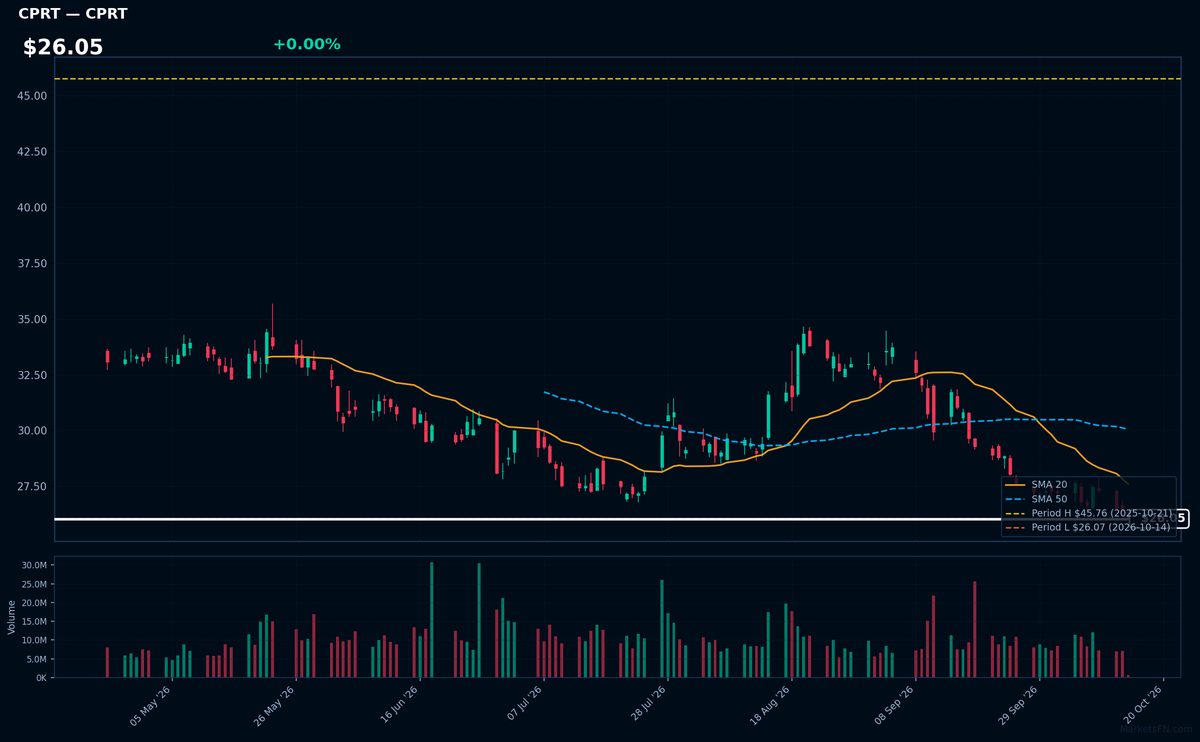
CPRT | Copart, Inc | Industrials | Price Last: $26.07 | % Realized: -41.77% | RSI: 31.3 | % above MA200: -21.0% | Trend: Below MA20, MA50, MA200
Copart operates an online vehicle auction platform, specializing in salvage and used cars for insurers, dealers, and individuals. Investors care because its asset-light model dominates the $5B+ North American salvage market with high margins and recurring revenue from insurance partnerships.
Technically dire: RSI(14) at 31.3 shows oversold conditions amid a sustained downtrend (price < MA20 < MA50 < MA200). Trading just 0.0% above 52-week lows after -41.8% annual decline signals severe weakness, testing critical support.
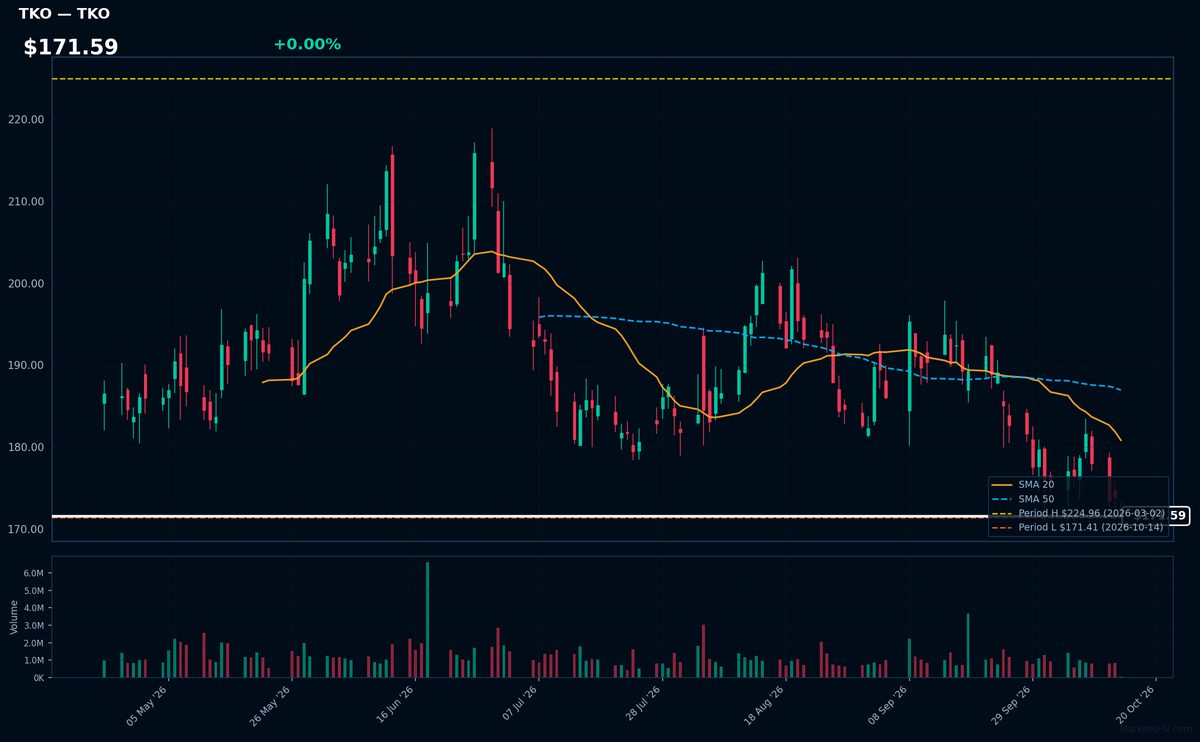
TKO | TKO Group Holdings Inc | Communication Services | Price Last: $171.41 | % Realized: -9.77% | RSI: 34.6 | % above MA200: -12.1% | Trend: Below MA20, MA50, MA200
TKO Group Holdings operates UFC and WWE, dominating combat sports and entertainment with pay-per-view events, media rights, and merchandising. Investors care for its monopolistic position in live fighting sports and recurring revenue from long-term broadcasting contracts.
Technically concerning: RSI(34.6) nears oversold amid bearish MA alignment (price
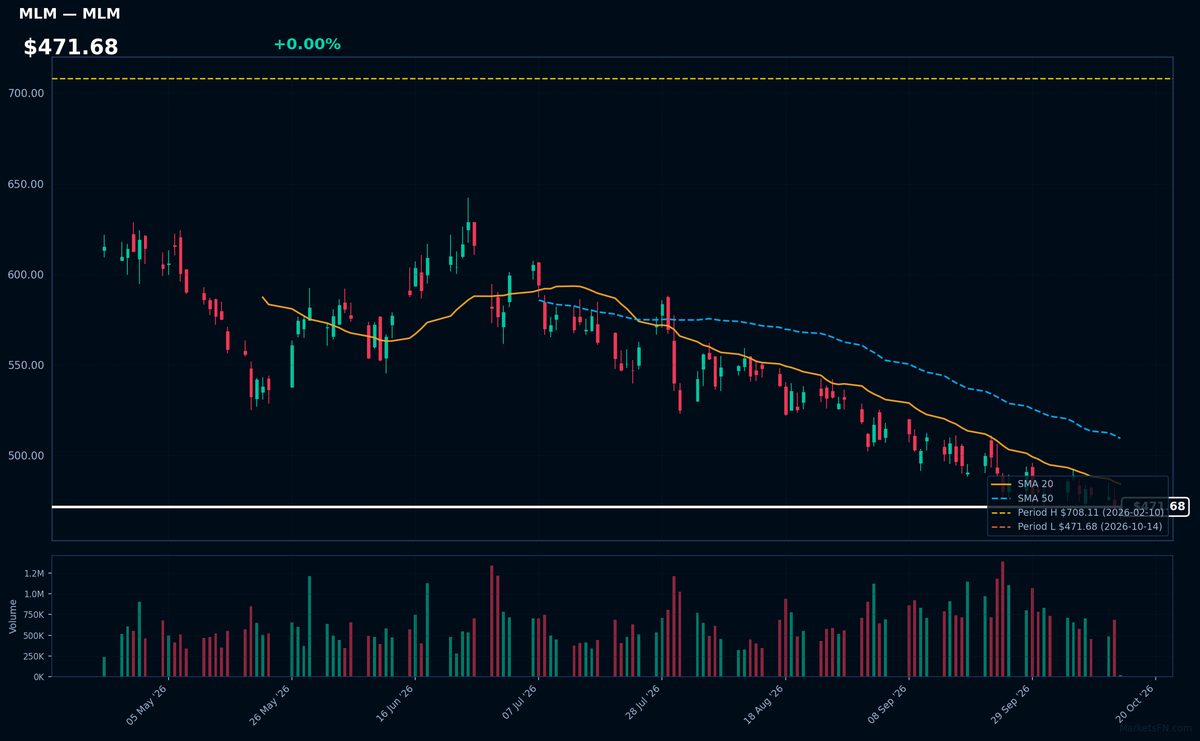
MLM | Martin Marietta Materials, Inc | Basic Materials | Price Last: $471.68 | % Realized: -28.19% | RSI: 35.0 | % above MA200: -19.1% | Trend: Below MA20, MA50, MA200
Martin Marietta Materials supplies construction aggregates (crushed stone, sand, gravel) and heavy building materials to infrastructure and commercial projects. Investors watch it as a cyclical play on infrastructure spending and non-residential construction activity in North America.
Technically concerning: RSI(14) at 35.0 shows near-oversold conditions, but bearish MA alignment (price < MA20 < MA50 < MA200) confirms sustained downtrend. Stock tests 52-week low after -28.2% annual decline — warning sign absent fundamental catalysts.
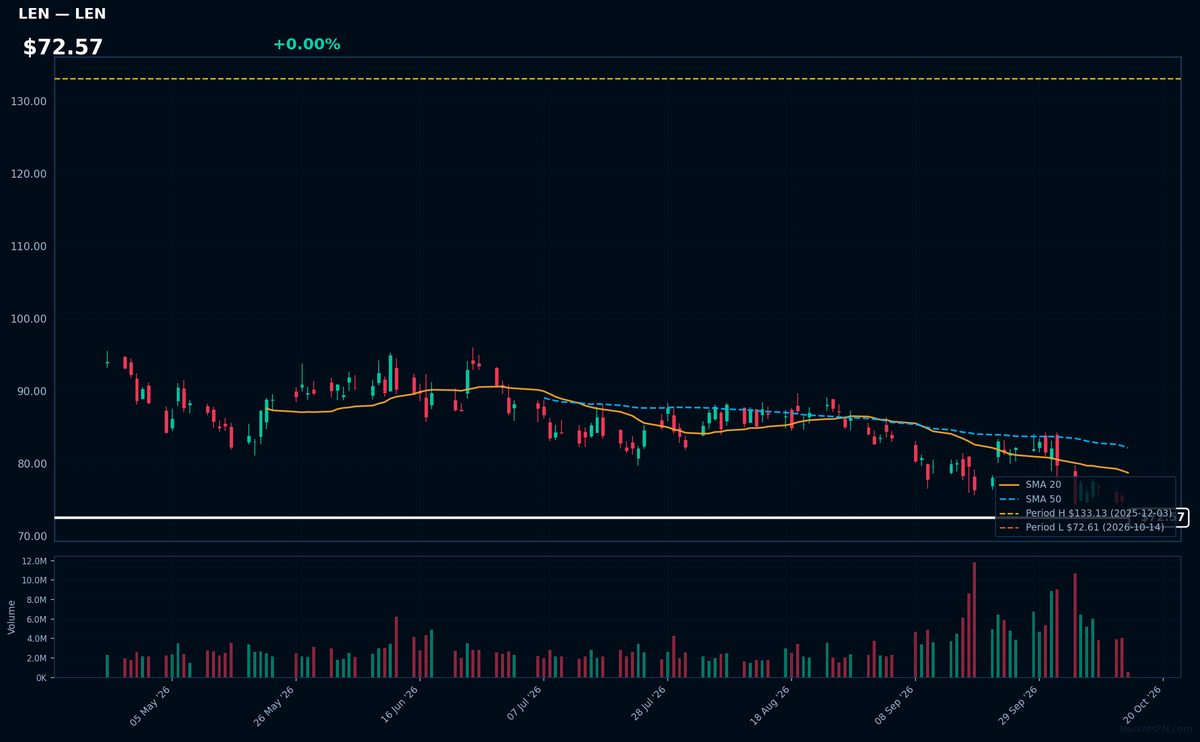
LEN | Lennar Corp | Consumer Cyclical | Price Last: $72.61 | % Realized: -40.60% | RSI: 35.2 | % above MA200: -21.9% | Trend: Below MA20, MA50, MA200
Lennar Corp is a leading US homebuilder specializing in single-family and multifamily residential construction, serving first-time, move-up, and active adult buyers. Investors monitor LEN as a cyclical housing market bellwether sensitive to mortgage rates and employment trends.
LEN shows extreme technical weakness: RSI(14) at 35.2 (nearing oversold), with sustained downtrend (price < MA20 < MA50 < MA200) and hovering 0.0% above 52-week lows. The -40.6% annual return signals severe bearish momentum, testing critical support levels.
Market Commentary
The clustering of S&P 500 stocks at 52-week extremes reflects divergent sector performance amid shifting macroeconomic conditions. Apple (AAPL), Exxon (XOM), Chevron (CVX), Pfizer (PFE), and ConocoPhillips (COP) trading at 52-week highs suggests sustained investor confidence in energy (XOM, CVX, COP) and defensive healthcare (PFE), while Apple's resilience underscores tech's leadership. Conversely, homebuilders (DHI, LEN), materials (MLM), and specialty finance (CPRT) near 52-week lows indicate pressure from elevated rates and housing demand concerns.
Sector rotation highlights a barbell strategy favoring energy (oil price strength) and healthcare (defensive positioning) while punishing rate-sensitive cyclicals. The energy trio's highs align with Brent crude above $90/bbl, while homebuilders (DHI, LEN) and TKO's lows reflect recessionary fears in discretionary spending. Materials (MLM) face input cost pressures, contrasting with tech's (AAPL) pricing power.
Key levels to monitor include crude oil prices for energy names and 10-year Treasury yields for homebuilders. Catalysts include Q3 earnings (particularly for PFE's COVID portfolio and DHI/LEN's order trends) and Fed policy shifts. A break below 52-week lows in housing stocks may signal deeper cyclical weakness, while energy highs could extend with geopolitical supply risks.
Methodology: All 503 S&P 500 constituents screened. 52-week high = highest daily close over the past 252 trading days (approx. 1 year). 52-week low = lowest daily close over the same period. Distance = (current price / extreme − 1) × 100. Technical indicators computed on up to 1 year of daily OHLCV data.
Disclaimer: For informational purposes only. Not investment advice. Past performance is not indicative of future results.