Nasdaq 100 52-Week Highs & Lows Radar: Apple (AAPL), Applovin (APP) and more
MarketsFN Team

Screening all 101 Nasdaq 100 constituents for stocks nearest to their 52-week high and their 52-week low. Data as of October 14, 2026. % Realized = 52-week total return.
Legend: RSI > 70 = overbought · RSI < 30 = oversold · Green % Realized = positive 52W return · Red = negative.
📈 Nearest to 52-Week High
Sectors represented: Technology (4), Healthcare (1)
| Ticker | Company | Sector | Price Last | % Realized | 52-Week High Date | RSI | % above MA200 | Trend |
|---|---|---|---|---|---|---|---|---|
| AAPL | Apple Inc | Technology | $345.41 | +39.41% | 2026-10-14 | 64.1 | +18.4% | Above MA20, MA50, MA200 |
| TEAM | Atlassian Corporation | Technology | $208.99 | +33.65% | 2026-10-14 | 67.5 | +83.4% | Above MA20, MA50, MA200 |
| BIIB | Biogen Inc | Healthcare | $232.89 | +60.27% | 2026-10-14 | 63.8 | +18.1% | Above MA20, MA50, MA200 |
| MSFT | Microsoft Corporation | Technology | $541.09 | +5.36% | 2026-10-13 | 68.5 | +24.4% | Above MA20, MA50, MA200 |
| SHOP | Shopify Inc | Technology | $178.00 | +16.43% | 2026-10-12 | 73.9 | +37.3% | Above MA20, MA50, MA200 |
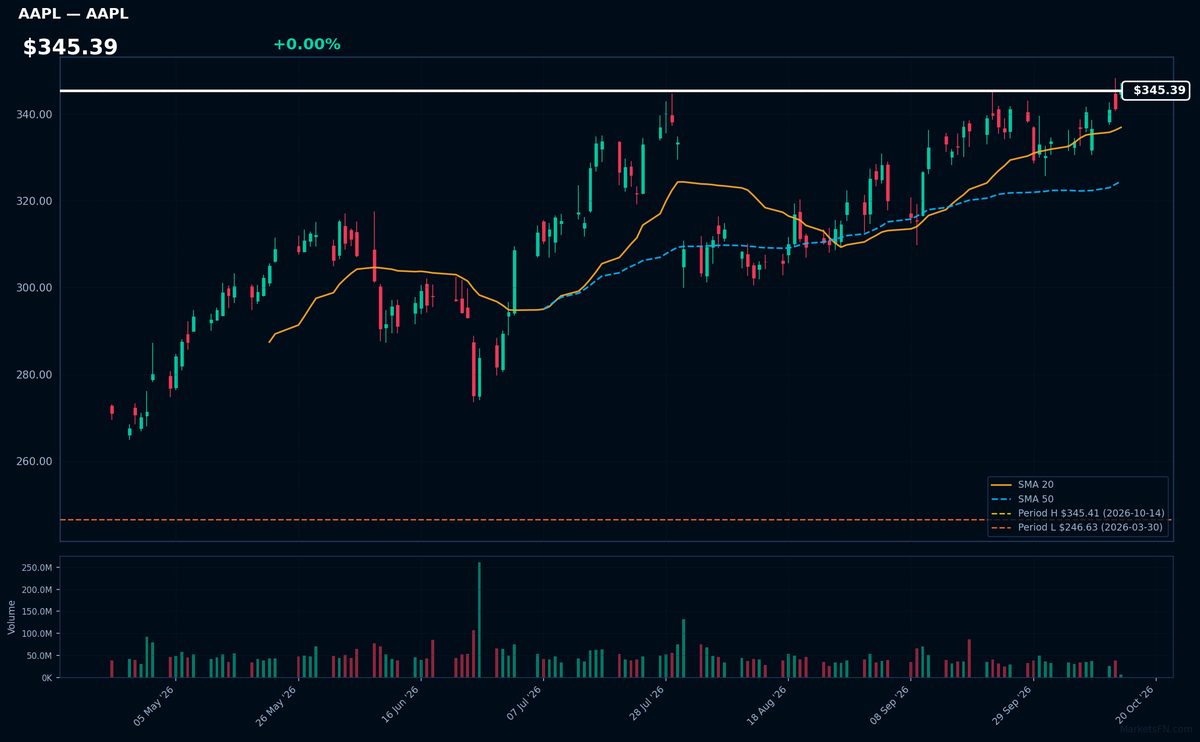
AAPL | Apple Inc | Technology | Price Last: $345.41 | % Realized: +39.41% | RSI: 64.1 | % above MA200: +18.4% | Trend: Above MA20, MA50, MA200
Apple designs premium consumer electronics (iPhone, Mac, AirPods) and operates high-margin services (App Store, iCloud). Investors care because its ecosystem creates recurring revenue and pricing power, with $345.39/share reflecting 39.4% annual growth.
Technically bullish: $345.39 trades above all MAs (20>50>200) with RSI(14) at 64.1 — extended but not overbought. Stock tests 52-week highs (0.0% below), suggesting momentum continuation.
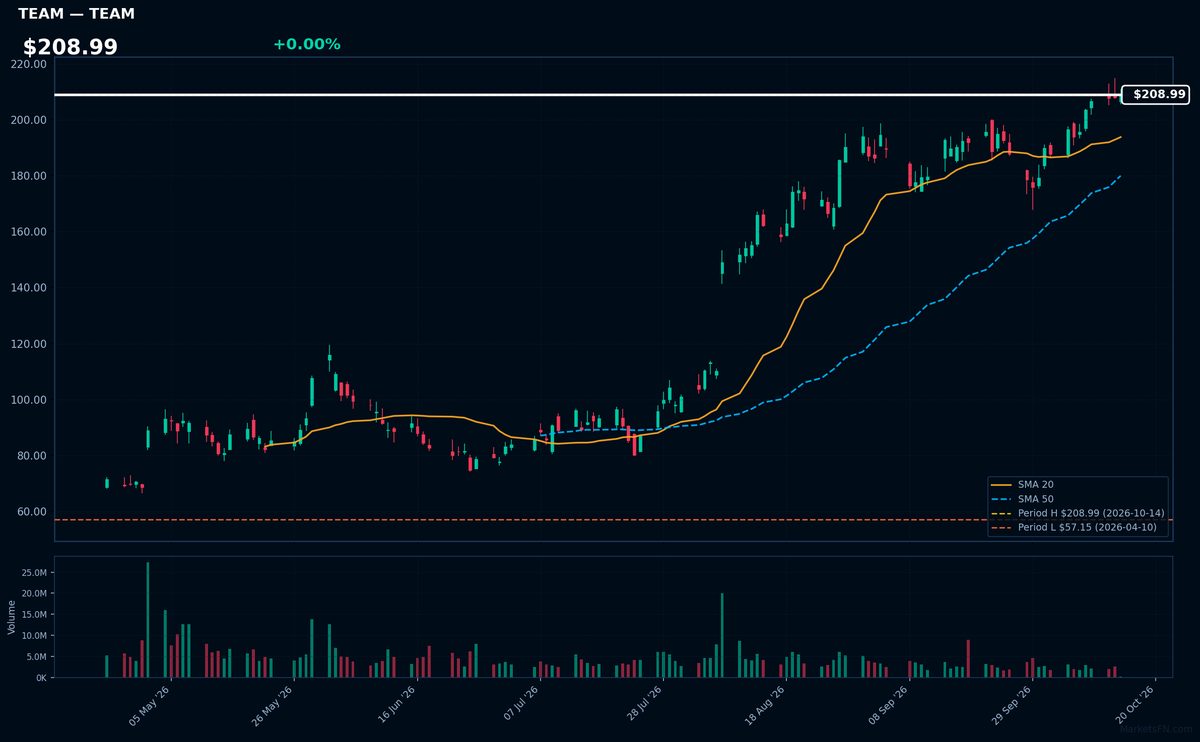
TEAM | Atlassian Corporation | Technology | Price Last: $208.99 | % Realized: +33.65% | RSI: 67.5 | % above MA200: +83.4% | Trend: Above MA20, MA50, MA200
Atlassian provides collaboration software (Jira, Confluence) for agile development teams. Investors care because its tools are mission-critical for developers, driving sticky subscriptions and 33.6% annual returns as digital transformation accelerates.
Technically bullish with price at 52-week highs, RSI(14) at 67.5 (approaching overbought), and sustained uptrend (price > MA20 > MA50 > MA200). Momentum suggests continuation but warrants monitoring given elevated RSI.
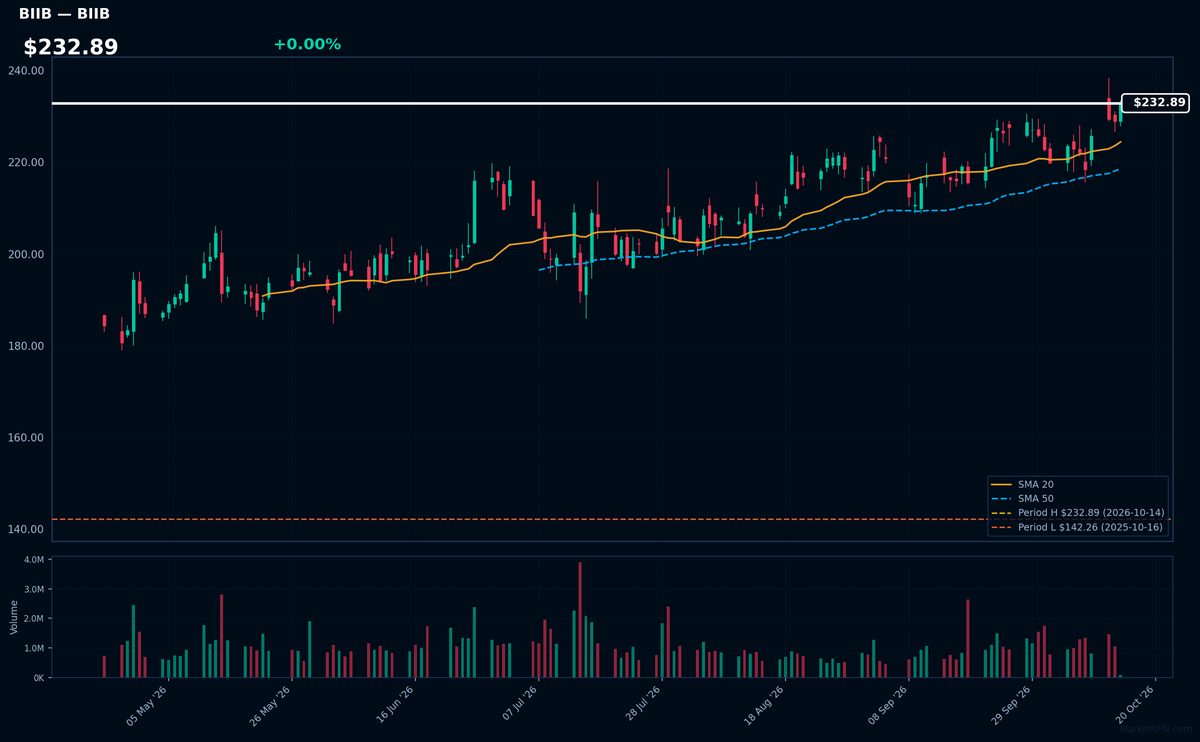
BIIB | Biogen Inc | Healthcare | Price Last: $232.89 | % Realized: +60.27% | RSI: 63.8 | % above MA200: +18.1% | Trend: Above MA20, MA50, MA200
Biogen develops therapies for neurological diseases like multiple sclerosis and Alzheimer's. Investors care because its pipeline targets high-need conditions with limited treatment options, creating potential for premium pricing and market expansion.
Technically bullish with RSI(14) at 63.8 and price > MA20 > MA50 > MA200. At 52-week highs after 60.3% annual return, testing breakout levels.
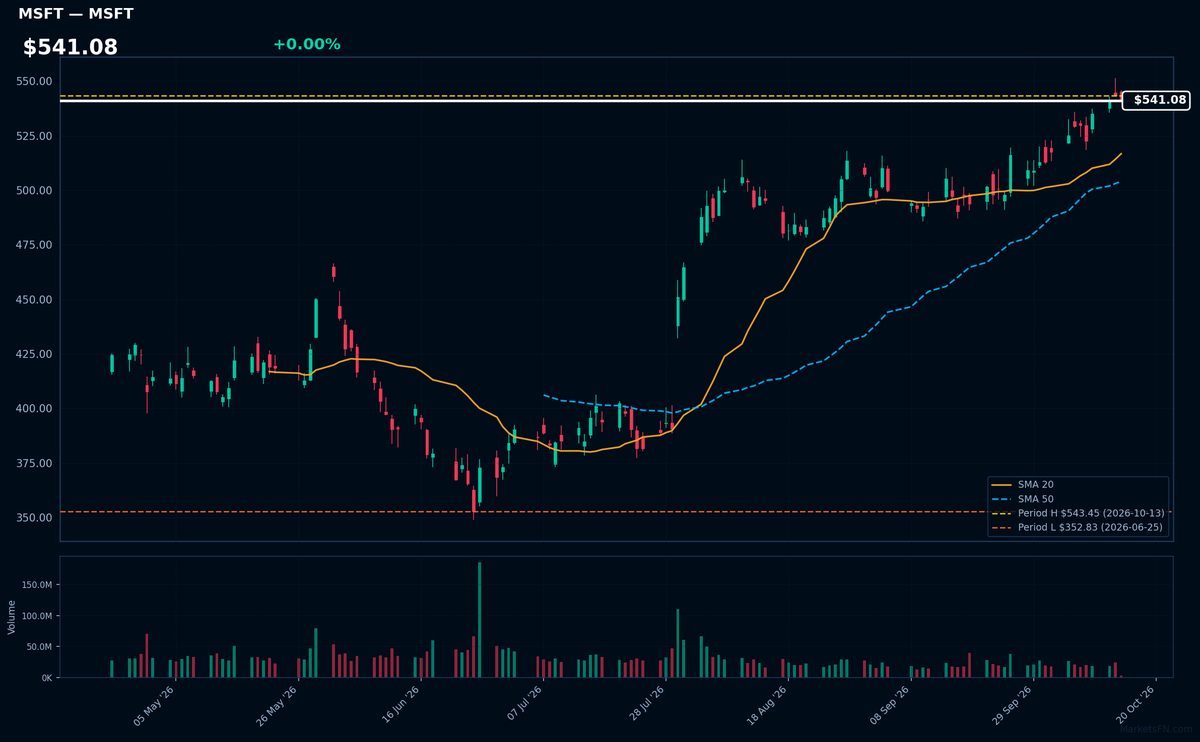
MSFT | Microsoft Corporation | Technology | Price Last: $541.09 | % Realized: +5.36% | RSI: 68.5 | % above MA200: +24.4% | Trend: Above MA20, MA50, MA200
Microsoft dominates enterprise software (Azure cloud, Office 365) and consumer tech (Xbox, Windows), with recurring revenue streams and AI leadership via OpenAI integration. Investors care for its cash flow durability and cloud growth at scale.
Technically bullish: $541.08 trades above all key MAs (20/50/200), RSI at 68.5 shows strong momentum but nears overbought. Stock sits 0.4% below 52-week high, suggesting breakout potential after 5.4% yearly gain.
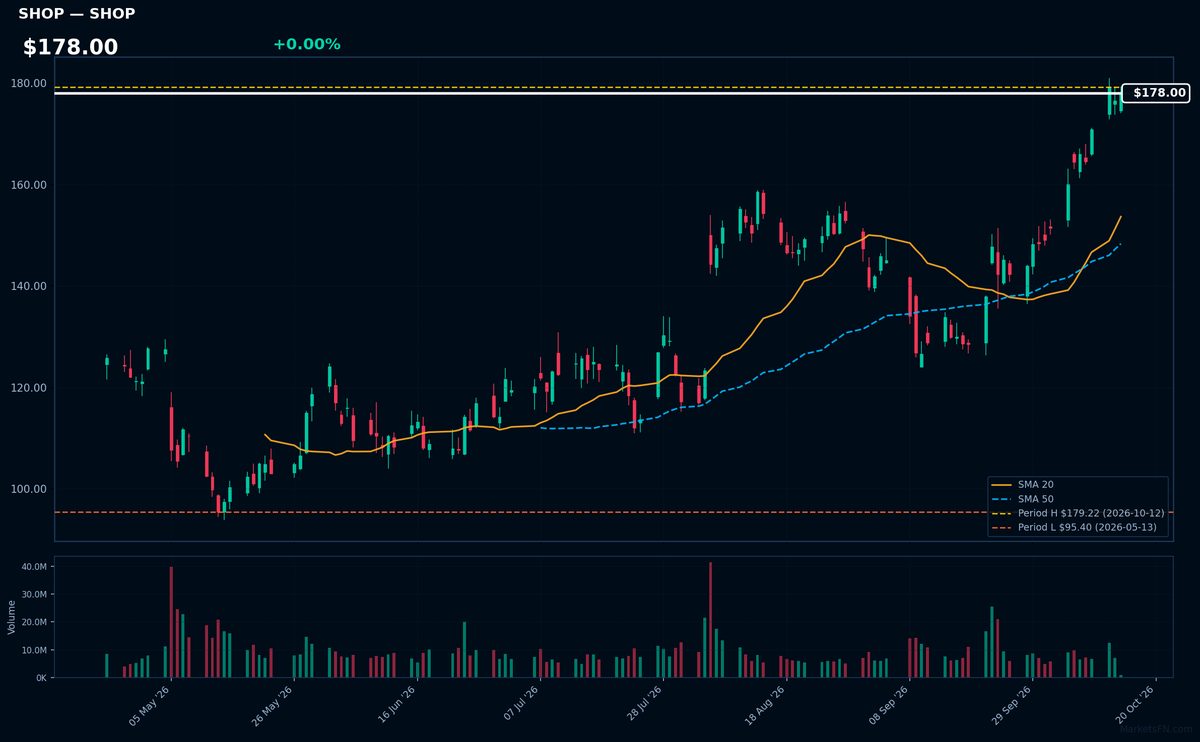
SHOP | Shopify Inc | Technology | Price Last: $178.00 | % Realized: +16.43% | RSI: 73.9 | % above MA200: +37.3% | Trend: Above MA20, MA50, MA200
Shopify provides cloud-based commerce tools enabling businesses to launch online stores, process payments, and manage inventory. Investors care because it powers 10% of U.S. e-commerce and benefits from the secular shift to digital retail, with merchants relying on its scalable platform for global sales.
Technically bullish with RSI(14) at 73.9 (overbought) and price > MA20 > MA50 > MA200 confirming uptrend. The 16.4% 52-week return and 0.7% proximity to 52-week high suggest strong momentum, though elevated RSI warrants caution near term.
📉 Nearest to 52-Week Low
Sectors represented: Communication Services (4), Industrials (1)
| Ticker | Company | Sector | Price Last | % Realized | 52-Week Low Date | RSI | % above MA200 | Trend |
|---|---|---|---|---|---|---|---|---|
| APP | Applovin Corp | Communication Services | $264.98 | -55.09% | 2026-10-14 | 31.5 | -39.6% | Below MA20, MA50, MA200 |
| CMCSA | Comcast Corp | Communication Services | $20.65 | -26.55% | 2026-10-14 | 26.9 | -21.9% | Below MA20, MA50, MA200 |
| CPRT | Copart, Inc | Industrials | $25.99 | -41.95% | 2026-10-14 | 31.0 | -21.2% | Below MA20, MA50, MA200 |
| TTD | Trade Desk Inc | Communication Services | $11.92 | -76.50% | 2026-10-06 | 35.4 | -44.8% | Below MA20, MA50, MA200 |
| CHTR | Charter Communications Inc | Communication Services | $103.10 | -61.28% | 2026-10-12 | 31.7 | -39.7% | Below MA20, MA50, MA200 |
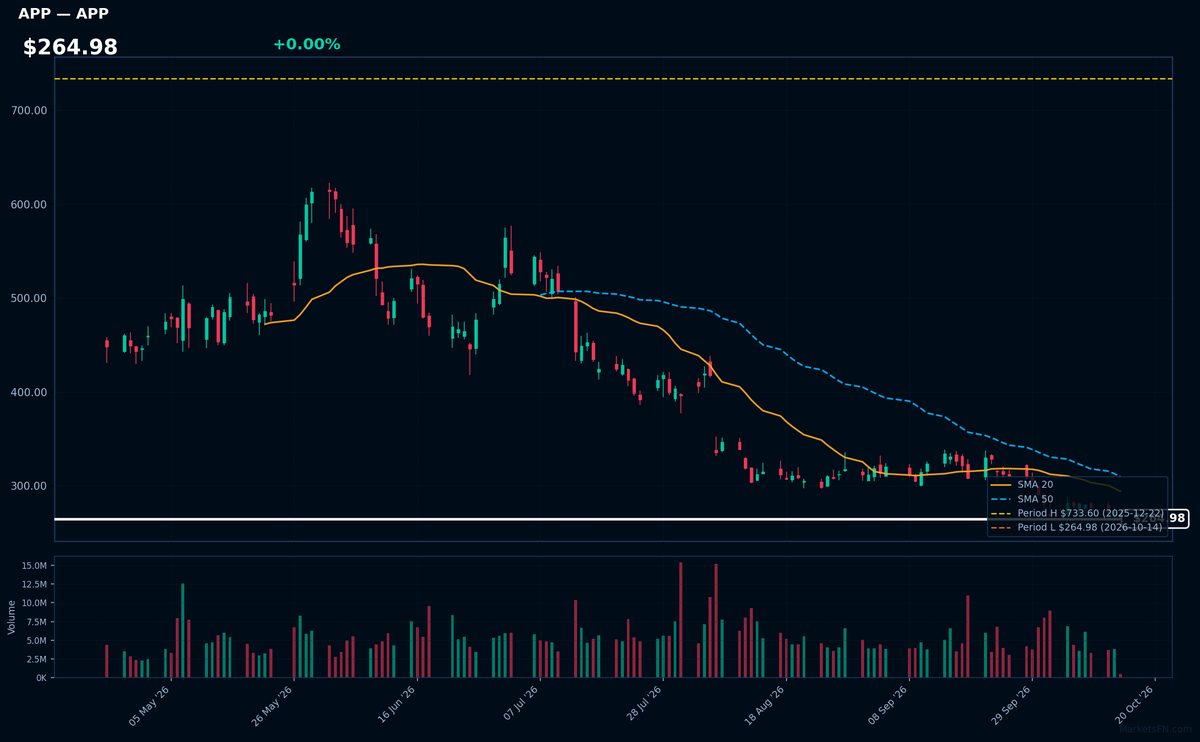
APP | Applovin Corp | Communication Services | Price Last: $264.98 | % Realized: -55.09% | RSI: 31.5 | % above MA200: -39.6% | Trend: Below MA20, MA50, MA200
Applovin operates a mobile app monetization platform, enabling developers to maximize ad revenue through its AI-powered ad network and analytics tools. Investors care due to its exposure to high-growth mobile advertising and gaming markets, where its technology drives publisher earnings.
APP shows extreme technical weakness: RSI(14) at 31.5 signals near-oversold conditions, while bearish MA alignment (price < MA20 < MA50 < MA200) confirms sustained downtrend. Trading just 0.0% above 52-week lows after a -55.1% plunge, this tests critical support — a clear warning sign, not momentum.
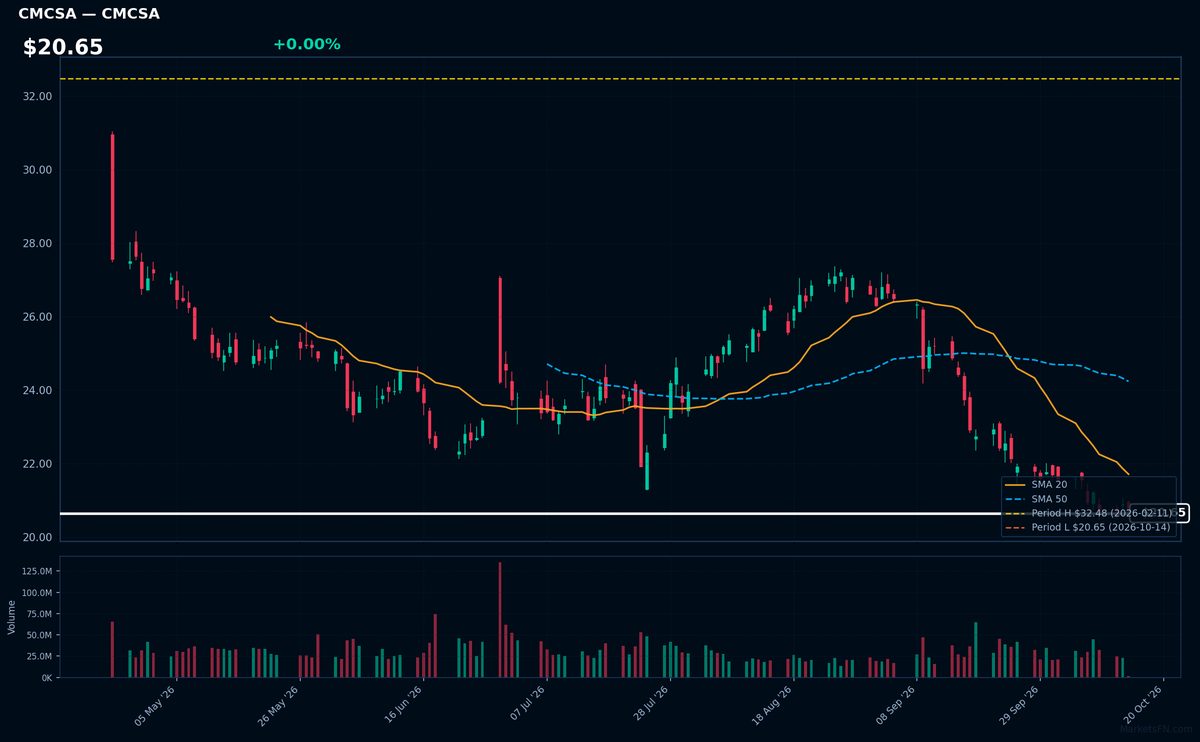
CMCSA | Comcast Corp | Communication Services | Price Last: $20.65 | % Realized: -26.55% | RSI: 26.9 | % above MA200: -21.9% | Trend: Below MA20, MA50, MA200
Comcast operates as a media and technology conglomerate, providing broadband, video, and streaming services through Xfinity, along with content via NBCUniversal. Investors watch its infrastructure-heavy cash flows and competitive position in connectivity amid cord-cutting.
Technically dire: RSI(14) at 26.9 shows oversold conditions amid bearish MA alignment (price < MA20 < MA50 < MA200). At 0.0% above 52-week lows after a -26.5% plunge, this signals capitulation.
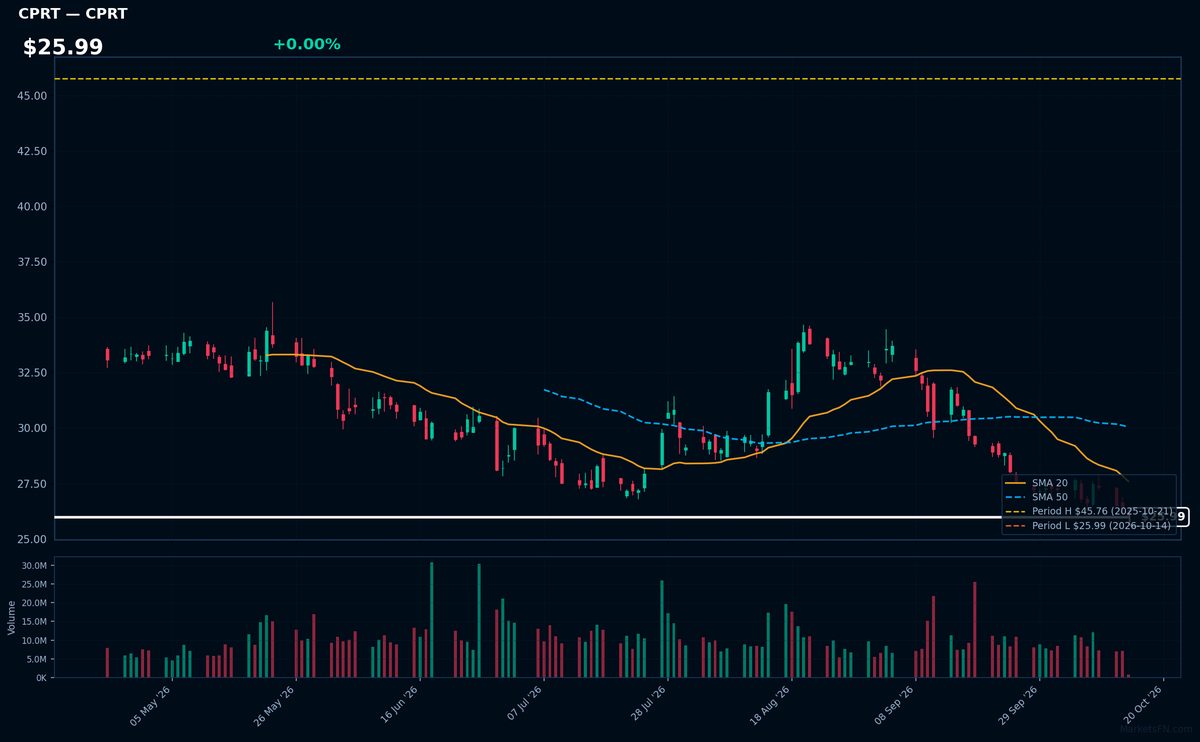
CPRT | Copart, Inc | Industrials | Price Last: $25.99 | % Realized: -41.95% | RSI: 31.0 | % above MA200: -21.2% | Trend: Below MA20, MA50, MA200
Copart operates an online vehicle auction platform, specializing in salvage and used cars for insurers, dealers, and individuals. Investors care because its asset-light model dominates the $10B+ North American salvage market with high margins and recurring revenue from insurance partnerships.
Technically dire: RSI at 31 (nearly oversold) with bearish MA alignment (price below all key MAs) and just 0.0% above 52-week lows. The 41.9% annual plunge signals severe downtrend—avoid until MA structure improves.
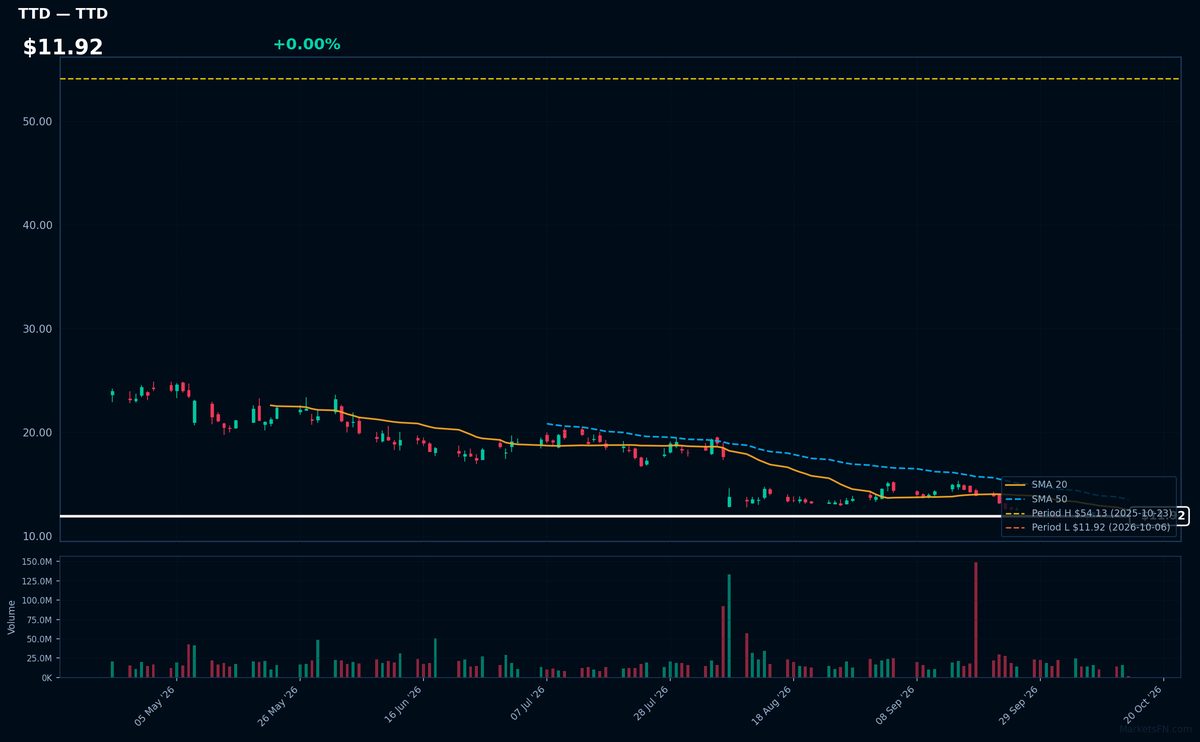
TTD | Trade Desk Inc | Communication Services | Price Last: $11.92 | % Realized: -76.50% | RSI: 35.4 | % above MA200: -44.8% | Trend: Below MA20, MA50, MA200
Trade Desk operates a cloud-based platform for programmatic ad buying, enabling data-driven digital ad placements. Investors care because it's a pure-play leader in the high-growth adtech space, though currently facing cyclical ad spend pressures.
Technically dire: RSI 35.4 shows near-oversold conditions, but bearish MA alignment (price < MA20 < MA50 < MA200) and -76.5% 52-week return signal severe downtrend. Testing 52-week low suggests critical support break risk.
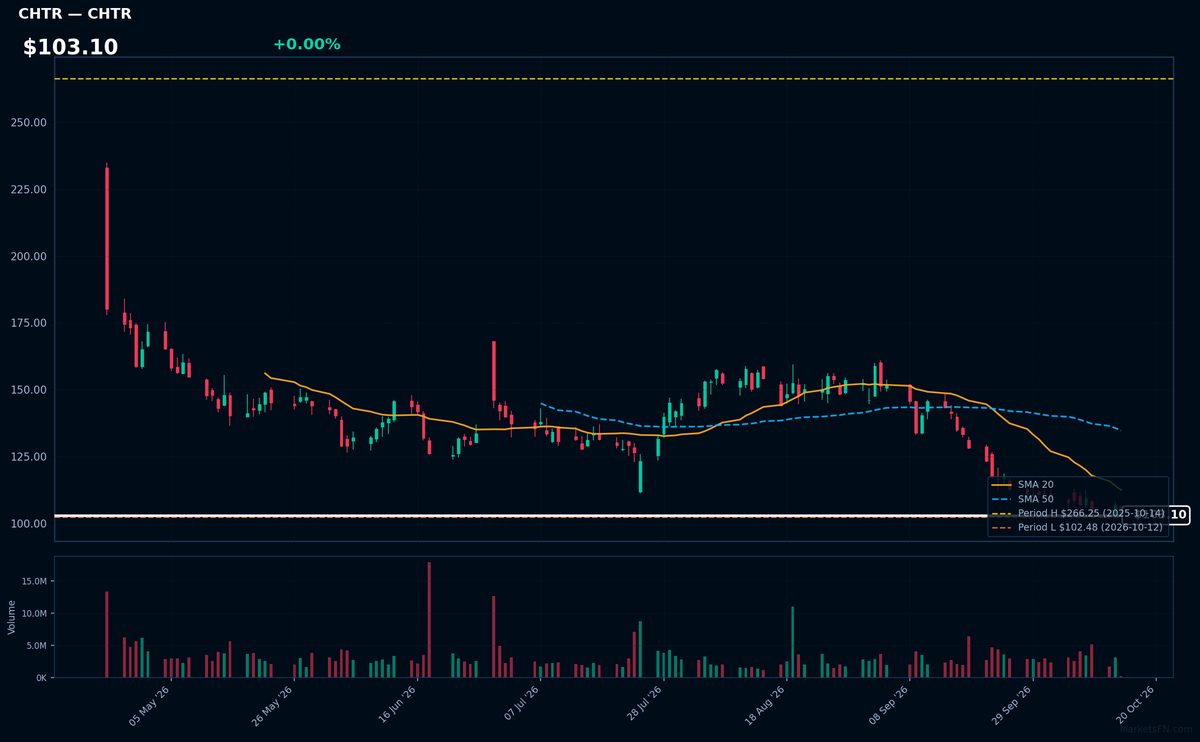
CHTR | Charter Communications Inc | Communication Services | Price Last: $103.10 | % Realized: -61.28% | RSI: 31.7 | % above MA200: -39.7% | Trend: Below MA20, MA50, MA200
Charter Communications Inc provides cable TV, internet, and voice services to residential and business customers under the Spectrum brand. Investors watch CHTR as a leading U.S. broadband provider in an increasingly connectivity-dependent economy, though facing cord-cutting pressures.
CHTR shows extreme technical weakness: RSI(14) at 31.7 (nearing oversold) with bearish MA alignment (price < MA20 < MA50 < MA200). Trading just 0.6% above 52-week lows after a -61.3% annual plunge signals severe downtrend pressure.
Market Commentary
The clustering of Nasdaq 100 stocks at 52-week extremes reflects a stark bifurcation in market sentiment. Leaders like AAPL, TEAM, and MSFT (all within -0.7% of highs) demonstrate resilience in mega-cap tech and enterprise software, while APP, TTD, and CHTR (within +0.6% of lows) highlight pressure on ad-tech and telecom names. This divergence suggests investors are rewarding predictable cash flows while punishing cyclical exposure.
The high-fliers benefit from AI monetization (MSFT), sticky SaaS revenues (TEAM), and hardware ecosystem strength (AAPL). Conversely, ad-dependent firms (TTD, APP) face macro uncertainty, while cable operators (CHTR, CMCSA) grapple with cord-cutting. The 10-year Treasury yield's 2023 surge has disproportionately weighed on long-duration assets, exacerbating the gap between growth stalwarts and structurally challenged names.
For highs, watch AAPL's $198.23 and MSFT's $366.78 (last 52W peaks) – breaks above could signal renewed momentum. For lows, TTD at $60.11 and CHTR at $329.50 (52W troughs) are critical supports. Catalysts include Q3 earnings revisions, Fed policy shifts, and any stabilization in digital ad spend. Violations of these levels may accelerate trend continuation.
Methodology: All 101 Nasdaq 100 constituents screened. 52-week high = highest daily close over the past 252 trading days (approx. 1 year). 52-week low = lowest daily close over the same period. Distance = (current price / extreme − 1) × 100. Technical indicators computed on up to 1 year of daily OHLCV data.
Disclaimer: For informational purposes only. Not investment advice. Past performance is not indicative of future results.