S&P 500 2026 YTD Highs & Lows Radar: Microsoftoration (MSFT), Copart, (CPRT) and more
MarketsFN Team

Screening all 503 S&P 500 constituents for stocks nearest to their 2026 year-to-date high and their 2026 YTD low. Data as of October 13, 2026. % Realized = total return since Jan 1 2026.
Legend: RSI > 70 = overbought · RSI < 30 = oversold · Green % Realized = positive YTD return · Red = negative.
📈 Nearest to 2026 High
Sectors represented: Technology (1), Financial (1), Energy (1), Healthcare (1), Consumer Defensive (1)
| Ticker | Company | Sector | Price Last | % Realized | 2026 YTD High Date | RSI | % above MA200 | Trend |
|---|---|---|---|---|---|---|---|---|
| MSFT | Microsoft Corporation | Technology | $541.15 | +14.42% | 2026-10-12 | 72.8 | +24.5% | Above MA20, MA50, MA200 |
| V | Visa Inc | Financial | $389.27 | +12.35% | 2026-10-12 | 72.9 | +15.0% | Above MA20, MA50, MA200 |
| XOM | Exxon Mobil Corp | Energy | $172.15 | +40.36% | 2026-10-12 | 70.9 | +14.1% | Above MA20, MA50, MA200 |
| ABBV | Abbvie Inc | Healthcare | $281.12 | +22.59% | 2026-10-12 | 76.7 | +20.6% | Above MA20, MA50, MA200 |
| PM | Philip Morris International Inc | Consumer Defensive | $202.00 | +26.01% | 2026-10-12 | 67.1 | +12.7% | Above MA20, MA50, MA200 |
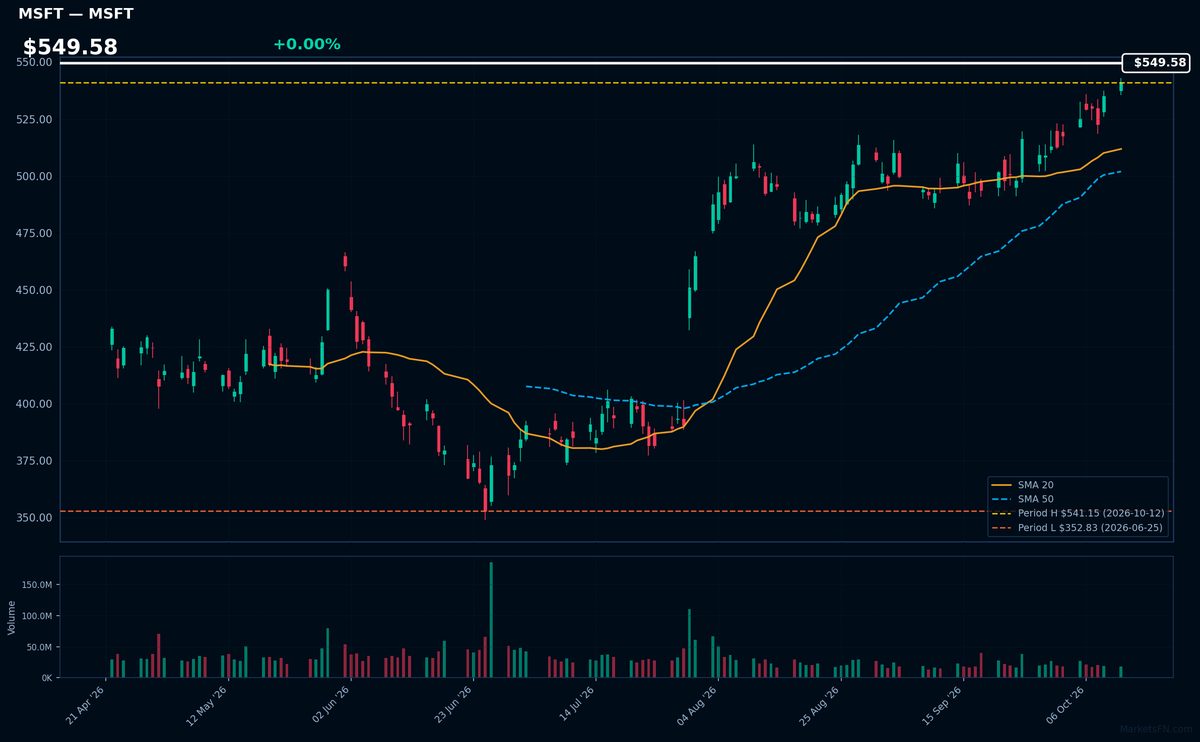
MSFT | Microsoft Corporation | Technology | Price Last: $541.15 | % Realized: +14.42% | RSI: 72.8 | % above MA200: +24.5% | Trend: Above MA20, MA50, MA200
Microsoft dominates enterprise cloud computing (Azure), productivity software (Office 365), and AI infrastructure (OpenAI partnership). Investors care because it monetizes digital transformation across industries while generating $100B+ annual free cash flow to fund growth and buybacks.
Technically overbought (RSI 72.8) but in strong uptrend (price > MA20 > MA50 > MA200). YTD +14.4% with stock at YTD highs suggests momentum continuation, though RSI warrants caution.
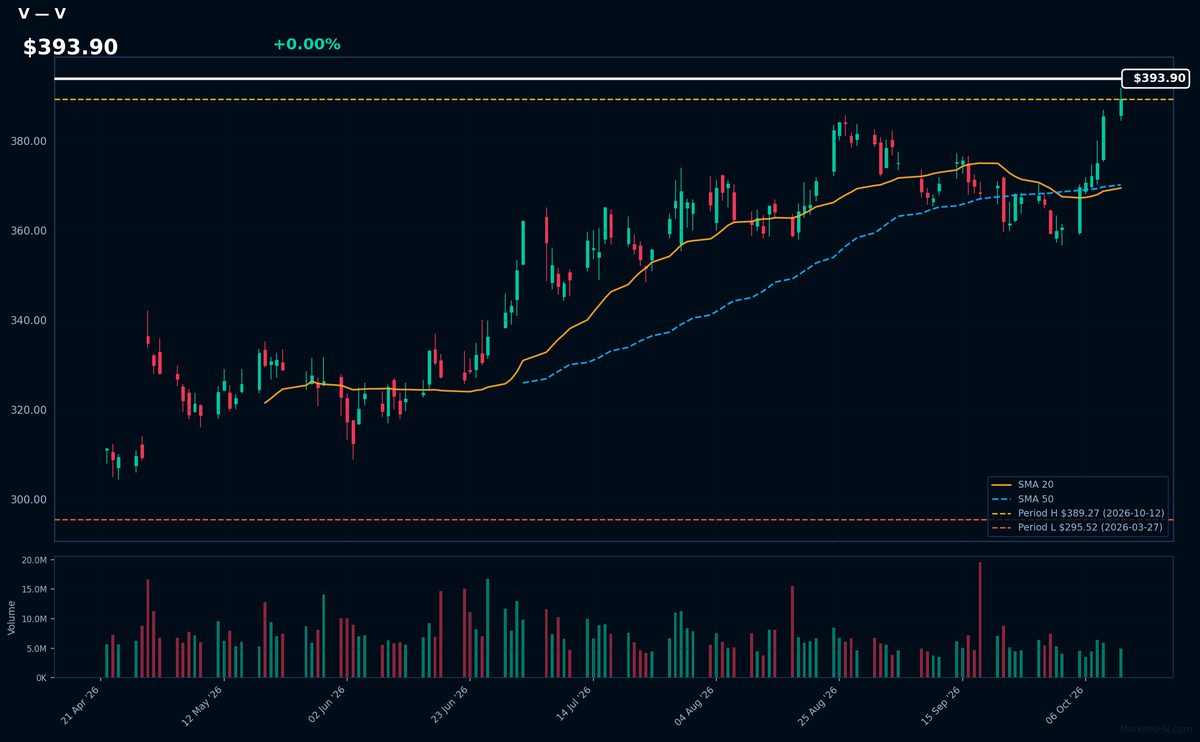
V | Visa Inc | Financial | Price Last: $389.27 | % Realized: +12.35% | RSI: 72.9 | % above MA200: +15.0% | Trend: Above MA20, MA50, MA200
Visa operates the world's largest electronic payments network, processing over $14 trillion annually. Investors care because its asset-light model generates 60%+ operating margins as global cashless adoption grows, with pricing power from its entrenched duopoly position alongside Mastercard.
Visa trades at $393.90 with concerning technicals: overbought RSI(14) at 72.9 despite mixed MA alignment (above MA20/50/200). The 12.3% YTD gain brings it 0.0% below its 2026 high — extended momentum that may precede consolidation given extreme proximity to resistance.
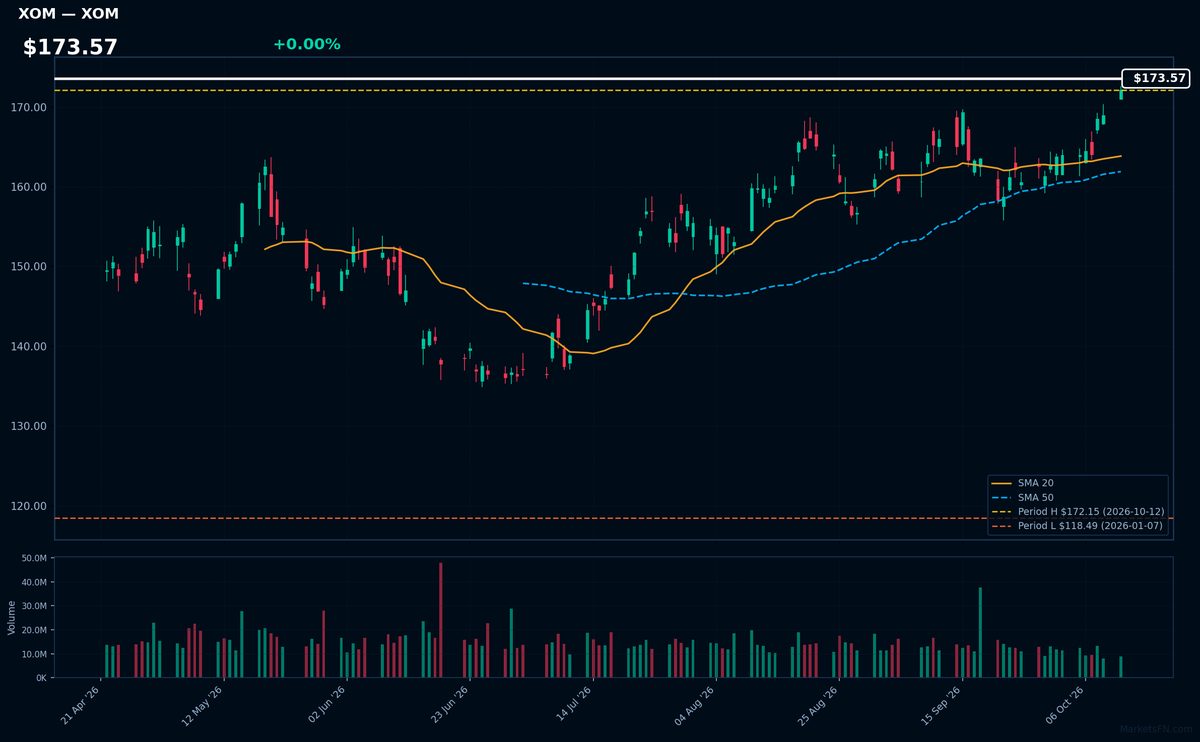
XOM | Exxon Mobil Corp | Energy | Price Last: $172.15 | % Realized: +40.36% | RSI: 70.9 | % above MA200: +14.1% | Trend: Above MA20, MA50, MA200
Exxon Mobil Corp is an integrated energy giant producing oil, gas, and petrochemicals globally. Investors care for its scale, dividend reliability, and direct exposure to energy prices, with refining and trading operations providing countercyclical balance.
Technically overbought (RSI 70.9) but bullish (price > MA20 > MA50 > MA200), up 40.4% YTD. Near 2026 highs suggests momentum, but RSI warns of stretched valuation.
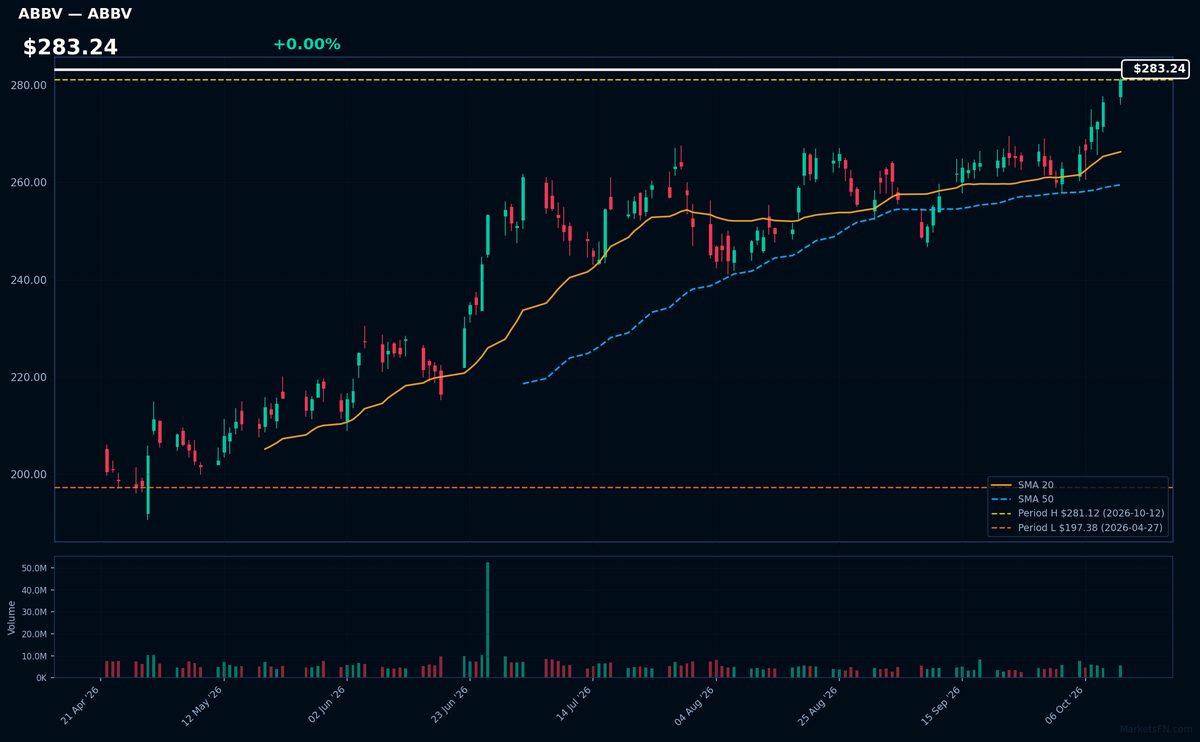
ABBV | Abbvie Inc | Healthcare | Price Last: $281.12 | % Realized: +22.59% | RSI: 76.7 | % above MA200: +20.6% | Trend: Above MA20, MA50, MA200
Abbvie Inc develops and markets immunology and oncology drugs, including blockbuster Humira and newer Skyrizi/Rinvoq. Investors care due to its patent-protected biologic portfolio generating stable cash flows while pipeline candidates address high-value autoimmune and cancer markets.
Technically bullish with RSI(14) at 76.7 (overbought) but confirmed by bullish MA alignment (price > MA20 > MA50 > MA200) and 22.6% YTD return. Extreme proximity to YTD highs suggests continuation potential, though RSI warrants caution.
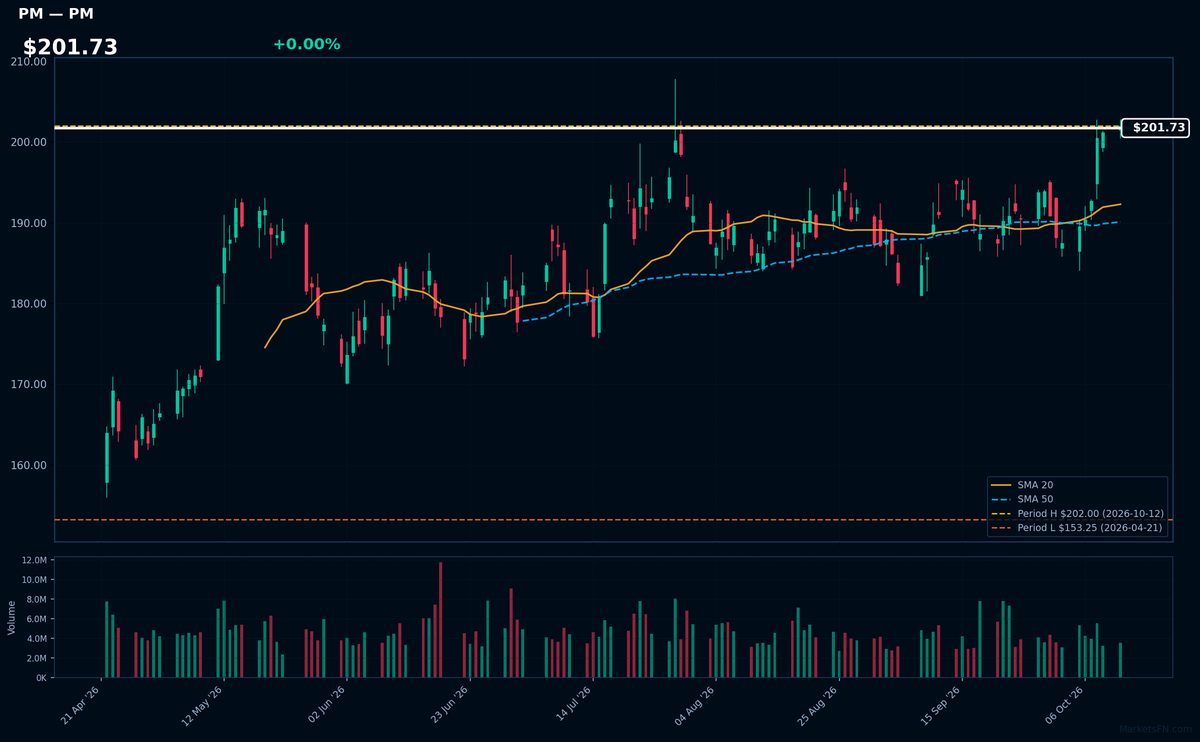
PM | Philip Morris International Inc | Consumer Defensive | Price Last: $202.00 | % Realized: +26.01% | RSI: 67.1 | % above MA200: +12.7% | Trend: Above MA20, MA50, MA200
Philip Morris International manufactures and sells cigarettes, heated tobacco (IQOS), and vaping products outside the U.S. Investors care because its smoke-free products now generate 40% of revenue, showing successful transition from declining cigarette demand.
PM shows strong bullish momentum with RSI(14) at 67.1 and price > MA20 > MA50 > MA200. The stock sits 0.0% below its 2026 high after gaining 26.0% YTD, suggesting potential breakout but nearing overbought territory.
📉 Nearest to 2026 Low
Sectors represented: Industrials (2), Communication Services (2), Basic Materials (1)
| Ticker | Company | Sector | Price Last | % Realized | 2026 YTD Low Date | RSI | % above MA200 | Trend |
|---|---|---|---|---|---|---|---|---|
| CPRT | Copart, Inc | Industrials | $26.48 | -29.89% | 2026-10-12 | 34.9 | -19.9% | Below MA20, MA50, MA200 |
| CHTR | Charter Communications Inc | Communication Services | $102.48 | -51.03% | 2026-10-12 | 28.5 | -40.2% | Below MA20, MA50, MA200 |
| TKO | TKO Group Holdings Inc | Communication Services | $173.45 | -16.18% | 2026-10-12 | 39.2 | -11.2% | Below MA20, MA50, MA200 |
| MLM | Martin Marietta Materials, Inc | Basic Materials | $477.18 | -24.79% | 2026-10-12 | 40.7 | -18.3% | Below MA20, MA50, MA200 |
| BLDR | Builders Firstsource Inc | Industrials | $52.14 | -50.17% | 2026-10-12 | 31.4 | -37.8% | Below MA20, MA50, MA200 |
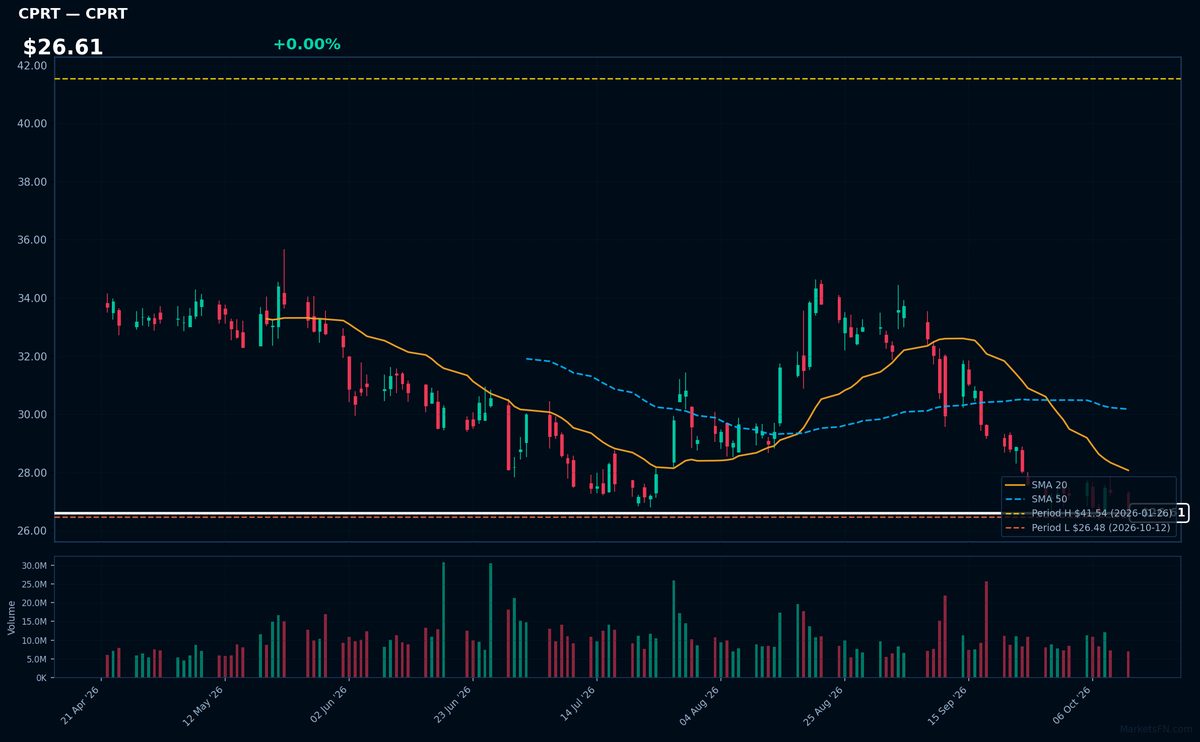
CPRT | Copart, Inc | Industrials | Price Last: $26.48 | % Realized: -29.89% | RSI: 34.9 | % above MA200: -19.9% | Trend: Below MA20, MA50, MA200
Copart operates an online vehicle auction platform, specializing in salvage and insurance total-loss cars. Investors care because its asset-light model dominates a $10B+ niche with high barriers to entry, generating consistent cash flow from insurers and dealers needing efficient remarketing.
Technically dire: RSI 34.9 shows oversold conditions within a sustained downtrend (price < MA20 < MA50 < MA200). Trading just 0.0% above YTD lows after -29.9% decline warns of potential breakdown unless fundamentals reverse sentiment.
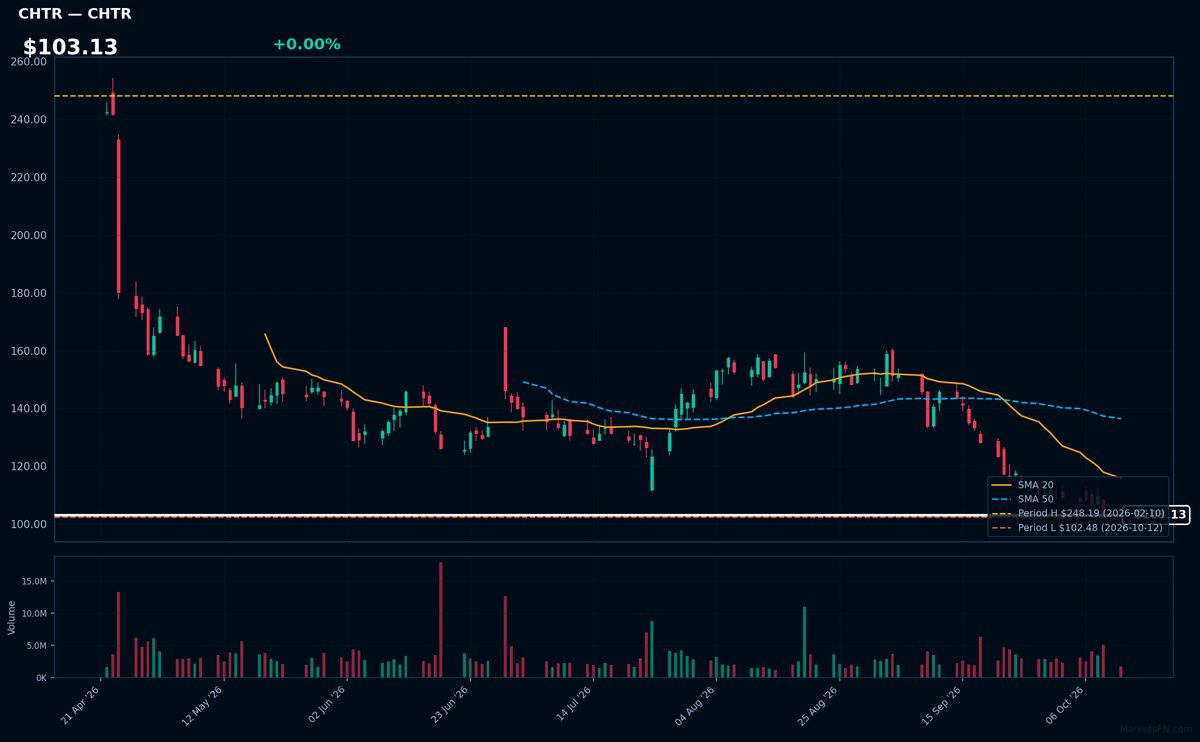
CHTR | Charter Communications Inc | Communication Services | Price Last: $102.48 | % Realized: -51.03% | RSI: 28.5 | % above MA200: -40.2% | Trend: Below MA20, MA50, MA200
Charter Communications Inc (CHTR) operates as a broadband connectivity and cable operator, providing essential internet, TV, and voice services to residential/commercial customers. Investors monitor its infrastructure-heavy model for cash flow stability amid cord-cutting pressures and broadband competition.
CHTR shows extreme technical weakness: RSI(14) at 28.5 (oversold) with sustained downtrend (price < MA20 < MA50 < MA200). The stock tests 2026 lows after a -51.0% YTD plunge, signaling severe bearish momentum.
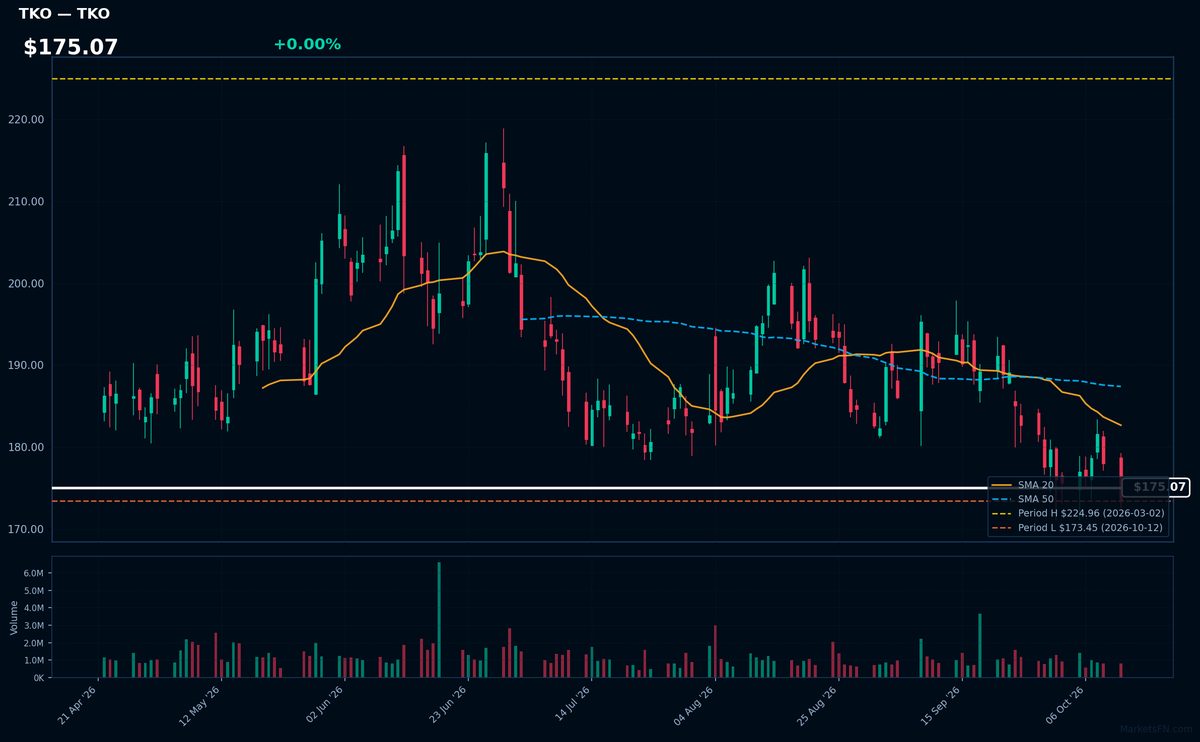
TKO | TKO Group Holdings Inc | Communication Services | Price Last: $173.45 | % Realized: -16.18% | RSI: 39.2 | % above MA200: -11.2% | Trend: Below MA20, MA50, MA200
TKO Group Holdings operates UFC and WWE, dominating combat sports and entertainment with pay-per-view events, media rights, and live performances. Investors care for its monopolistic position in a high-margin industry with global fanbases and recurring revenue from long-term broadcasting contracts.
Technically dire: RSI(14) at 39.2 shows weak momentum, with bearish MA alignment (price < MA20 < MA50 < MA200) and -16.2% YTD return. Trading 0.0% above 2026 lows signals critical support test—clear warning sign.
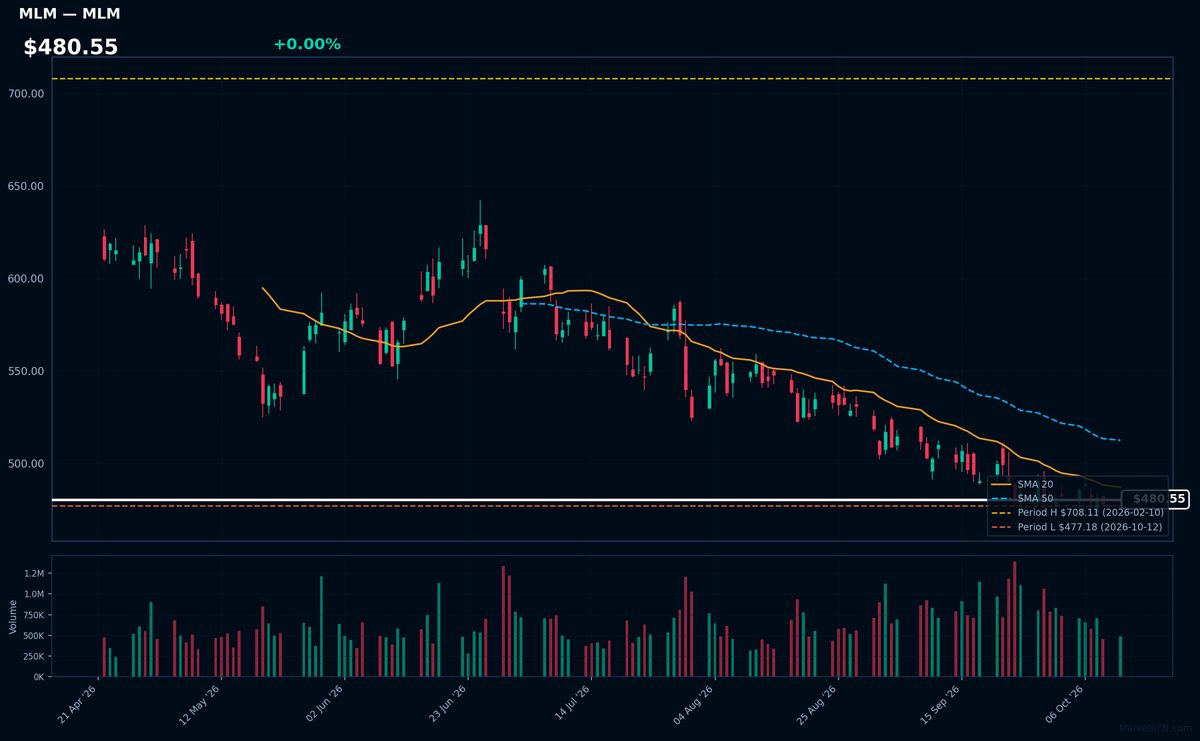
MLM | Martin Marietta Materials, Inc | Basic Materials | Price Last: $477.18 | % Realized: -24.79% | RSI: 40.7 | % above MA200: -18.3% | Trend: Below MA20, MA50, MA200
Martin Marietta Materials supplies construction aggregates (crushed stone, sand, gravel) and heavy building materials for infrastructure and commercial projects. Investors watch MLM as a cyclical play on U.S. construction activity and infrastructure spending, with pricing power in regional markets.
MLM shows bearish momentum: RSI(14) at 40.7 (neutral), price ($480.55) below all key MAs (MA20 < MA50 < MA200). Down 24.8% YTD and testing 2026 lows, signaling sustained downtrend. Extreme proximity to YTD low (0.0% above) suggests critical support test ahead.
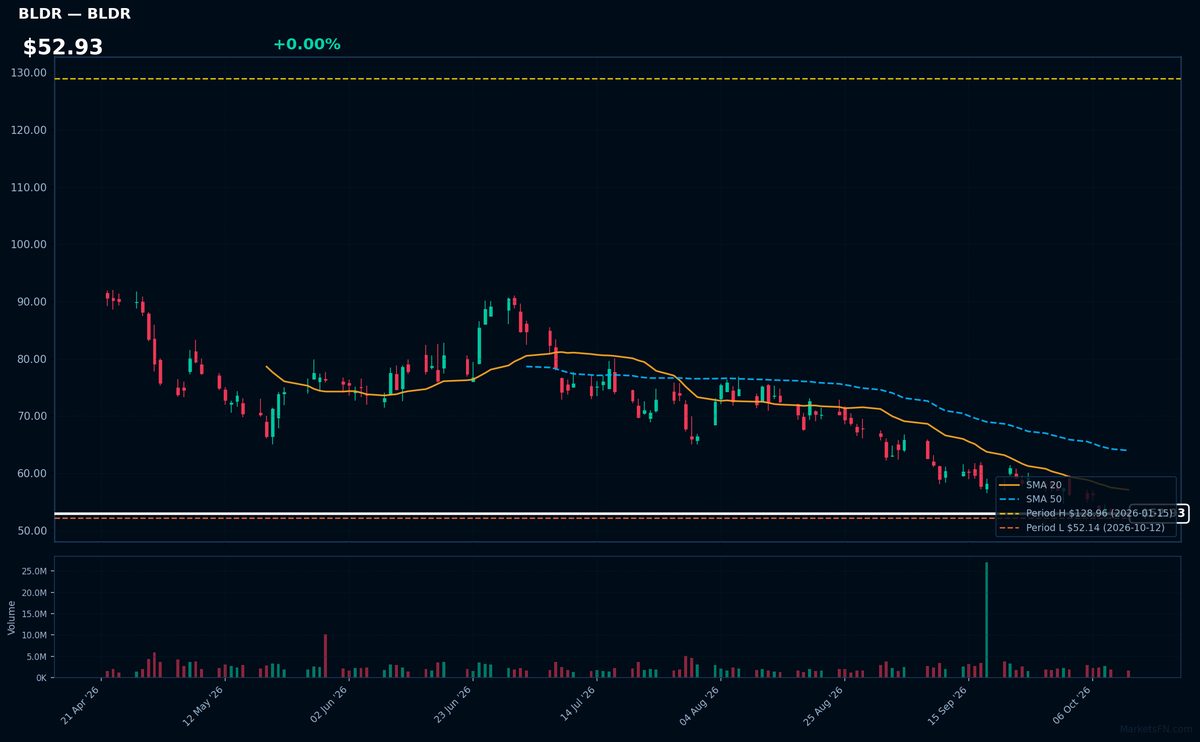
BLDR | Builders Firstsource Inc | Industrials | Price Last: $52.14 | % Realized: -50.17% | RSI: 31.4 | % above MA200: -37.8% | Trend: Below MA20, MA50, MA200
Builders Firstsource Inc supplies building materials and services to US homebuilders and contractors. Investors watch BLDR as a cyclical play on housing demand, with its performance closely tied to construction activity and lumber prices.
BLDR shows extreme weakness: RSI(14) at 31.4 (oversold) with bearish MA alignment (price < MA20 < MA50 < MA200). The stock tests 2026 lows after a 50.2% YTD plunge — a clear warning sign.
Market Commentary
The S&P 500 stocks trading at their 2026 highs—MSFT, V, XOM, ABBV, and PM—reflect strong investor confidence in sectors like technology (MSFT), payments (V), energy (XOM), healthcare (ABBV), and consumer staples (PM). These companies likely benefit from stable earnings, defensive positioning, or secular growth trends. Conversely, stocks near 2026 lows—CPRT, CHTR, TKO, MLM, and BLDR—suggest weakness in industries like used auto auctions (CPRT), telecom (CHTR), entertainment (TKO), construction materials (MLM, BLDR), possibly due to cyclical pressures or sector-specific headwinds.
The divergence highlights a market favoring defensive, cash-flow-positive sectors amid economic uncertainty, while cyclical and interest-rate-sensitive industries lag. Energy (XOM) and healthcare (ABBV) may be buoyed by commodity stability and drug pipelines, while telecom (CHTR) and construction (MLM, BLDR) could face demand or financing challenges. The resilience of tech (MSFT) and payments (V) underscores continued digital transformation tailwinds.
Investors should monitor earnings revisions, interest rate expectations, and sector rotation signals. For high-flyers like MSFT and ABBV, valuation discipline is key, while oversold names like CPRT and BLDR may warrant scrutiny for cyclical rebounds. Macro data—particularly inflation and industrial activity—could dictate whether current extremes persist or reverse.
Methodology: All 503 S&P 500 constituents screened. Close prices downloaded from 2026-01-01. Period high = highest close since Jan 1 2026; period low = lowest close since Jan 1 2026. Distance = (current price / period extreme − 1) × 100. Technical indicators computed on up to 1 year of daily OHLCV data.
Disclaimer: For informational purposes only. Not investment advice. Past performance is not indicative of future results.