Nasdaq 100 2026 YTD Highs & Lows Radar: Microsoftoration (MSFT), Copart, (CPRT) and more
MarketsFN Team

Screening all 101 Nasdaq 100 constituents for stocks nearest to their 2026 year-to-date high and their 2026 YTD low. Data as of October 13, 2026. % Realized = total return since Jan 1 2026.
Legend: RSI > 70 = overbought · RSI < 30 = oversold · Green % Realized = positive YTD return · Red = negative.
📈 Nearest to 2026 High
Sectors represented: Technology (4), Healthcare (1)
| Ticker | Company | Sector | Price Last | % Realized | 2026 YTD High Date | RSI | % above MA200 | Trend |
|---|---|---|---|---|---|---|---|---|
| MSFT | Microsoft Corporation | Technology | $541.15 | +14.42% | 2026-10-12 | 72.7 | +24.5% | Above MA20, MA50, MA200 |
| SHOP | Shopify Inc | Technology | $179.22 | +14.01% | 2026-10-12 | 75.1 | +38.3% | Above MA20, MA50, MA200 |
| TEAM | Atlassian Corporation | Technology | $207.75 | +34.24% | 2026-10-12 | 69.6 | +82.6% | Above MA20, MA50, MA200 |
| BIIB | Biogen Inc | Healthcare | $229.41 | +29.01% | 2026-10-12 | 61.4 | +16.5% | Above MA20, MA50, MA200 |
| PLTR | Palantir Technologies Inc | Technology | $209.00 | +24.51% | 2026-10-09 | 76.6 | +37.1% | Above MA20, MA50, MA200 |
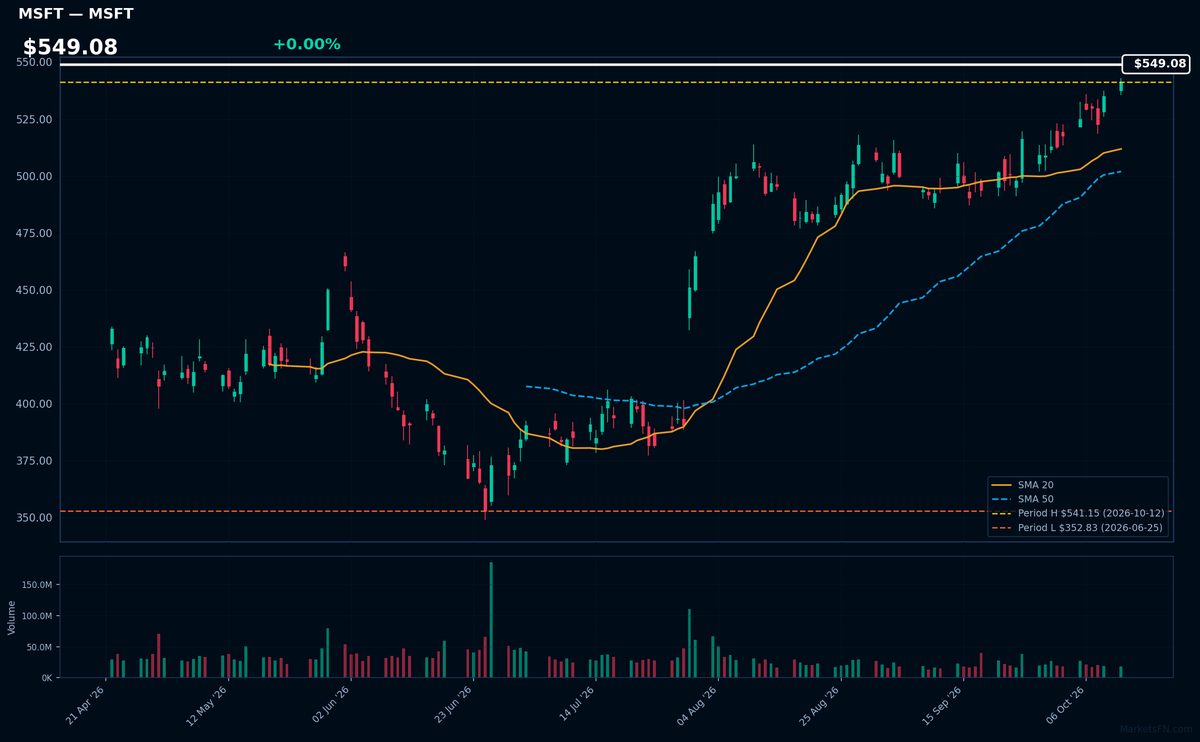
MSFT | Microsoft Corporation | Technology | Price Last: $541.15 | % Realized: +14.42% | RSI: 72.7 | % above MA200: +24.5% | Trend: Above MA20, MA50, MA200
Microsoft dominates enterprise software (Azure cloud, Office 365) and consumer tech (Windows, Xbox), with growing AI integration across products. Investors care for its cash flow durability, 90%+ gross margins in cloud, and strategic positioning in the AI infrastructure race.
Technically overbought (RSI 72.7) but strong uptrend (price > MA20 > MA50 > MA200). YTD +14.4%, testing 2026 highs — momentum confirms fundamental strength but warrants caution near extremes.
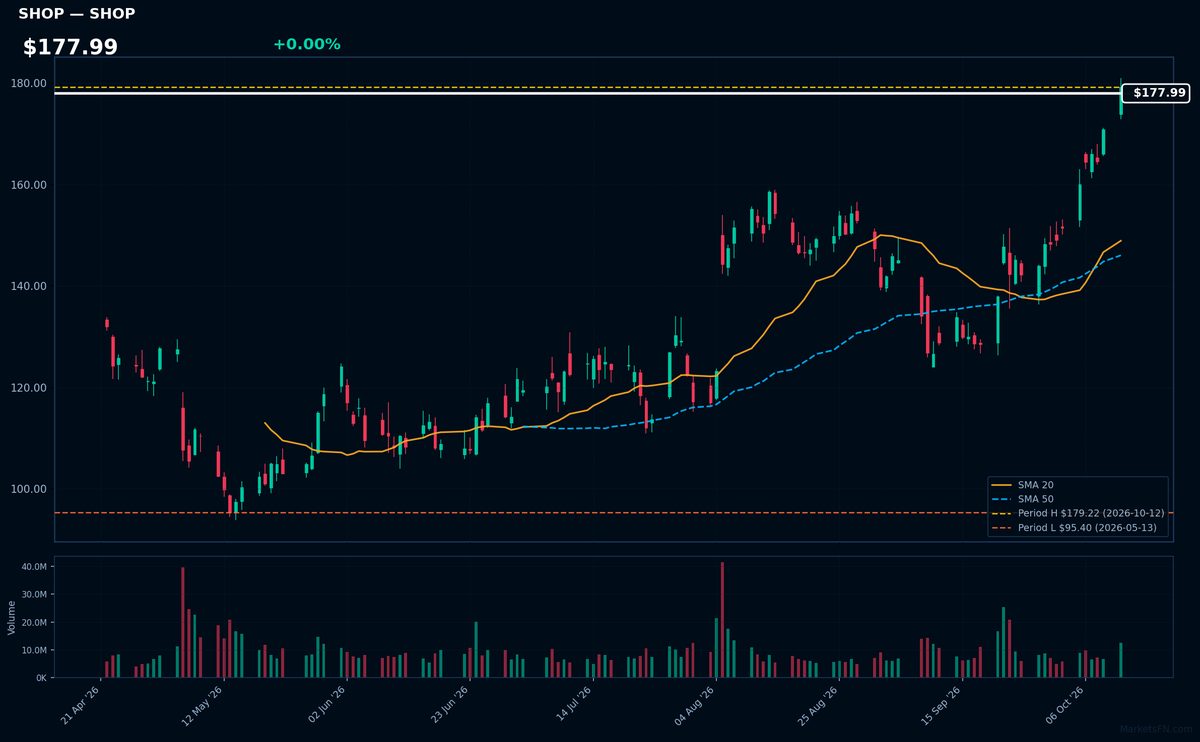
SHOP | Shopify Inc | Technology | Price Last: $179.22 | % Realized: +14.01% | RSI: 75.1 | % above MA200: +38.3% | Trend: Above MA20, MA50, MA200
Shopify Inc provides cloud-based commerce tools enabling businesses to manage online/offline sales, payments, and logistics. Investors care because it powers 10% of US e-commerce and benefits from digital transformation trends.
Technically bullish with RSI(14) at 75.1 (overbought) and price > MA20 > MA50 > MA200. Stock tests 2026 highs after 14.0% YTD gain — momentum extreme.
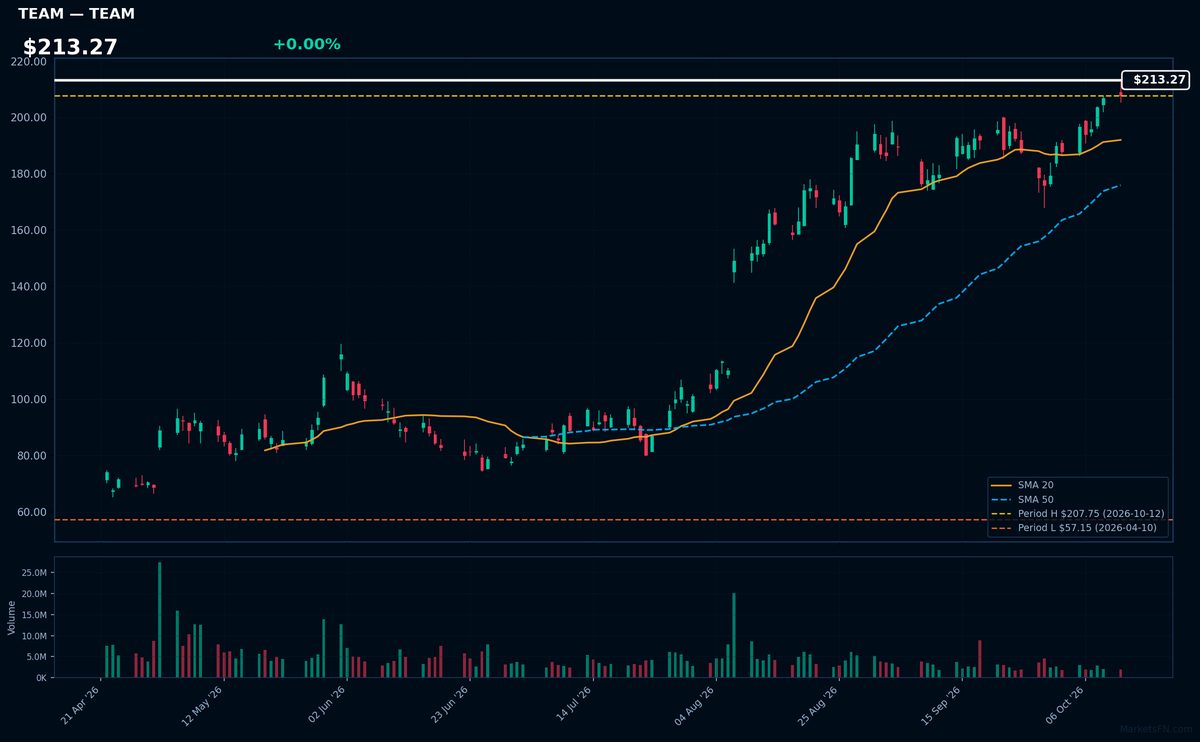
TEAM | Atlassian Corporation | Technology | Price Last: $207.75 | % Realized: +34.24% | RSI: 69.6 | % above MA200: +82.6% | Trend: Above MA20, MA50, MA200
Atlassian provides collaboration software (Jira, Confluence) for agile development teams. Investors care because its tools are mission-critical for software developers, creating sticky enterprise subscriptions with high renewal rates and predictable revenue streams.
TEAM shows strong bullish momentum (RSI 69.6, price > MA20 > MA50 > MA200) and sits at its YTD high (+34.2% in 2026). The MA alignment suggests sustained uptrend, though RSI nears overbought territory.
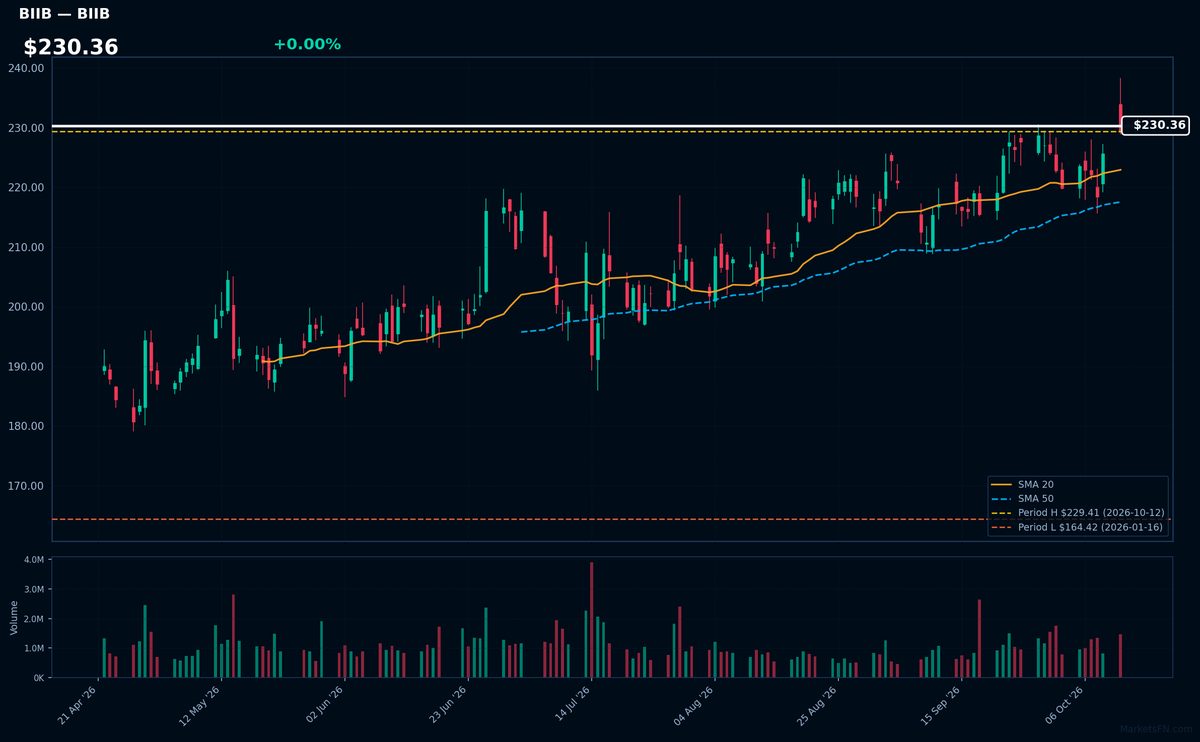
BIIB | Biogen Inc | Healthcare | Price Last: $229.41 | % Realized: +29.01% | RSI: 61.4 | % above MA200: +16.5% | Trend: Above MA20, MA50, MA200
Biogen specializes in neuroscience therapies, including multiple sclerosis and Alzheimer's treatments. Investors watch for its high-impact neurology pipeline and commercial execution in a high-barrier therapeutic area with limited competition.
Technically bullish with RSI(14) at 61.4 and sustained uptrend (price > MA20 > MA50 > MA200). At 29.0% YTD return, momentum dominates but nears overbought territory at 0.0% below YTD high.
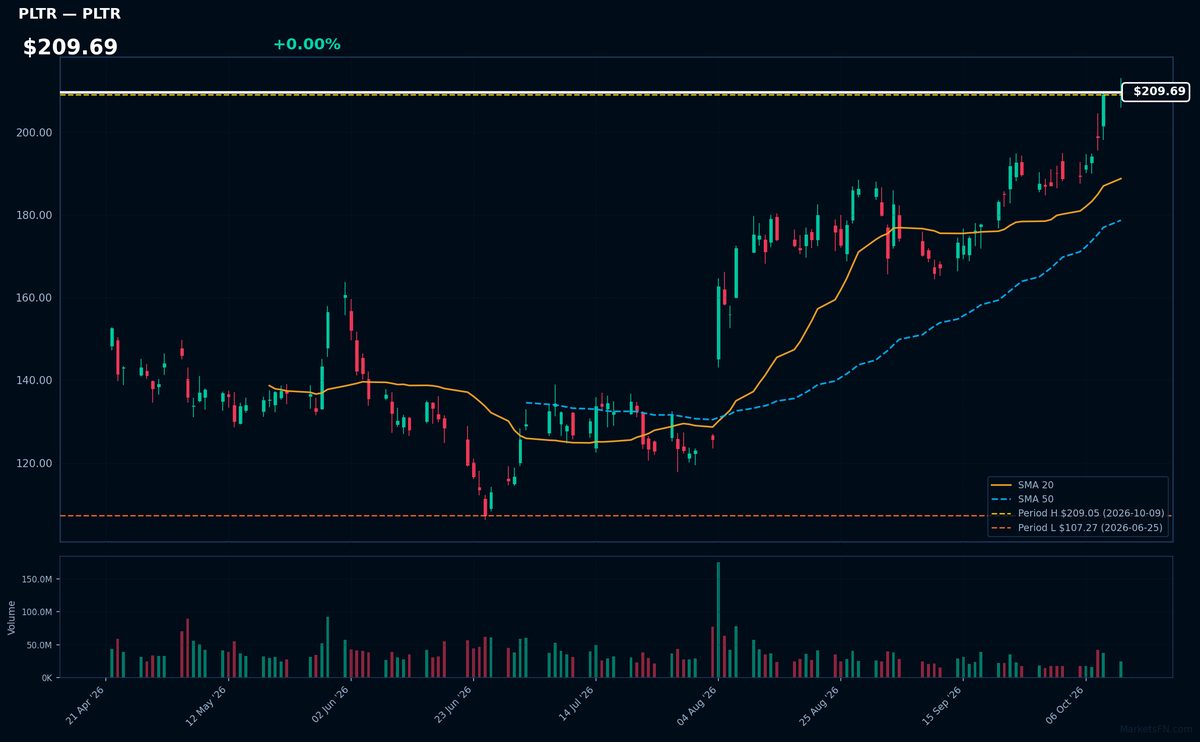
PLTR | Palantir Technologies Inc | Technology | Price Last: $209.00 | % Realized: +24.51% | RSI: 76.6 | % above MA200: +37.1% | Trend: Above MA20, MA50, MA200
Palantir Technologies Inc develops data integration and analytics software for government and commercial clients, specializing in AI-driven decision platforms. Investors care due to its unique positioning in classified government contracts and enterprise AI adoption, driving recurring revenue streams.
PLTR shows extreme bullish momentum (RSI 76.6, price > MA20 > MA50 > MA200) but nears overbought territory after a 24.5% YTD surge. The 0.0% distance from YTD highs suggests either breakout potential or exhaustion at current levels.
📉 Nearest to 2026 Low
Sectors represented: Communication Services (4), Industrials (1)
| Ticker | Company | Sector | Price Last | % Realized | 2026 YTD Low Date | RSI | % above MA200 | Trend |
|---|---|---|---|---|---|---|---|---|
| CPRT | Copart, Inc | Industrials | $26.48 | -29.89% | 2026-10-12 | 33.3 | -19.9% | Below MA20, MA50, MA200 |
| CHTR | Charter Communications Inc | Communication Services | $102.48 | -51.03% | 2026-10-12 | 31.6 | -40.2% | Below MA20, MA50, MA200 |
| CMCSA | Comcast Corp | Communication Services | $20.68 | -25.30% | 2026-10-09 | 29.6 | -21.9% | Below MA20, MA50, MA200 |
| TTD | Trade Desk Inc | Communication Services | $11.94 | -68.31% | 2026-10-06 | 38.9 | -45.0% | Below MA20, MA50, MA200 |
| APP | Applovin Corp | Communication Services | $270.87 | -56.19% | 2026-10-02 | 36.5 | -38.6% | Below MA20, MA50, MA200 |
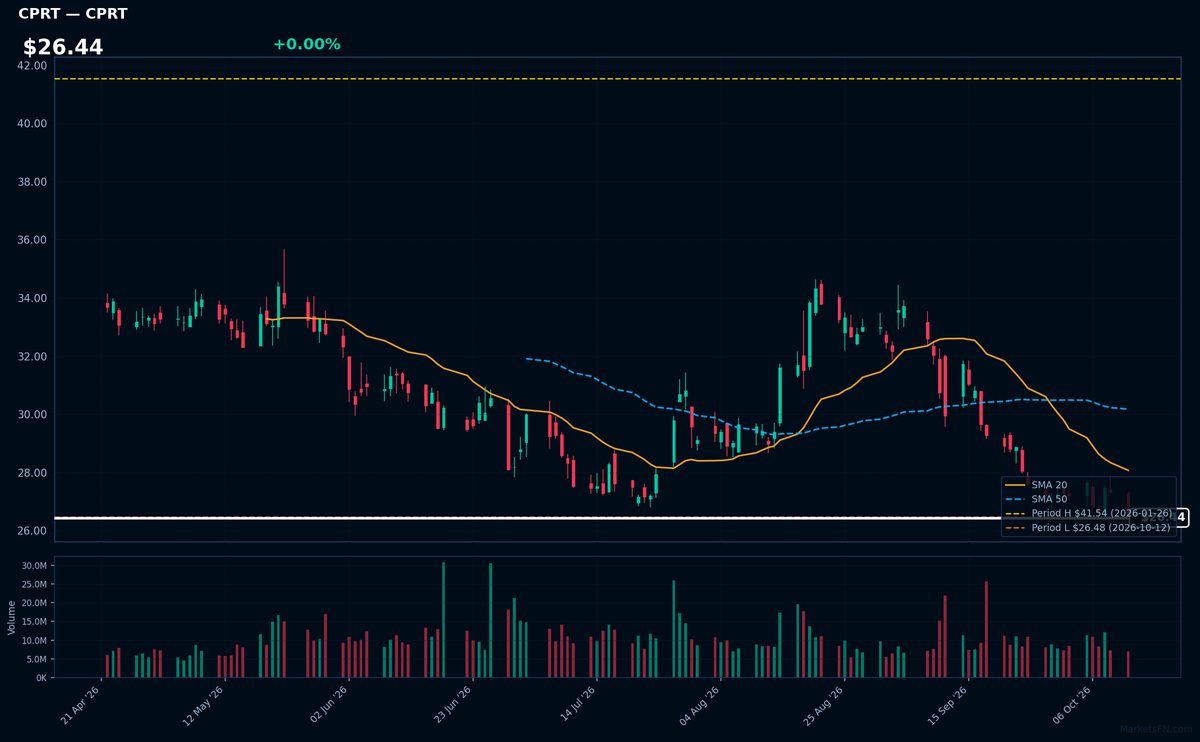
CPRT | Copart, Inc | Industrials | Price Last: $26.48 | % Realized: -29.89% | RSI: 33.3 | % above MA200: -19.9% | Trend: Below MA20, MA50, MA200
Copart operates an online vehicle auction platform, specializing in salvage and used cars for insurers, dealers, and individuals. Investors care due to its asset-light model and exposure to insurance claims cycles, which drive consistent supply.
Technically dire: RSI(14) at 33.3 shows near-oversold conditions, but bearish MA alignment (price < MA20 < MA50 < MA200) confirms sustained downtrend. Stock tests 2026 lows after -29.9% YTD plunge—clear warning sign.
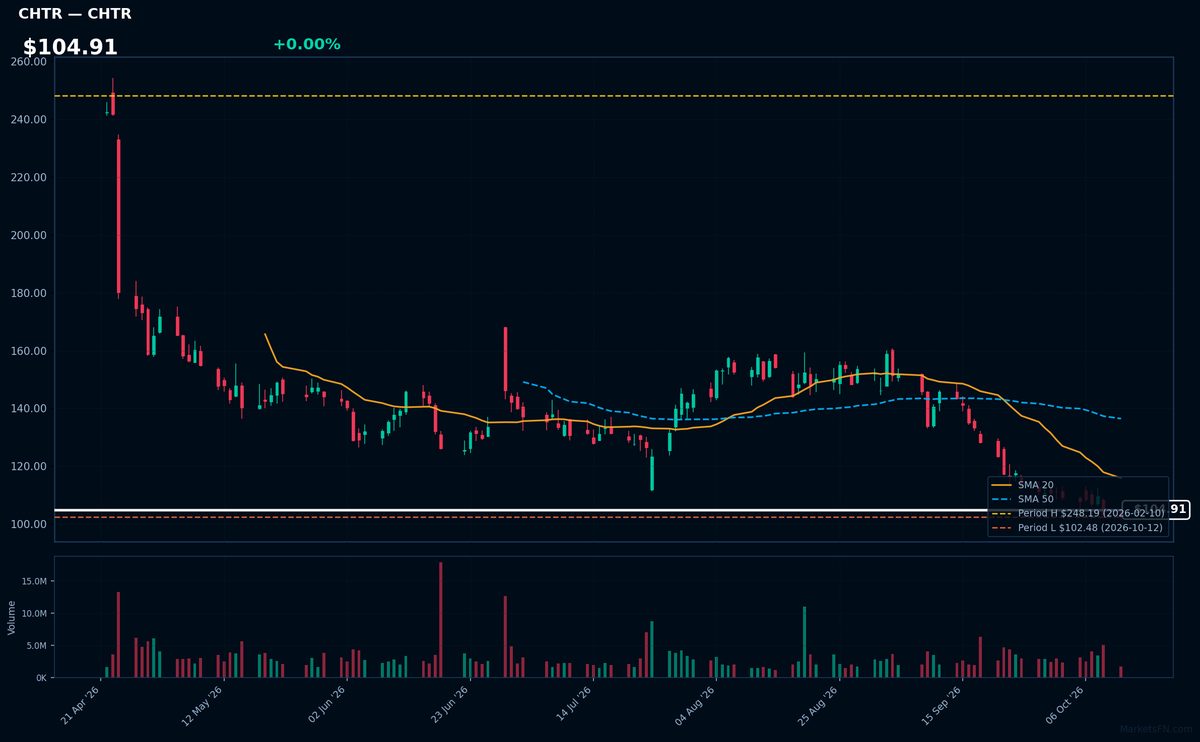
CHTR | Charter Communications Inc | Communication Services | Price Last: $102.48 | % Realized: -51.03% | RSI: 31.6 | % above MA200: -40.2% | Trend: Below MA20, MA50, MA200
Charter Communications Inc provides cable TV, internet, and phone services to residential and business customers under the Spectrum brand. Investors watch CHTR as a key player in broadband infrastructure, though cord-cutting pressures traditional video revenues.
CHTR shows severe technical weakness: RSI(14) at 31.6 (approaching oversold) with bearish MA alignment (price < MA20 < MA50 < MA200) and -51.0% YTD decline. Testing 2026 lows suggests capitulation risk.
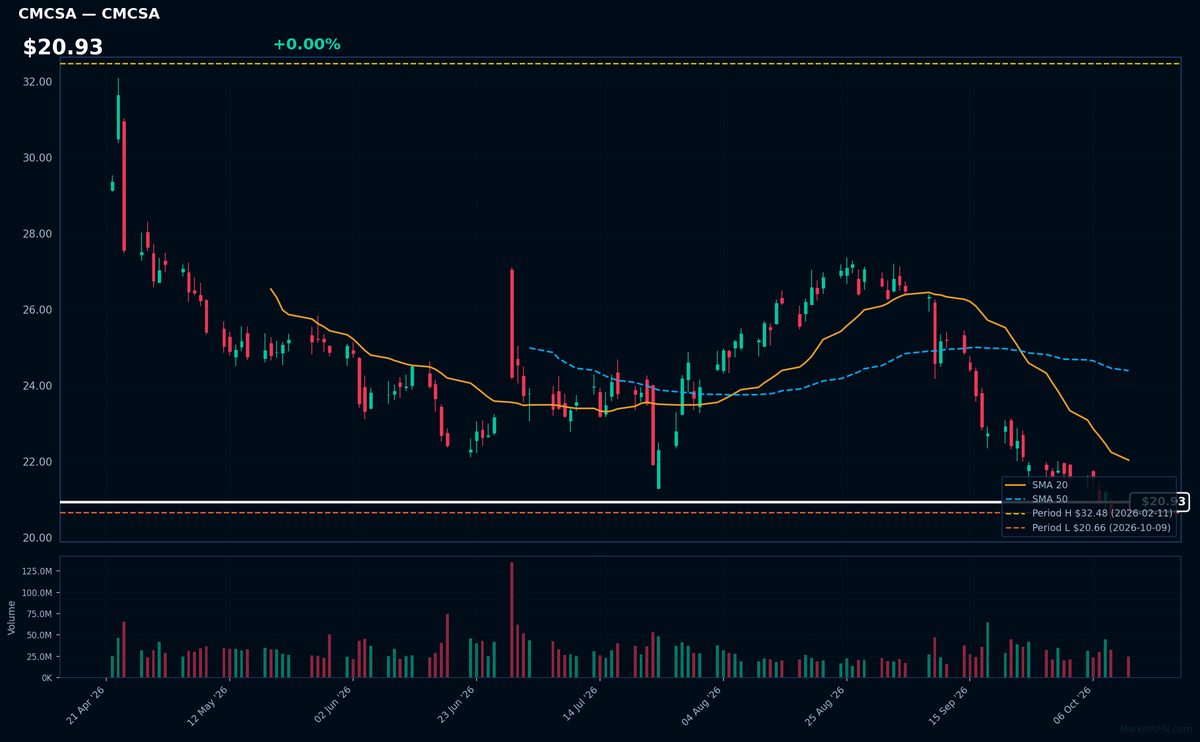
CMCSA | Comcast Corp | Communication Services | Price Last: $20.68 | % Realized: -25.30% | RSI: 29.6 | % above MA200: -21.9% | Trend: Below MA20, MA50, MA200
Comcast Corp operates as a global media and technology conglomerate, providing broadband, video, wireless, and streaming services through Xfinity, NBCUniversal, and Sky. Investors watch CMCSA for its infrastructure dominance in connectivity and content distribution amid shifting media consumption trends.
CMCSA shows extreme technical weakness: RSI(14) at 29.6 (oversold) with bearish MA alignment (price < MA20 < MA50 < MA200). Trading just 0.1% above YTD lows after a -25.3% 2026 decline, this signals capitulation, not momentum. Strictly a warning sign per the data.
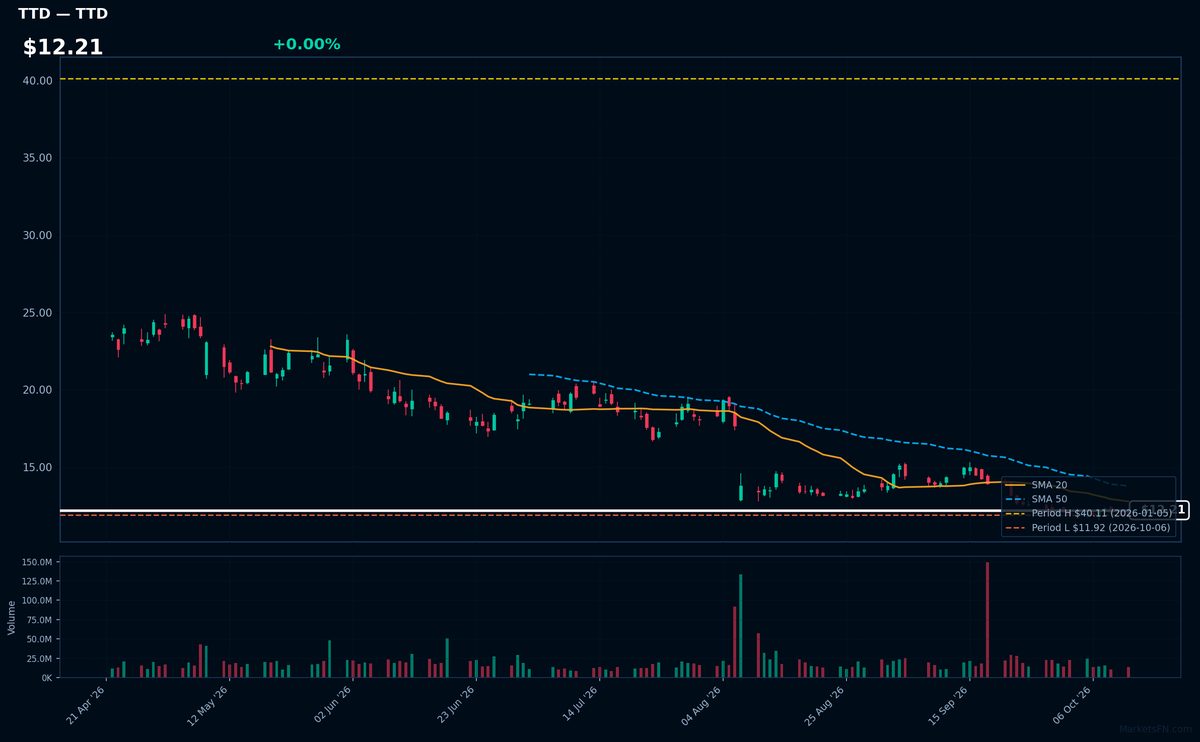
TTD | Trade Desk Inc | Communication Services | Price Last: $11.94 | % Realized: -68.31% | RSI: 38.9 | % above MA200: -45.0% | Trend: Below MA20, MA50, MA200
Trade Desk Inc operates a cloud-based ad-buying platform that automates programmatic advertising for agencies/brands. Investors care because its data-driven ad tech dominates the shift from traditional TV to CTV/streaming, with direct access to premium inventory.
TTD shows extreme technical weakness: RSI(14) at 38.9, bearish MA alignment (price < MA20 < MA50 < MA200), and -68.3% YTD decline. Testing critical support just 0.2% above 2026 lows signals high downside risk.
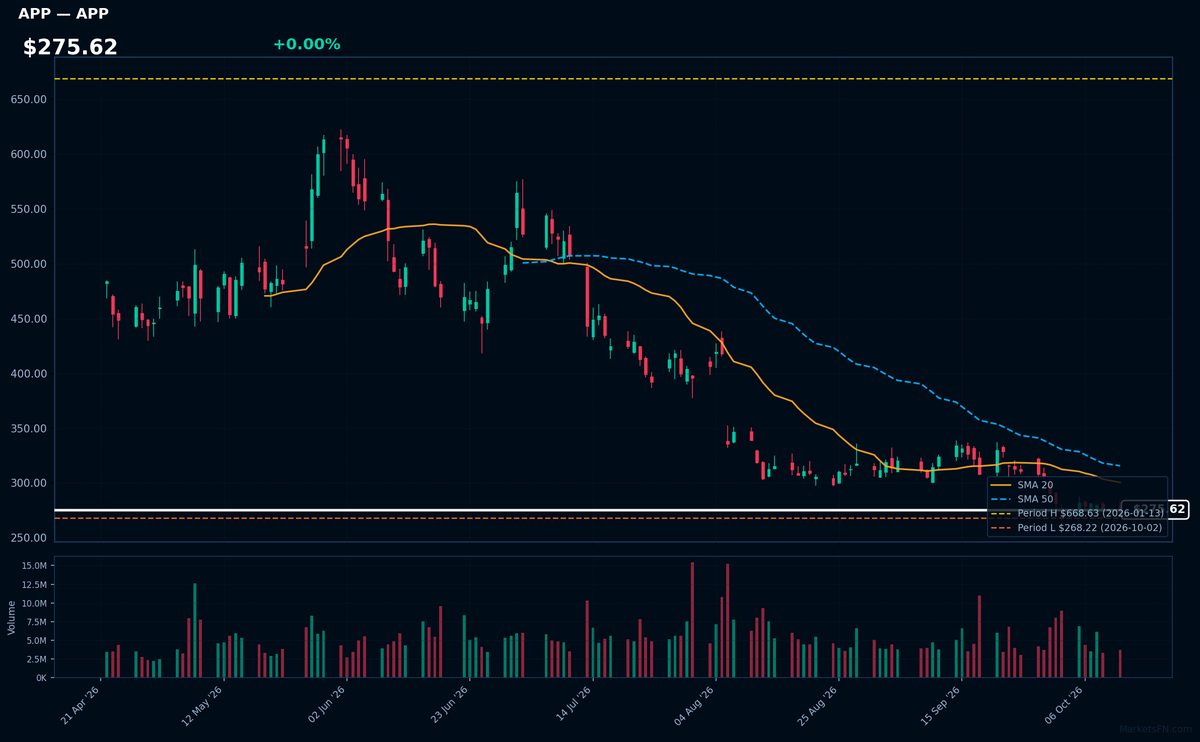
APP | Applovin Corp | Communication Services | Price Last: $270.87 | % Realized: -56.19% | RSI: 36.5 | % above MA200: -38.6% | Trend: Below MA20, MA50, MA200
Applovin operates a mobile app discovery platform and monetization tools for developers, leveraging AI-driven ad targeting. Investors care due to its exposure to high-growth mobile advertising and gaming markets, where its technology optimizes developer revenue.
Technically concerning: RSI(14) at 36.5 shows near-oversold conditions, but bearish MA alignment (price < MA20 < MA50 < MA200) and -56.2% YTD decline signal sustained downtrend. Testing critical support just 1.0% above YTD lows.
Market Commentary
The clustering of Nasdaq 100 stocks at 2026 YTD extremes reveals a stark bifurcation in tech performance. Microsoft (MSFT), Shopify (SHOP), Atlassian (TEAM), Biogen (BIIB), and Palantir (PLTR) are pinned at yearly highs, demonstrating relentless demand for AI infrastructure, cloud productivity tools, and specialized data analytics. Conversely, Copart (CPRT), Charter (CHTR), Comcast (CMCSA), Trade Desk (TTD), and AppLovin (APP) hover near lows, reflecting pressure on advertising-dependent models and legacy telecom infrastructure amid higher capital costs.
This divergence underscores two dominant themes: hyperscalers and AI enablers continue to command premium valuations due to perceived long-term growth durability, while cyclical tech and capital-intensive network operators face margin compression. Macro conditions—persistently elevated interest rates and selective risk appetite—are accelerating capital rotation toward companies with visible earnings pathways (MSFT, PLTR) while punishing leveraged cash flows (CHTR, CMCSA) and ad-tech exposed names (TTD, APP). Biogen's presence among leaders suggests healthcare-tech convergence is gaining traction.
Investors should monitor whether the AI-driven leaders can maintain momentum amid potential Fed policy shifts or growth deceleration. For laggards, stabilization in ad spend (critical for TTD, APP) and debt refinancing capabilities (CHTR, CMCSA) could signal inflection points. Any mean-reversion trade requires confirmation of fundamental catalysts—not just technical oversold conditions—given the structural forces at play.
Methodology: All 101 Nasdaq 100 constituents screened. Close prices downloaded from 2026-01-01. Period high = highest close since Jan 1 2026; period low = lowest close since Jan 1 2026. Distance = (current price / period extreme − 1) × 100. Technical indicators computed on up to 1 year of daily OHLCV data.
Disclaimer: For informational purposes only. Not investment advice. Past performance is not indicative of future results.