S&P 500 2026 YTD Highs & Lows Radar: Visa (V), TJXmpanies, (TJX) and more
MarketsFN Team

S&P 500 2026 YTD Highs & Lows Radar: Visa (V), TJXmpanies, (TJX) and more
Screening all 503 S&P 500 constituents for stocks nearest to their 2026 year-to-date high and their 2026 YTD low. Data as of August 26, 2026. % Realized = total return since Jan 1 2026.
Legend: RSI > 70 = overbought · RSI < 30 = oversold · Green % Realized = positive YTD return · Red = negative.
📈 Nearest to 2026 High
Sectors represented: Healthcare (3), Financial (1), Consumer Cyclical (1)
| Ticker | Company | Sector | Price Last | % Realized | 2026 YTD High Date | RSI | % above MA200 | Trend |
|---|---|---|---|---|---|---|---|---|
| V | Visa Inc | Financial | $384.14 | +10.87% | 2026-08-25 | 71.0 | +15.5% | Above MA20, MA50, MA200 |
| MRK | Merck & Co Inc | Healthcare | $156.45 | +46.97% | 2026-08-25 | 71.2 | +34.5% | Above MA20, MA50, MA200 |
| PFE | Pfizer Inc | Healthcare | $28.57 | +13.46% | 2026-08-25 | 67.9 | +9.7% | Above MA20, MA50, MA200 |
| DASH | DoorDash Inc | Consumer Cyclical | $233.50 | +6.24% | 2026-08-25 | 77.0 | +24.4% | Above MA20, MA50, MA200 |
| VRTX | Vertex Pharmaceuticals, Inc | Healthcare | $552.85 | +22.28% | 2026-08-25 | 67.4 | +19.7% | Above MA20, MA50, MA200 |
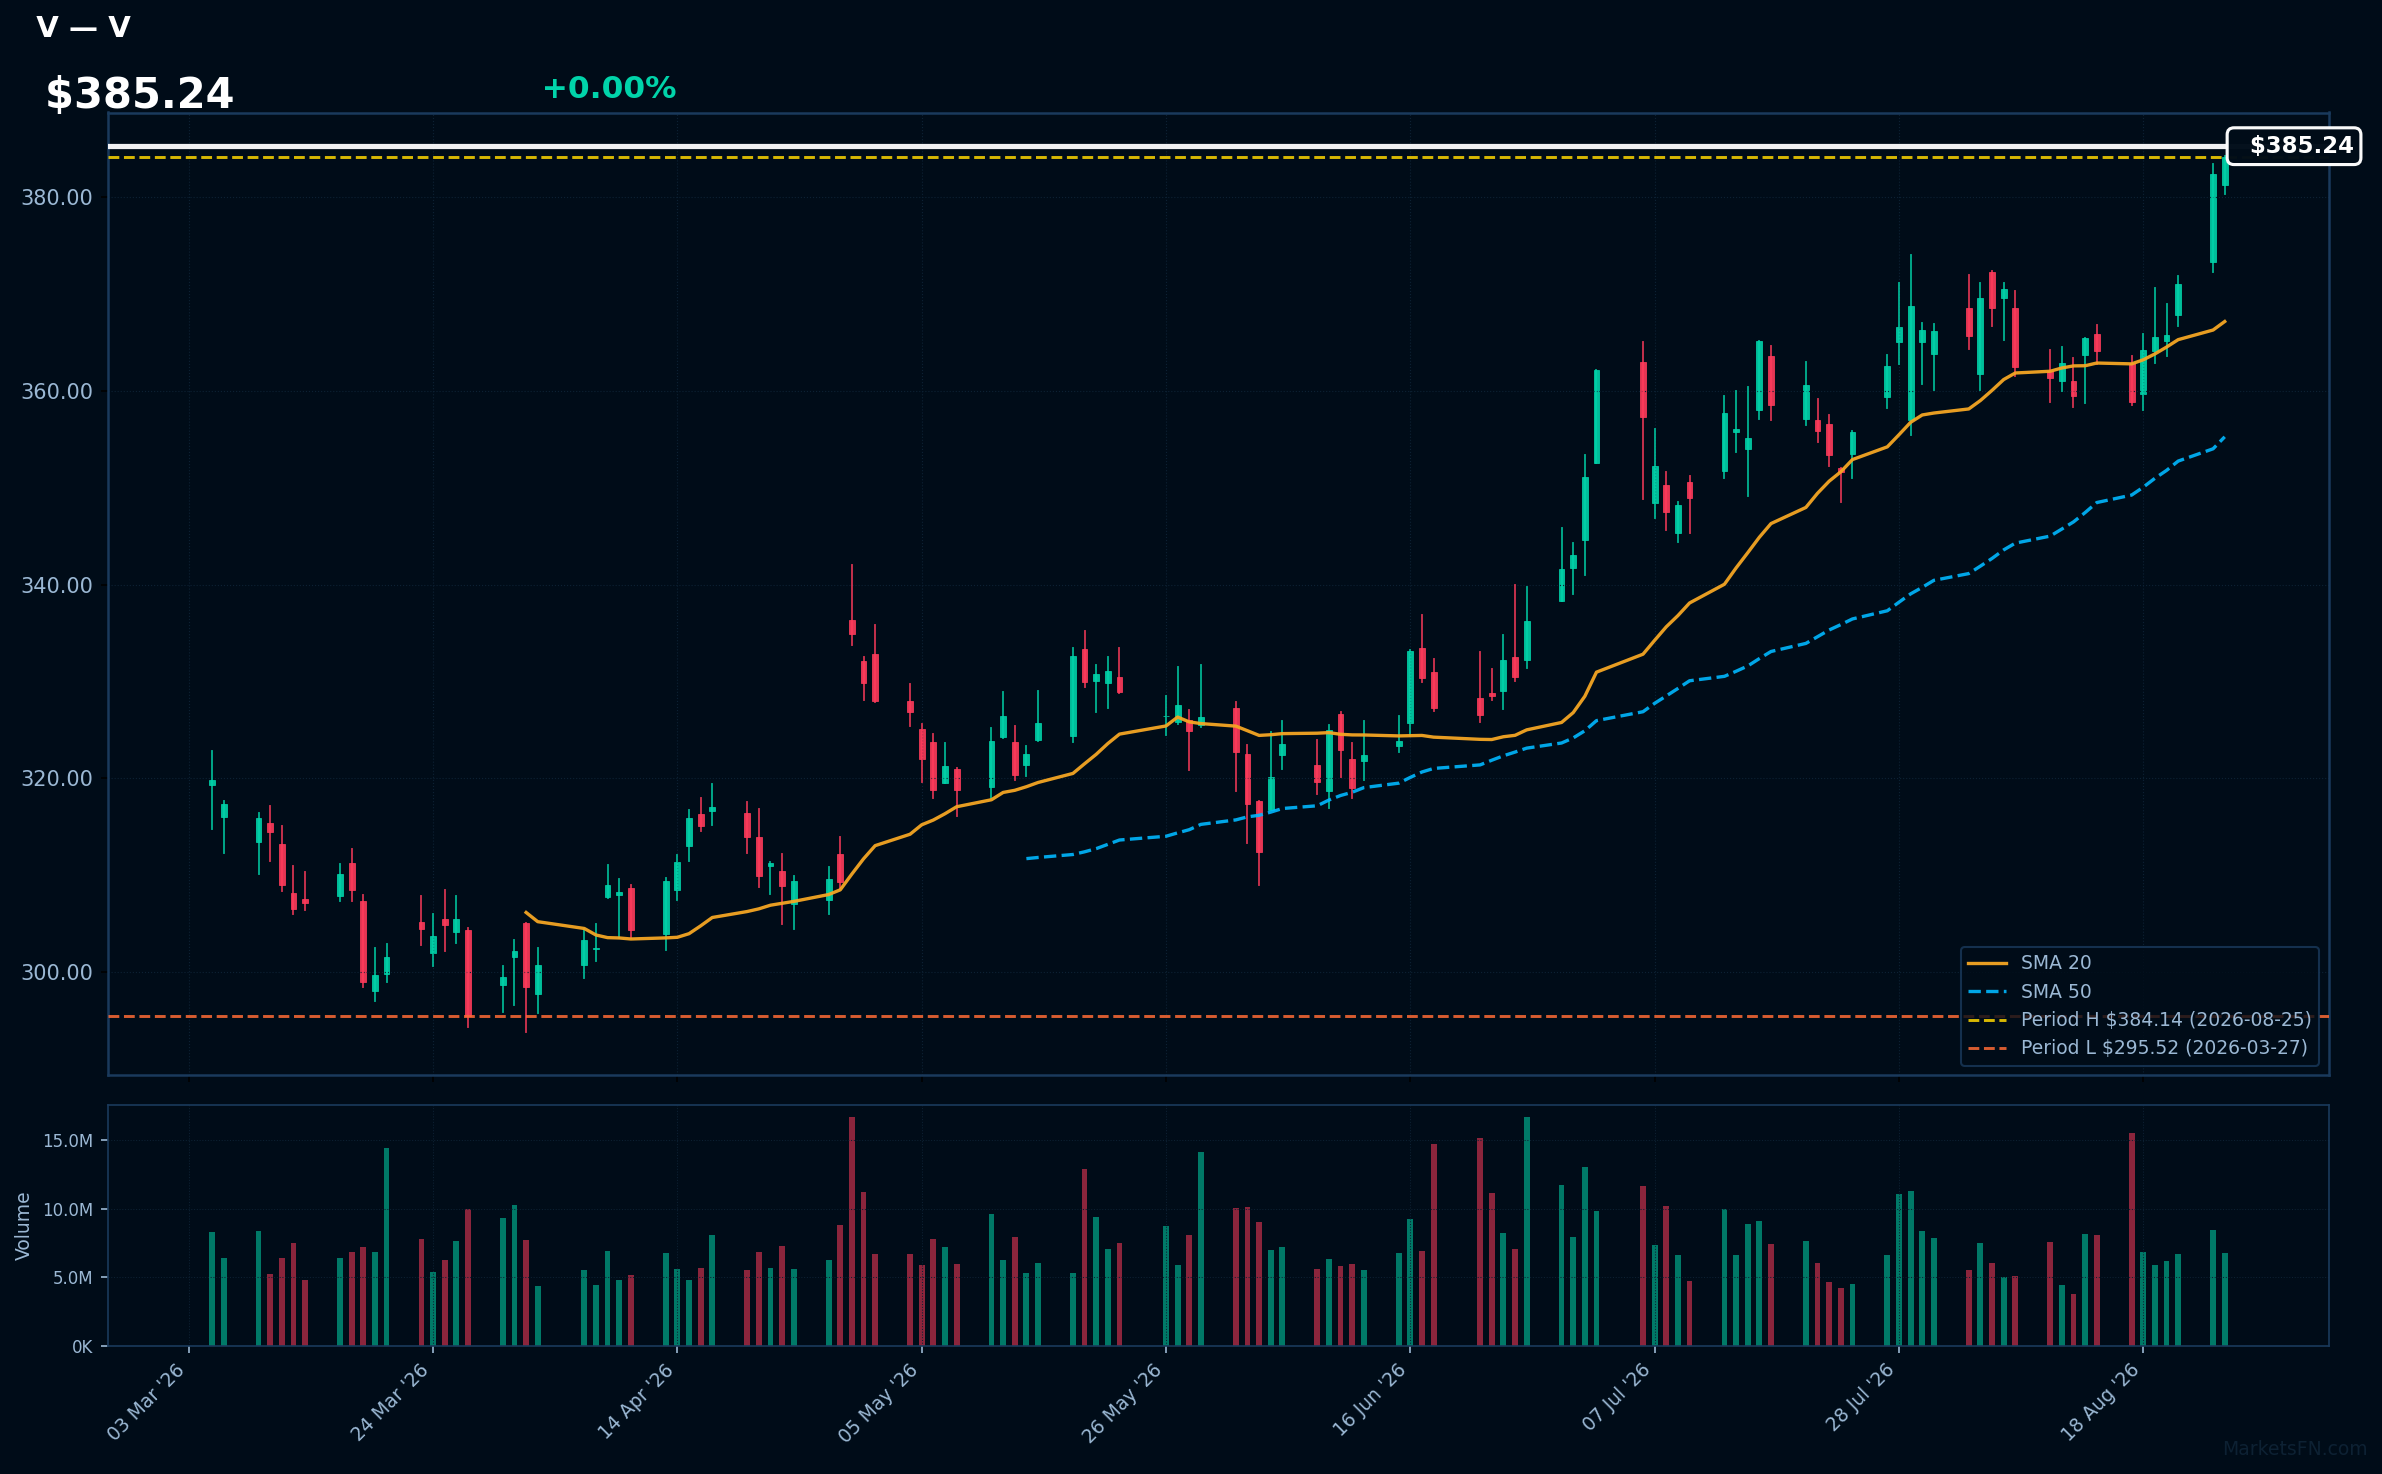
V | Visa Inc | Financial | Price Last: $384.14 | % Realized: +10.87% | RSI: 71.0 | % above MA200: +15.5% | Trend: Above MA20, MA50, MA200
Visa Inc operates a global payments technology network, facilitating digital payments between consumers, merchants, and financial institutions. Investors should care due to its critical role in the growing e-commerce sector and consistent revenue generation from transaction fees.
Visa's current RSI is 71.0, indicating overbought conditions. The bullish MA alignment (price > MA20 > MA50 > MA200) suggests strong momentum, with the stock 0.0% below its 2026 YTD high.
Related headlines
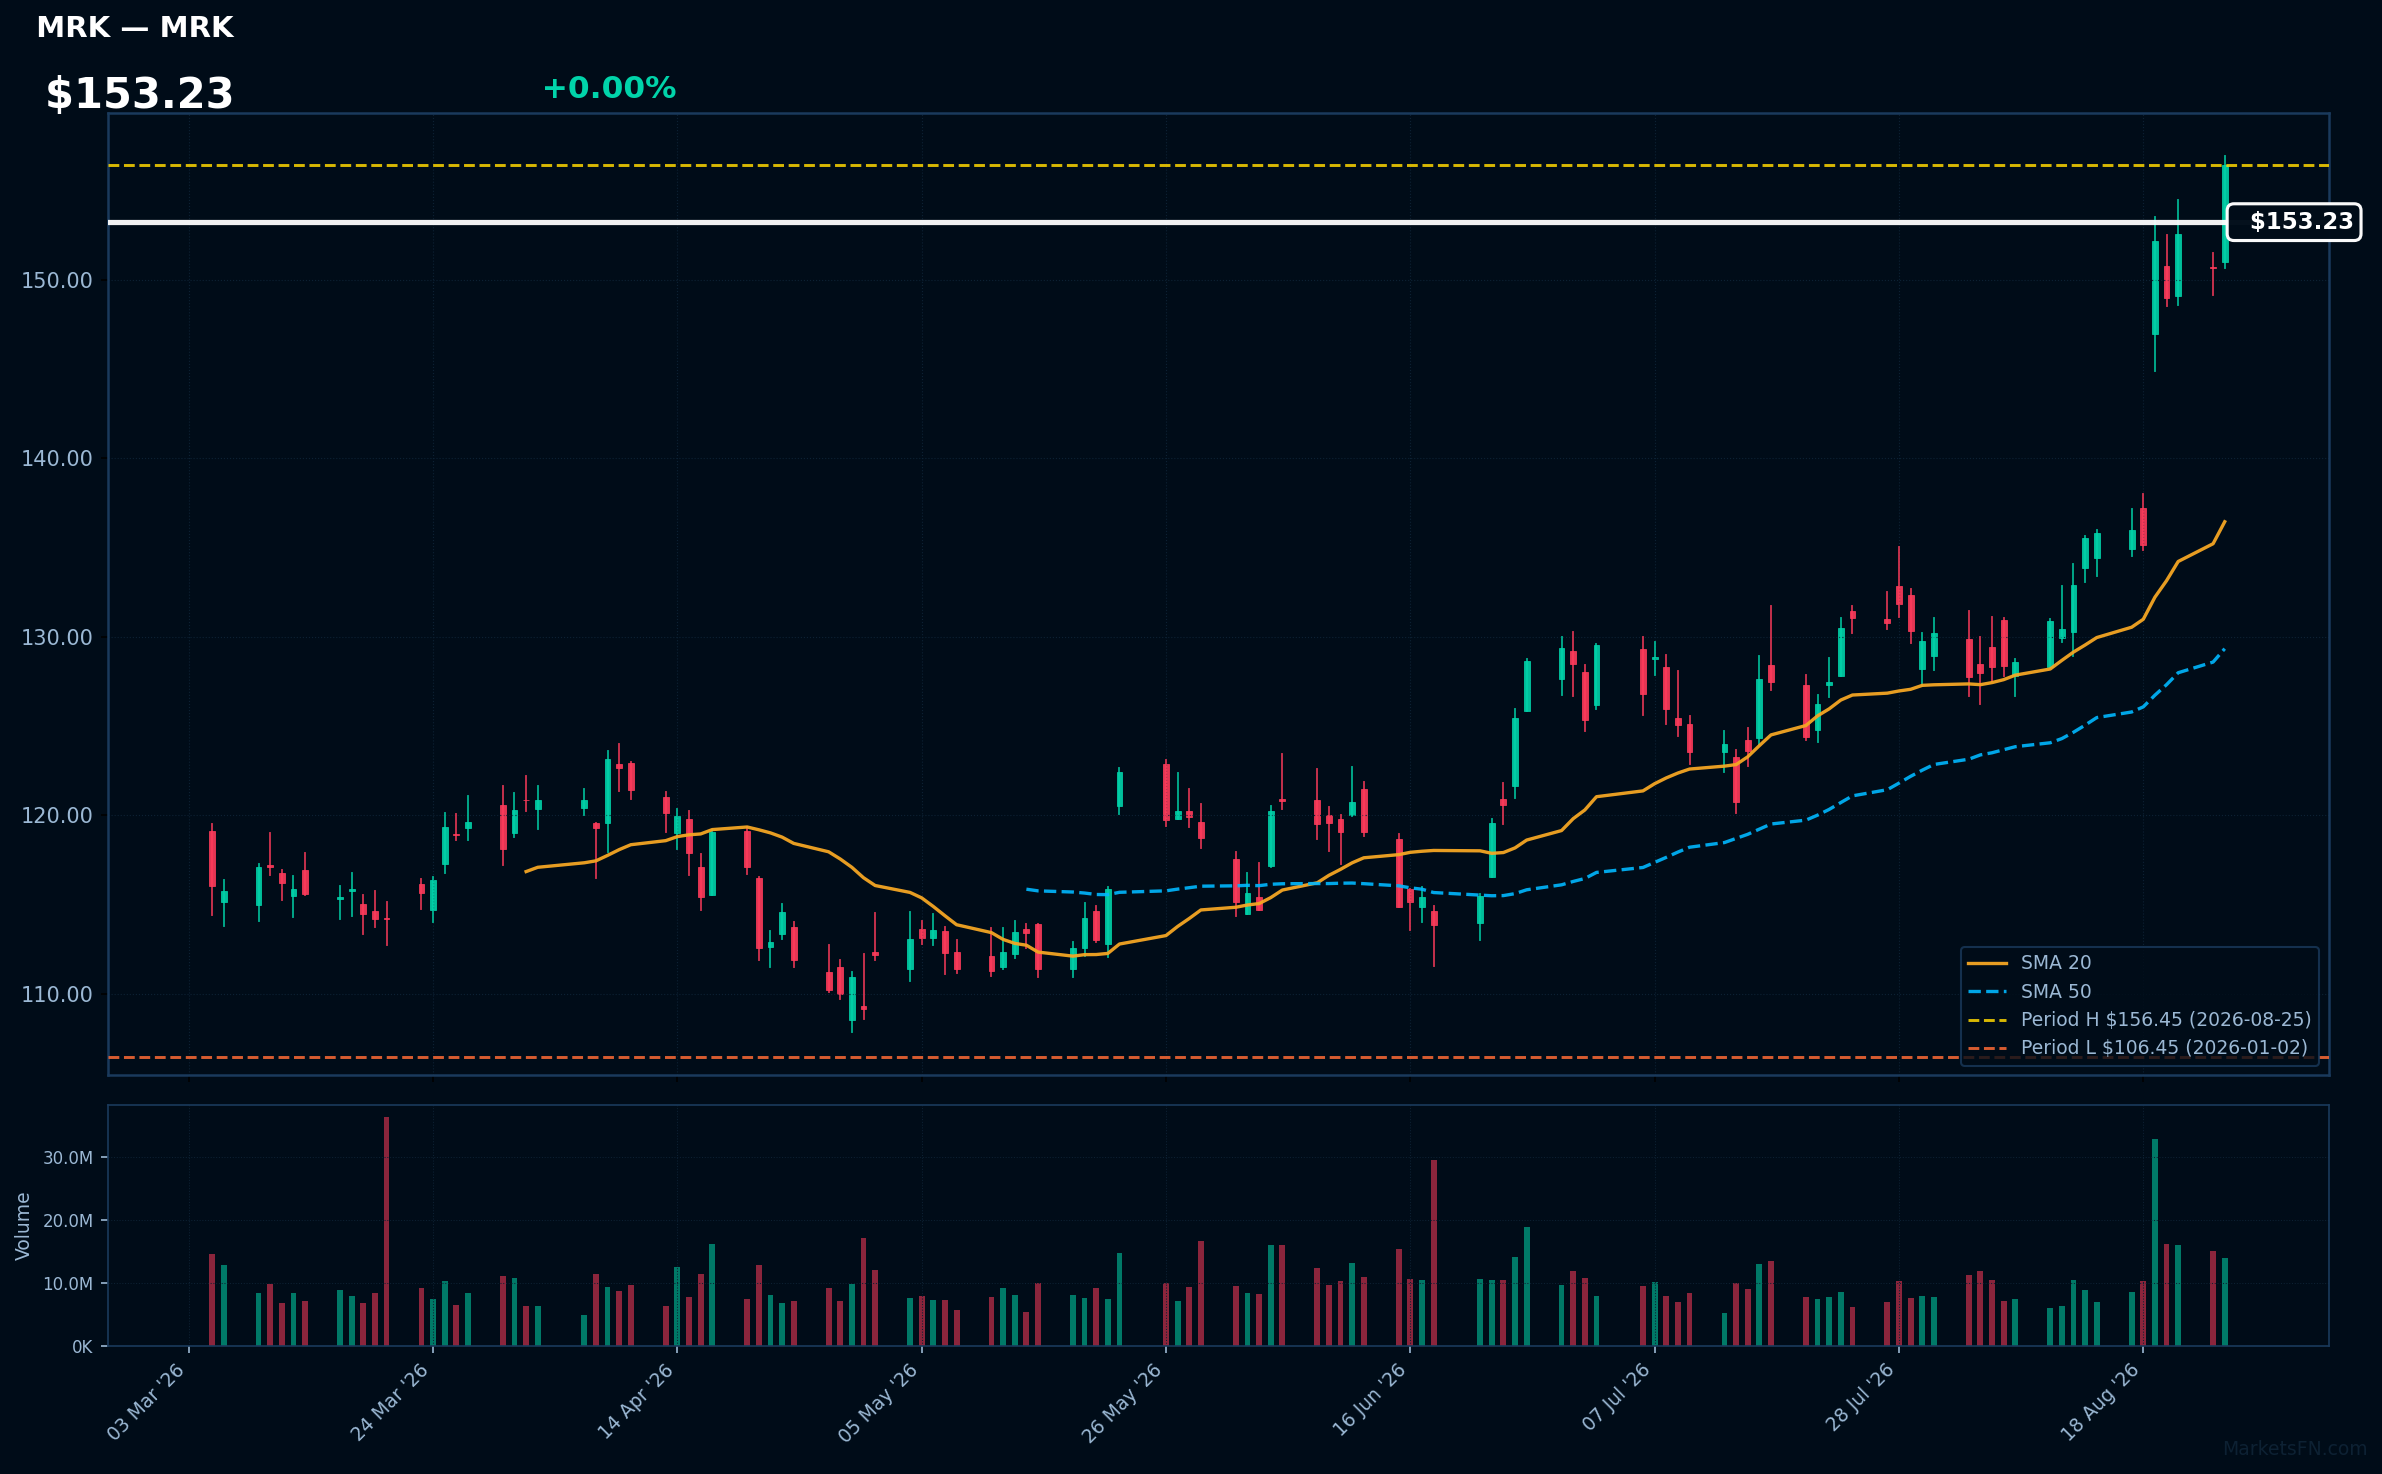
MRK | Merck & Co Inc | Healthcare | Price Last: $156.45 | % Realized: +46.97% | RSI: 71.2 | % above MA200: +34.5% | Trend: Above MA20, MA50, MA200
Merck & Co Inc develops innovative pharmaceuticals and vaccines, focusing on areas like oncology, infectious diseases, and immunology. Investors should care due to its strong pipeline and market position, which can drive future growth and profitability.
Currently, MRK shows bullish momentum with an RSI(14) of 71.2 and a strong MA alignment: price > MA20 > MA50 > MA200. It's 0.0% below its 2026 YTD high, indicating a potential breakout.
Related headlines
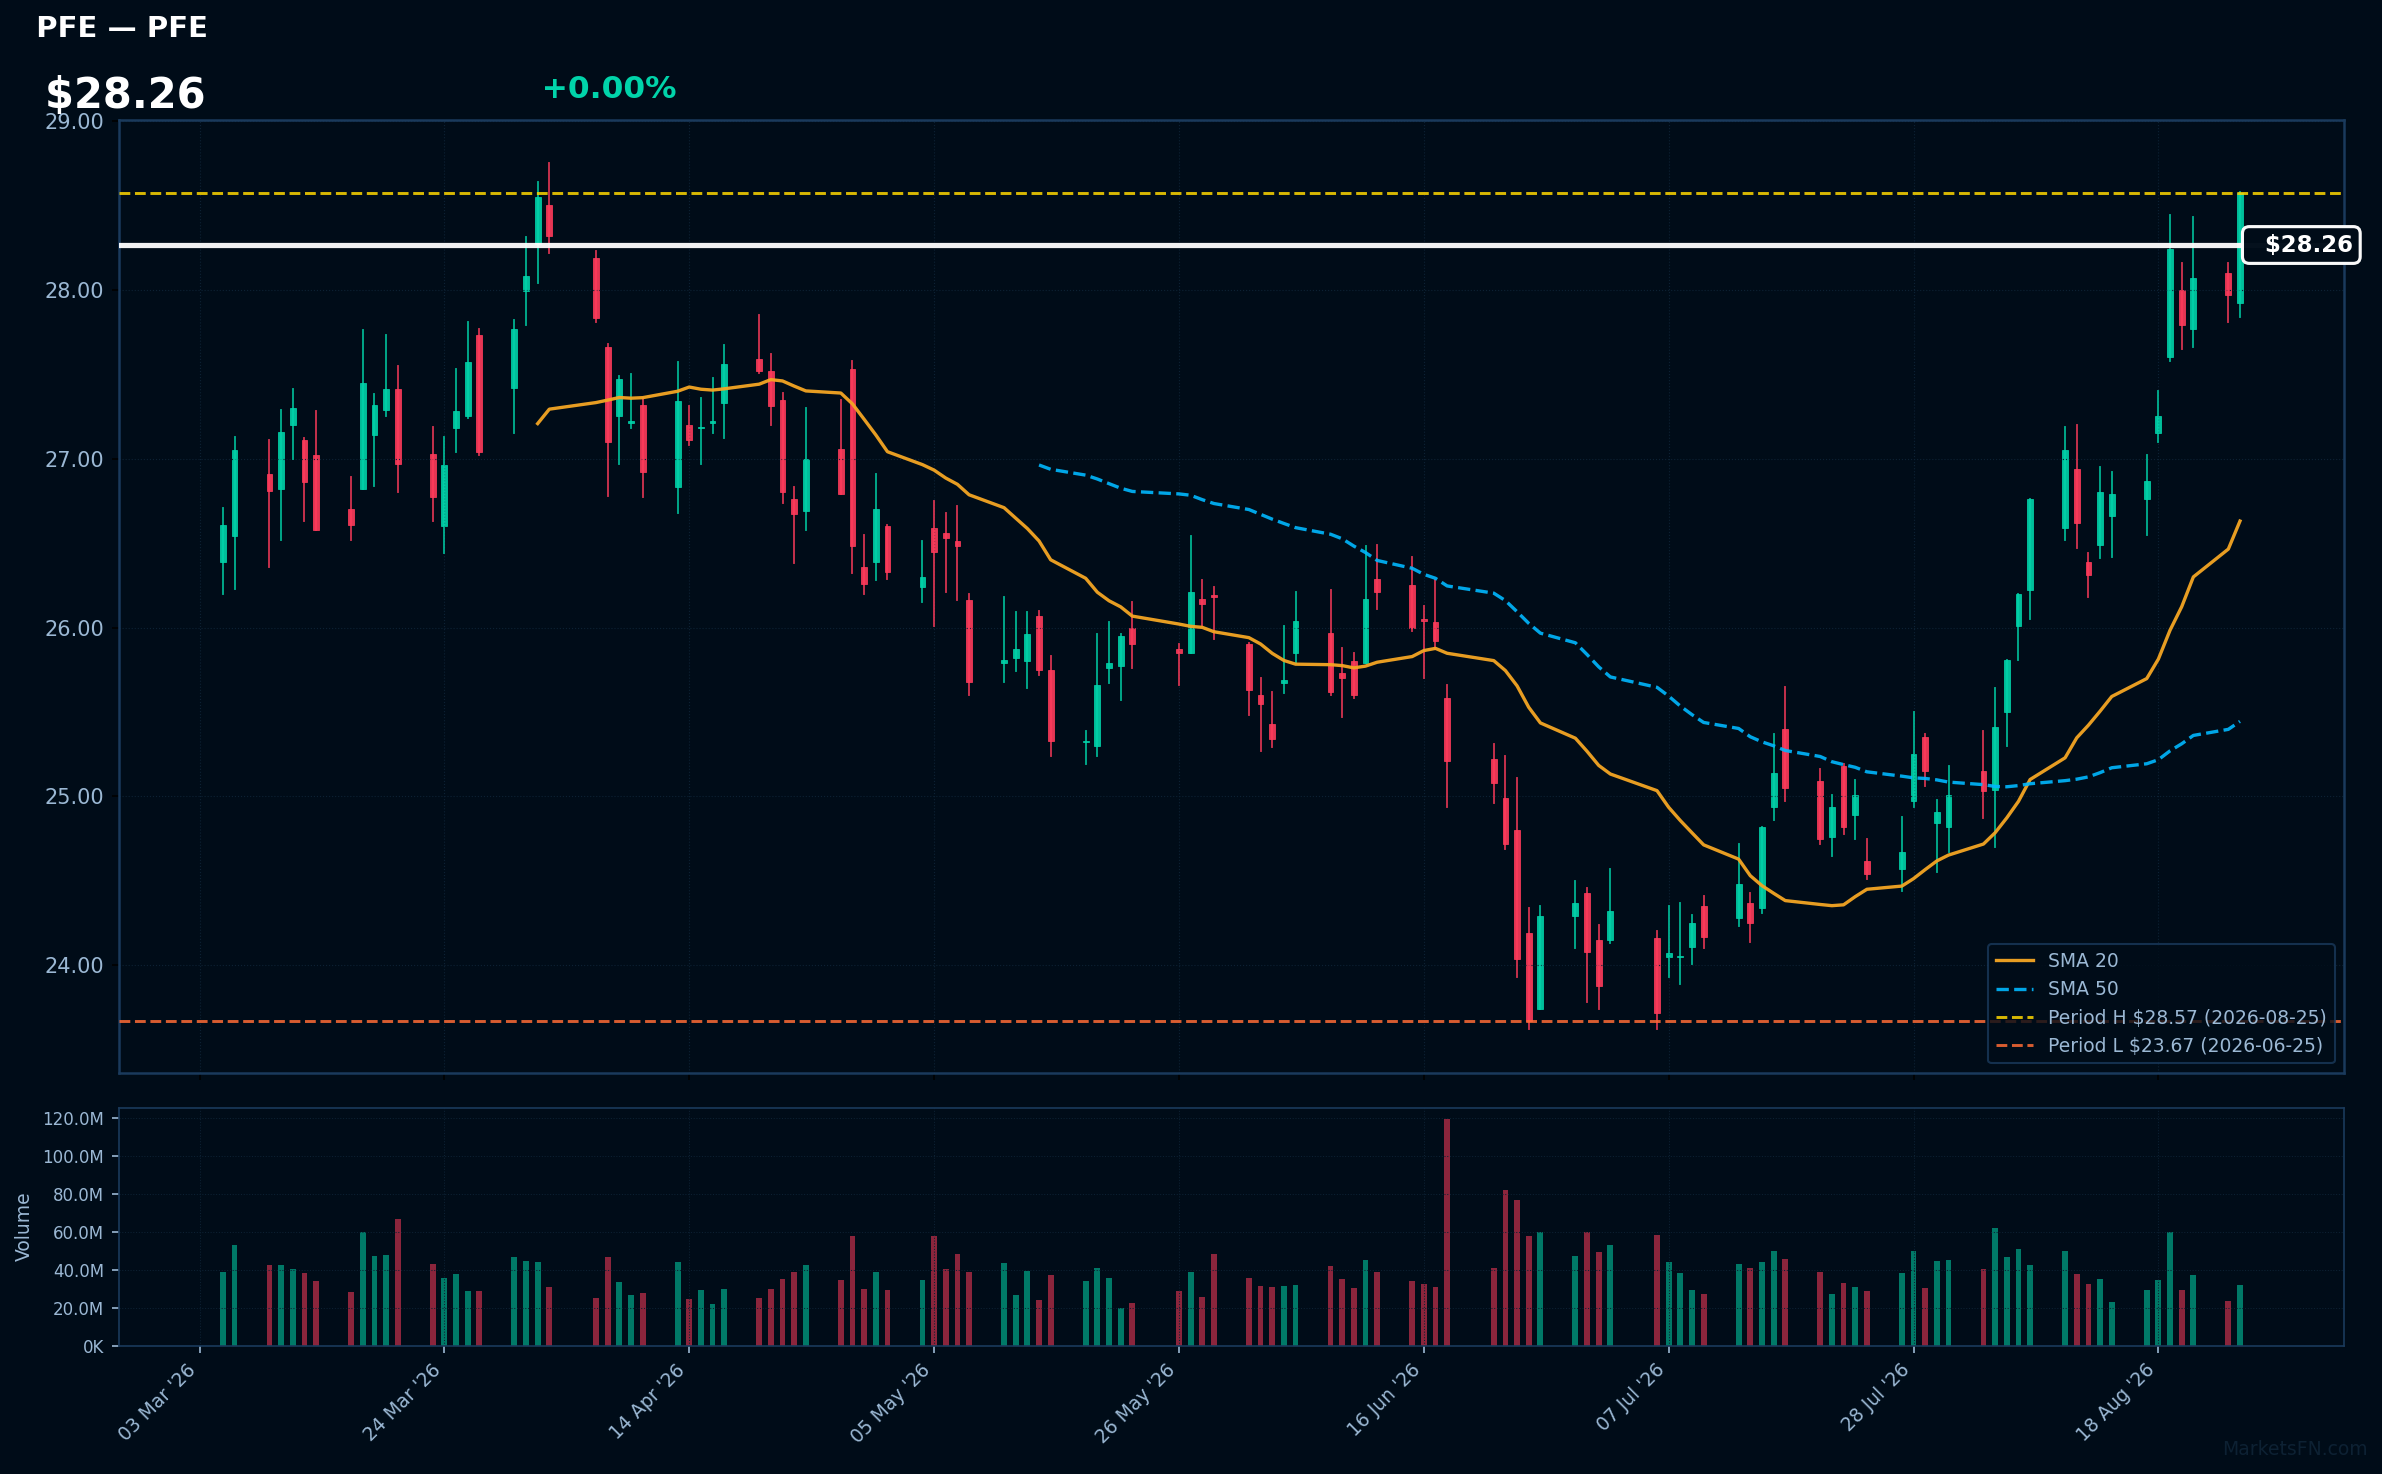
PFE | Pfizer Inc | Healthcare | Price Last: $28.57 | % Realized: +13.46% | RSI: 67.9 | % above MA200: +9.7% | Trend: Above MA20, MA50, MA200
Pfizer Inc (PFE) is a global biopharmaceutical company known for its innovative medicines and vaccines, including its COVID-19 vaccine. Investors should care due to its strong pipeline and potential for growth in the healthcare sector, especially as global health needs evolve.
Currently, PFE shows mixed technical signals with an RSI(14) of 67.9, indicating momentum, while being 0.0% below its 2026 YTD high. Price is above MA20/MA50/MA200, suggesting potential bullish trends.
Related headlines
- Pfizer Stock Is A Race Between New Drugs And Old Patents
- EMA validates Pfizer and Valneva's Lyme disease vaccine
- Pfizer CEO Caps Post-Earnings Insider Buying Spree With $1 Million Stock Purchase
- Pfizer and Valneva's Lyme Disease Vaccine Candidate Marketing Authorization Application Validated by European Medicines Agency
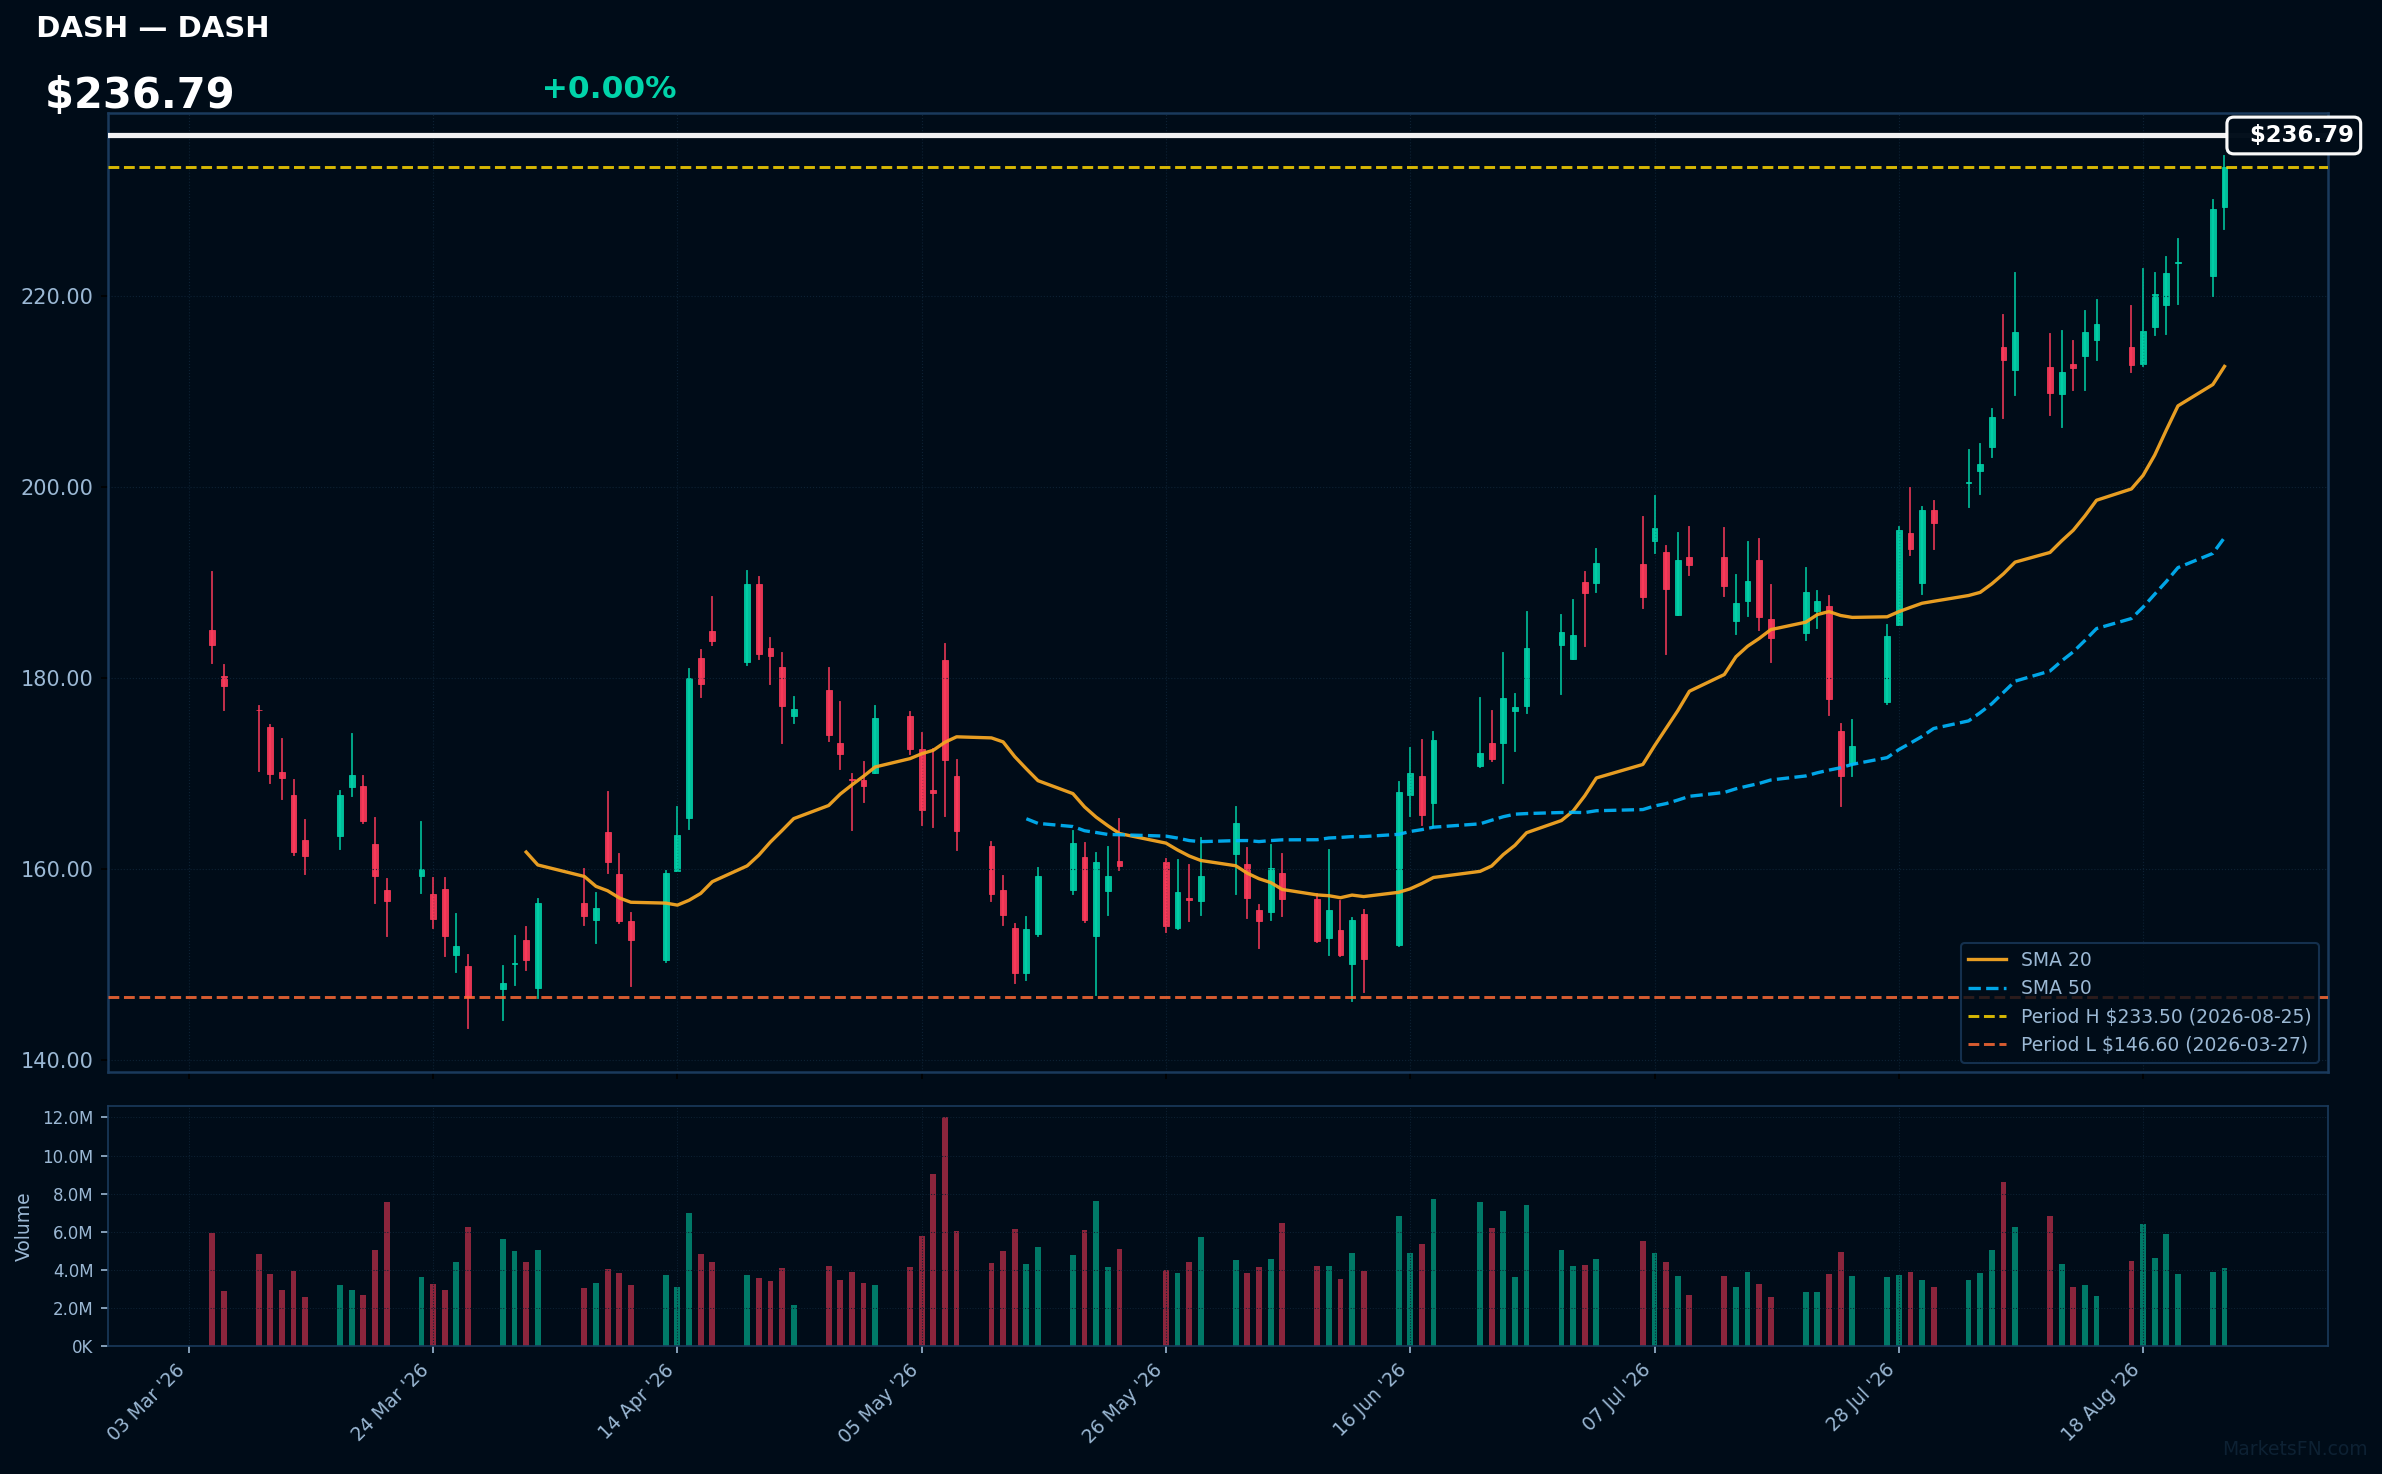
DASH | DoorDash Inc | Consumer Cyclical | Price Last: $233.50 | % Realized: +6.24% | RSI: 77.0 | % above MA200: +24.4% | Trend: Above MA20, MA50, MA200
DoorDash Inc (DASH) operates a food delivery service, connecting consumers with local restaurants. Investors should care due to its significant market presence and growth potential in the expanding online food delivery sector.
The current technical situation shows bullish momentum with an RSI of 77.0 and a strong MA alignment: price > MA20 > MA50 > MA200, indicating a sustained uptrend.
Related headlines
- Amazon, Uber, DoorDash, and Walmart are taking the delivery wars to the skies
- Gap and Gap Factory Land on DoorDash Just in Time for First-Day Fits
- Serve Robotics shares jump as DoorDash and Grubhub partnerships expand
- SERV Stock Rallies On Grubhub Partnership, DoorDash Deal Expansion CEO Calls It 'Clearest Signal Yet Of Where We're Headed'
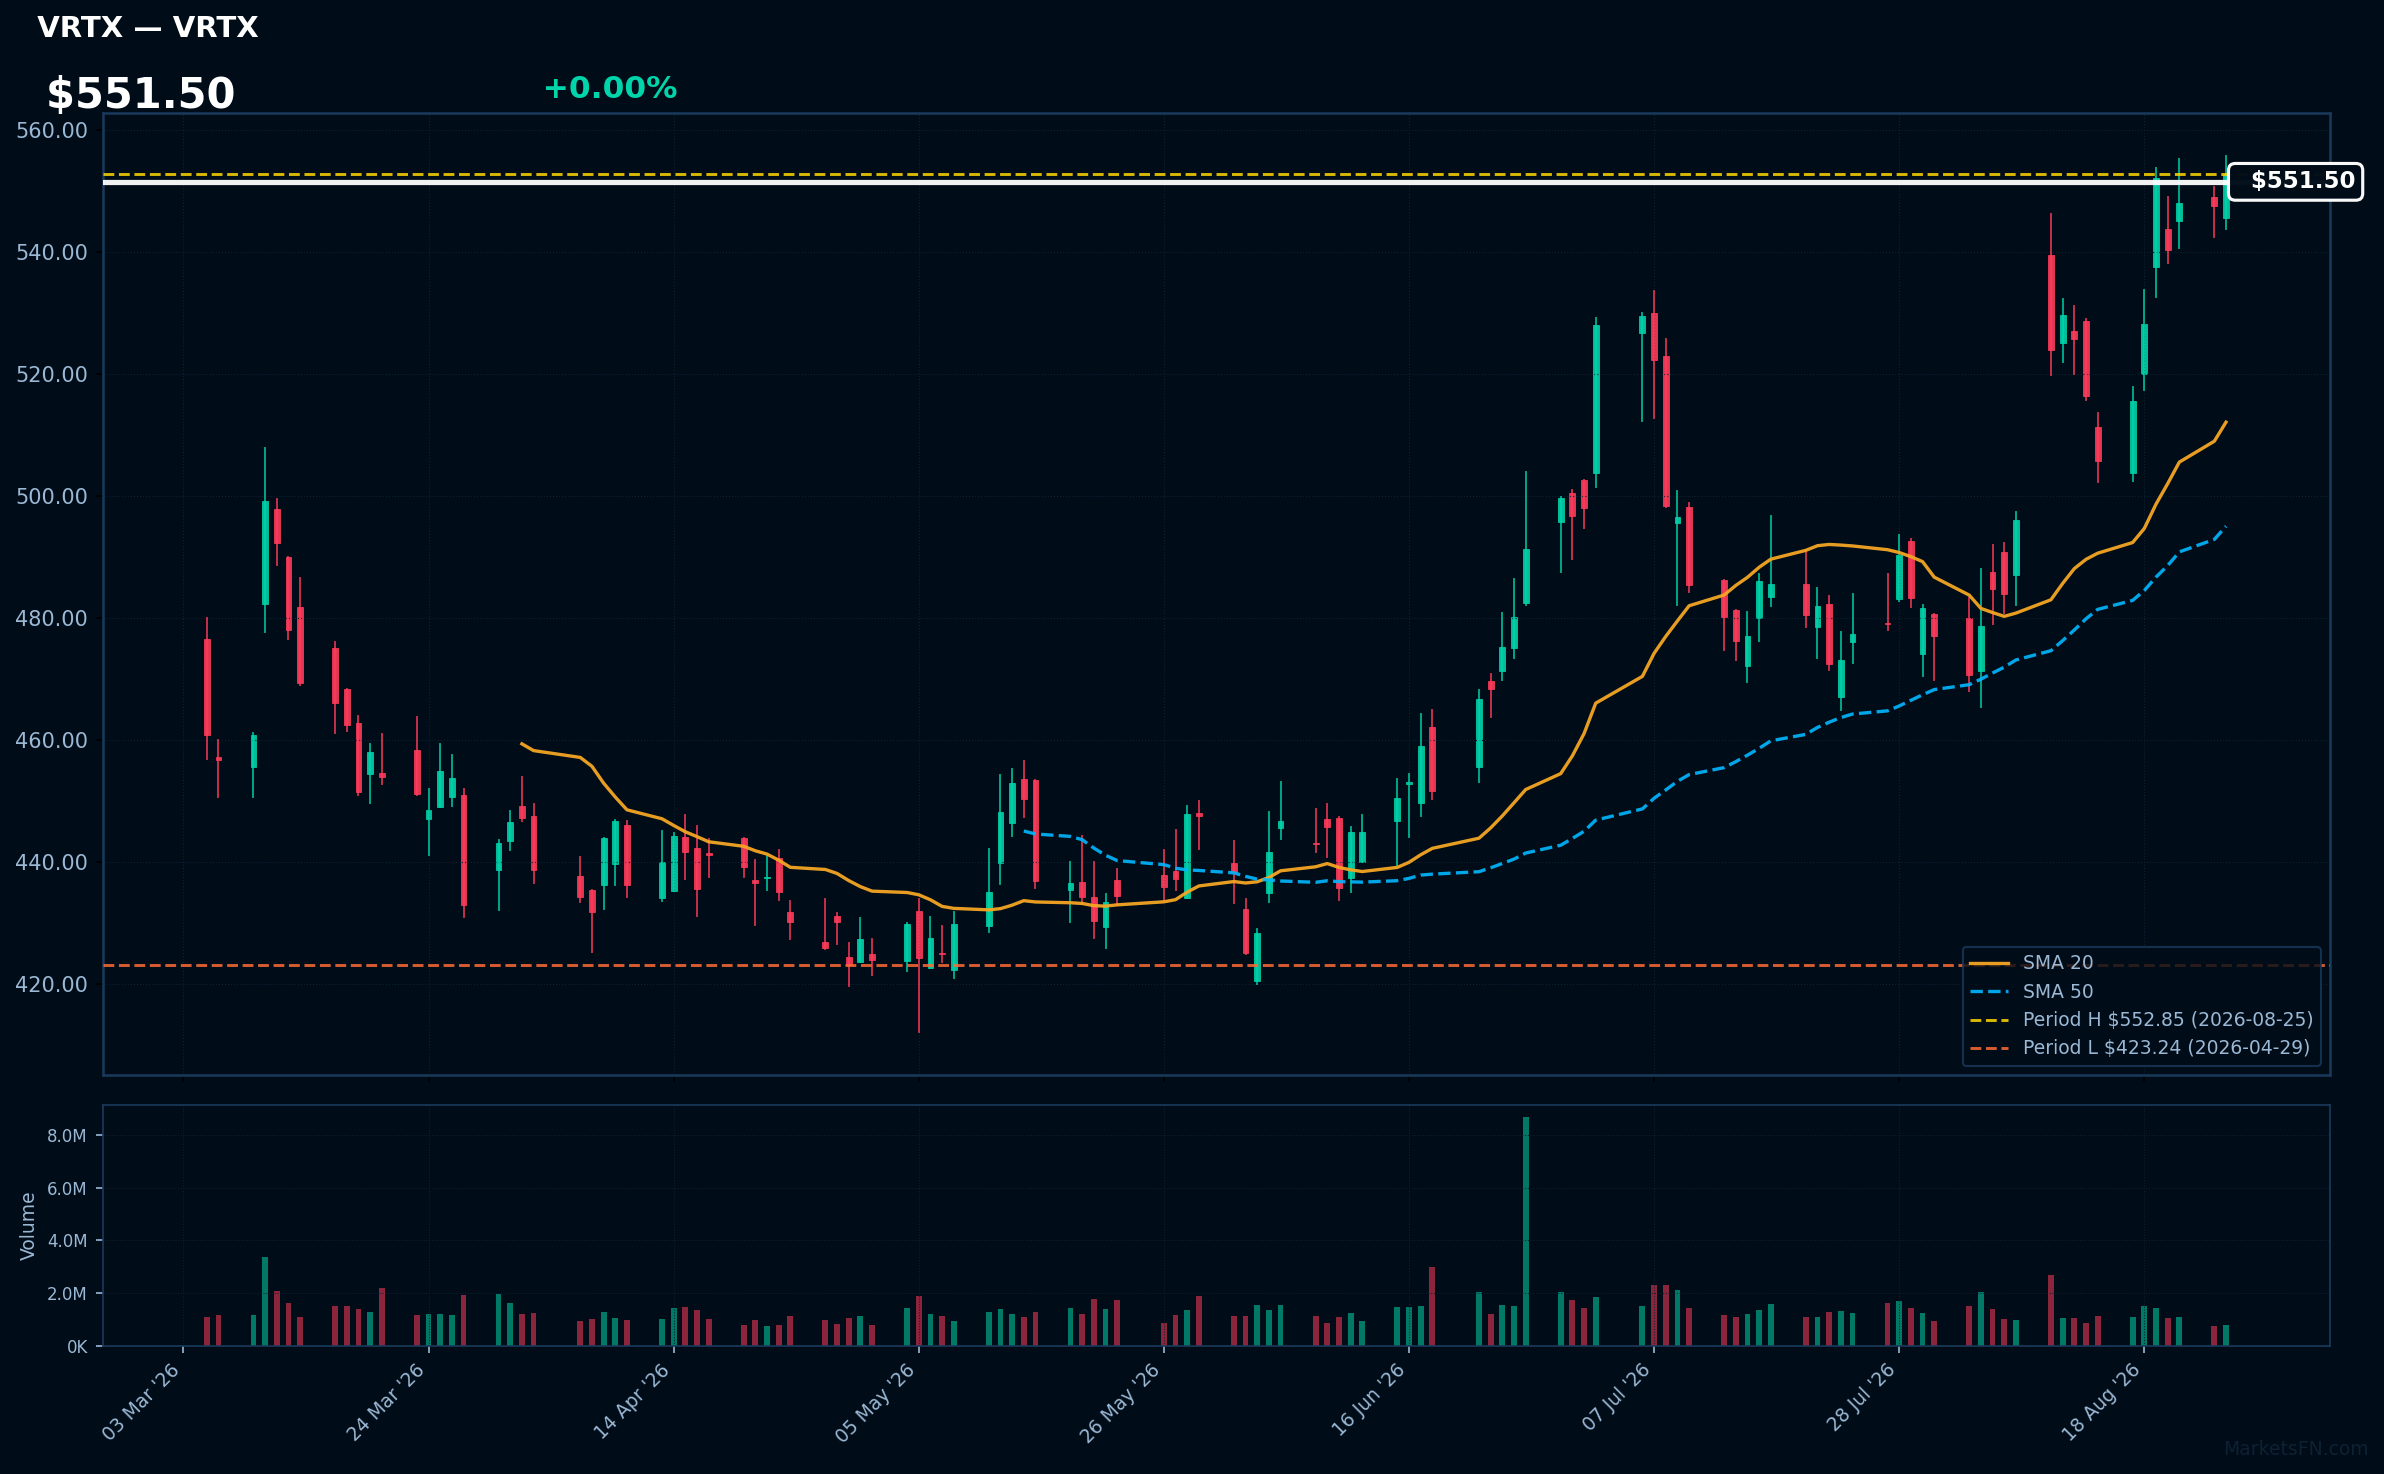
VRTX | Vertex Pharmaceuticals, Inc | Healthcare | Price Last: $552.85 | % Realized: +22.28% | RSI: 67.4 | % above MA200: +19.7% | Trend: Above MA20, MA50, MA200
Vertex Pharmaceuticals, Inc. specializes in developing therapies for cystic fibrosis and other serious diseases. Investors should care due to its innovative pipeline and strong market position, which can drive significant revenue growth and shareholder value.
The current technical situation shows bullish momentum with an RSI(14) of 67.4 and a bullish MA alignment: price > MA20 > MA50 > MA200. The stock is also 0.0% below its 2026 YTD high.
Related headlines
📉 Nearest to 2026 Low
Sectors represented: Consumer Cyclical (2), Industrials (2), Real Estate (1)
| Ticker | Company | Sector | Price Last | % Realized | 2026 YTD Low Date | RSI | % above MA200 | Trend |
|---|---|---|---|---|---|---|---|---|
| TJX | TJX Companies, Inc | Consumer Cyclical | $139.48 | -9.59% | 2026-08-25 | 23.9 | -10.1% | Below MA20, MA50, MA200 |
| LHX | L3Harris Technologies Inc | Industrials | $262.17 | -13.90% | 2026-08-25 | 33.6 | -16.8% | Below MA20, MA50, MA200 |
| EQR | Equity Residential Properties Trust | Real Estate | $63.66 | -7.74% | 2026-08-17 | 21.2 | — | — |
| LII | Lennox International Inc | Industrials | $389.06 | -22.02% | 2026-08-25 | 29.0 | -22.4% | Below MA20, MA50, MA200 |
| DECK | Deckers Outdoor Corp | Consumer Cyclical | $88.74 | -16.90% | 2026-08-25 | 37.3 | -13.4% | Below MA20, MA50, MA200 |
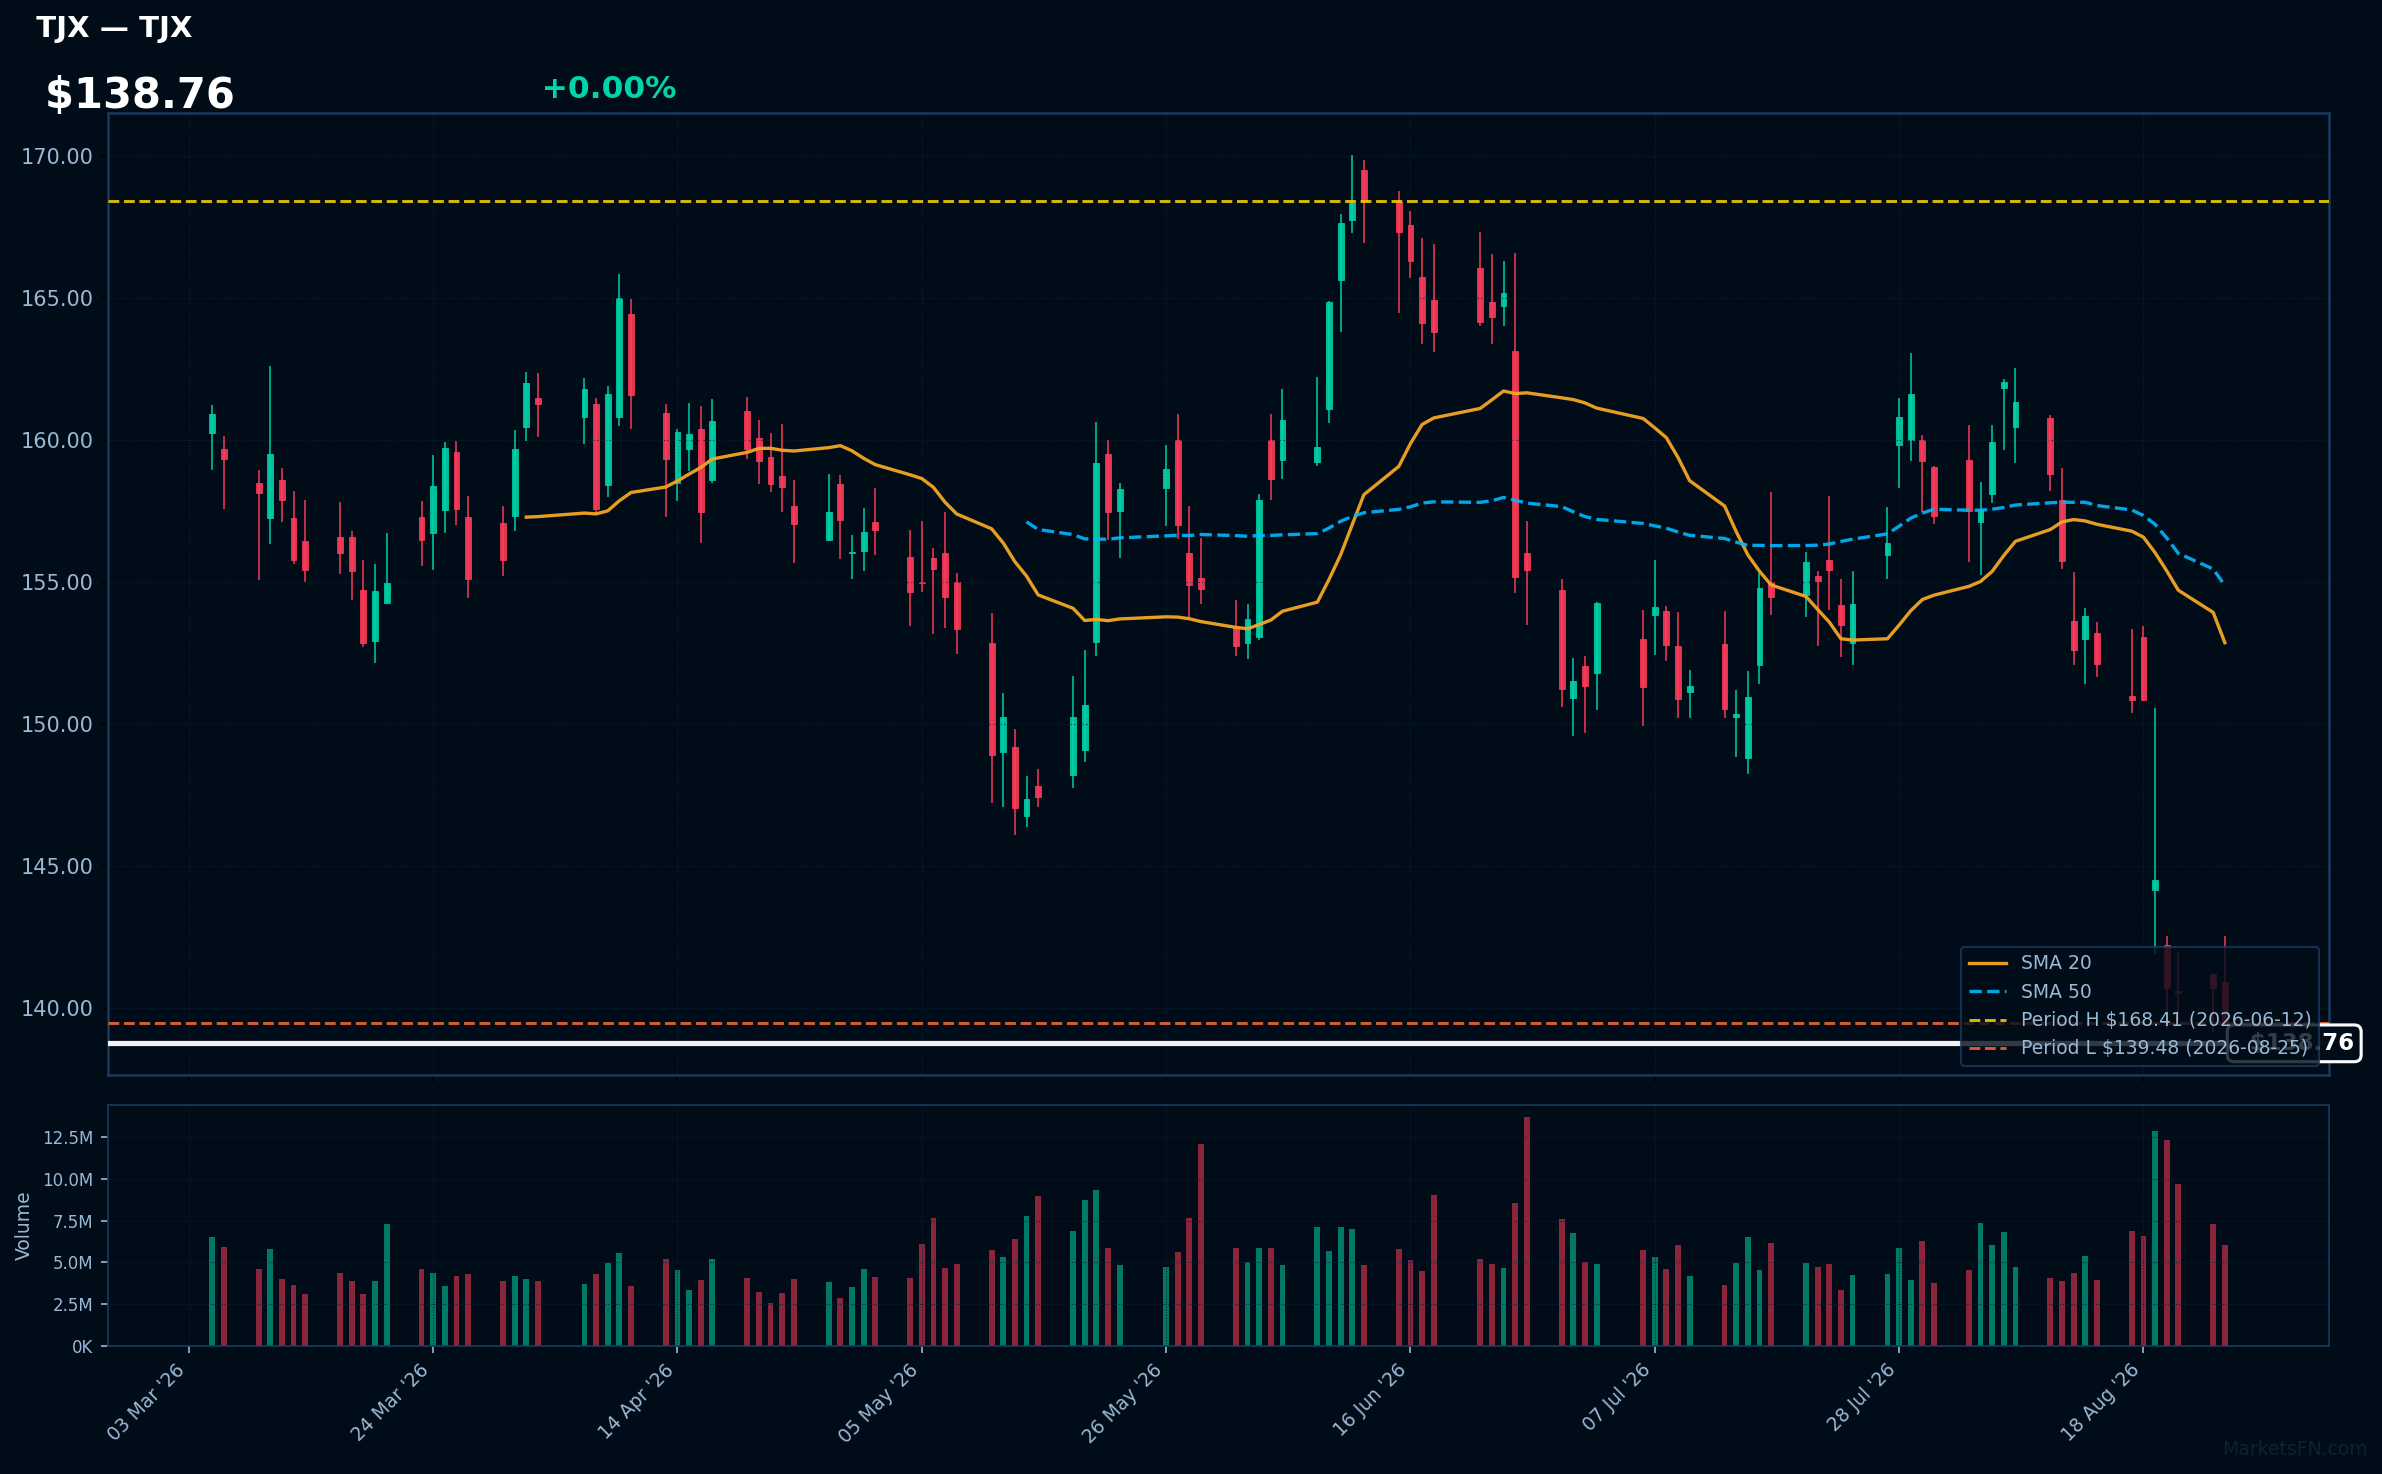
TJX | TJX Companies, Inc | Consumer Cyclical | Price Last: $139.48 | % Realized: -9.59% | RSI: 23.9 | % above MA200: -10.1% | Trend: Below MA20, MA50, MA200
TJX Companies, Inc operates off-price retail chains, including T.J. Maxx and Marshalls, offering brand-name apparel and home goods at discounted prices. Investors should care due to its resilience in economic downturns, appealing to cost-conscious consumers.
The current technical situation indicates a bearish trend, with an RSI(14) of 23.9 and a MA alignment of price < MA20 < MA50 < MA200, signaling potential further declines.
Related headlines
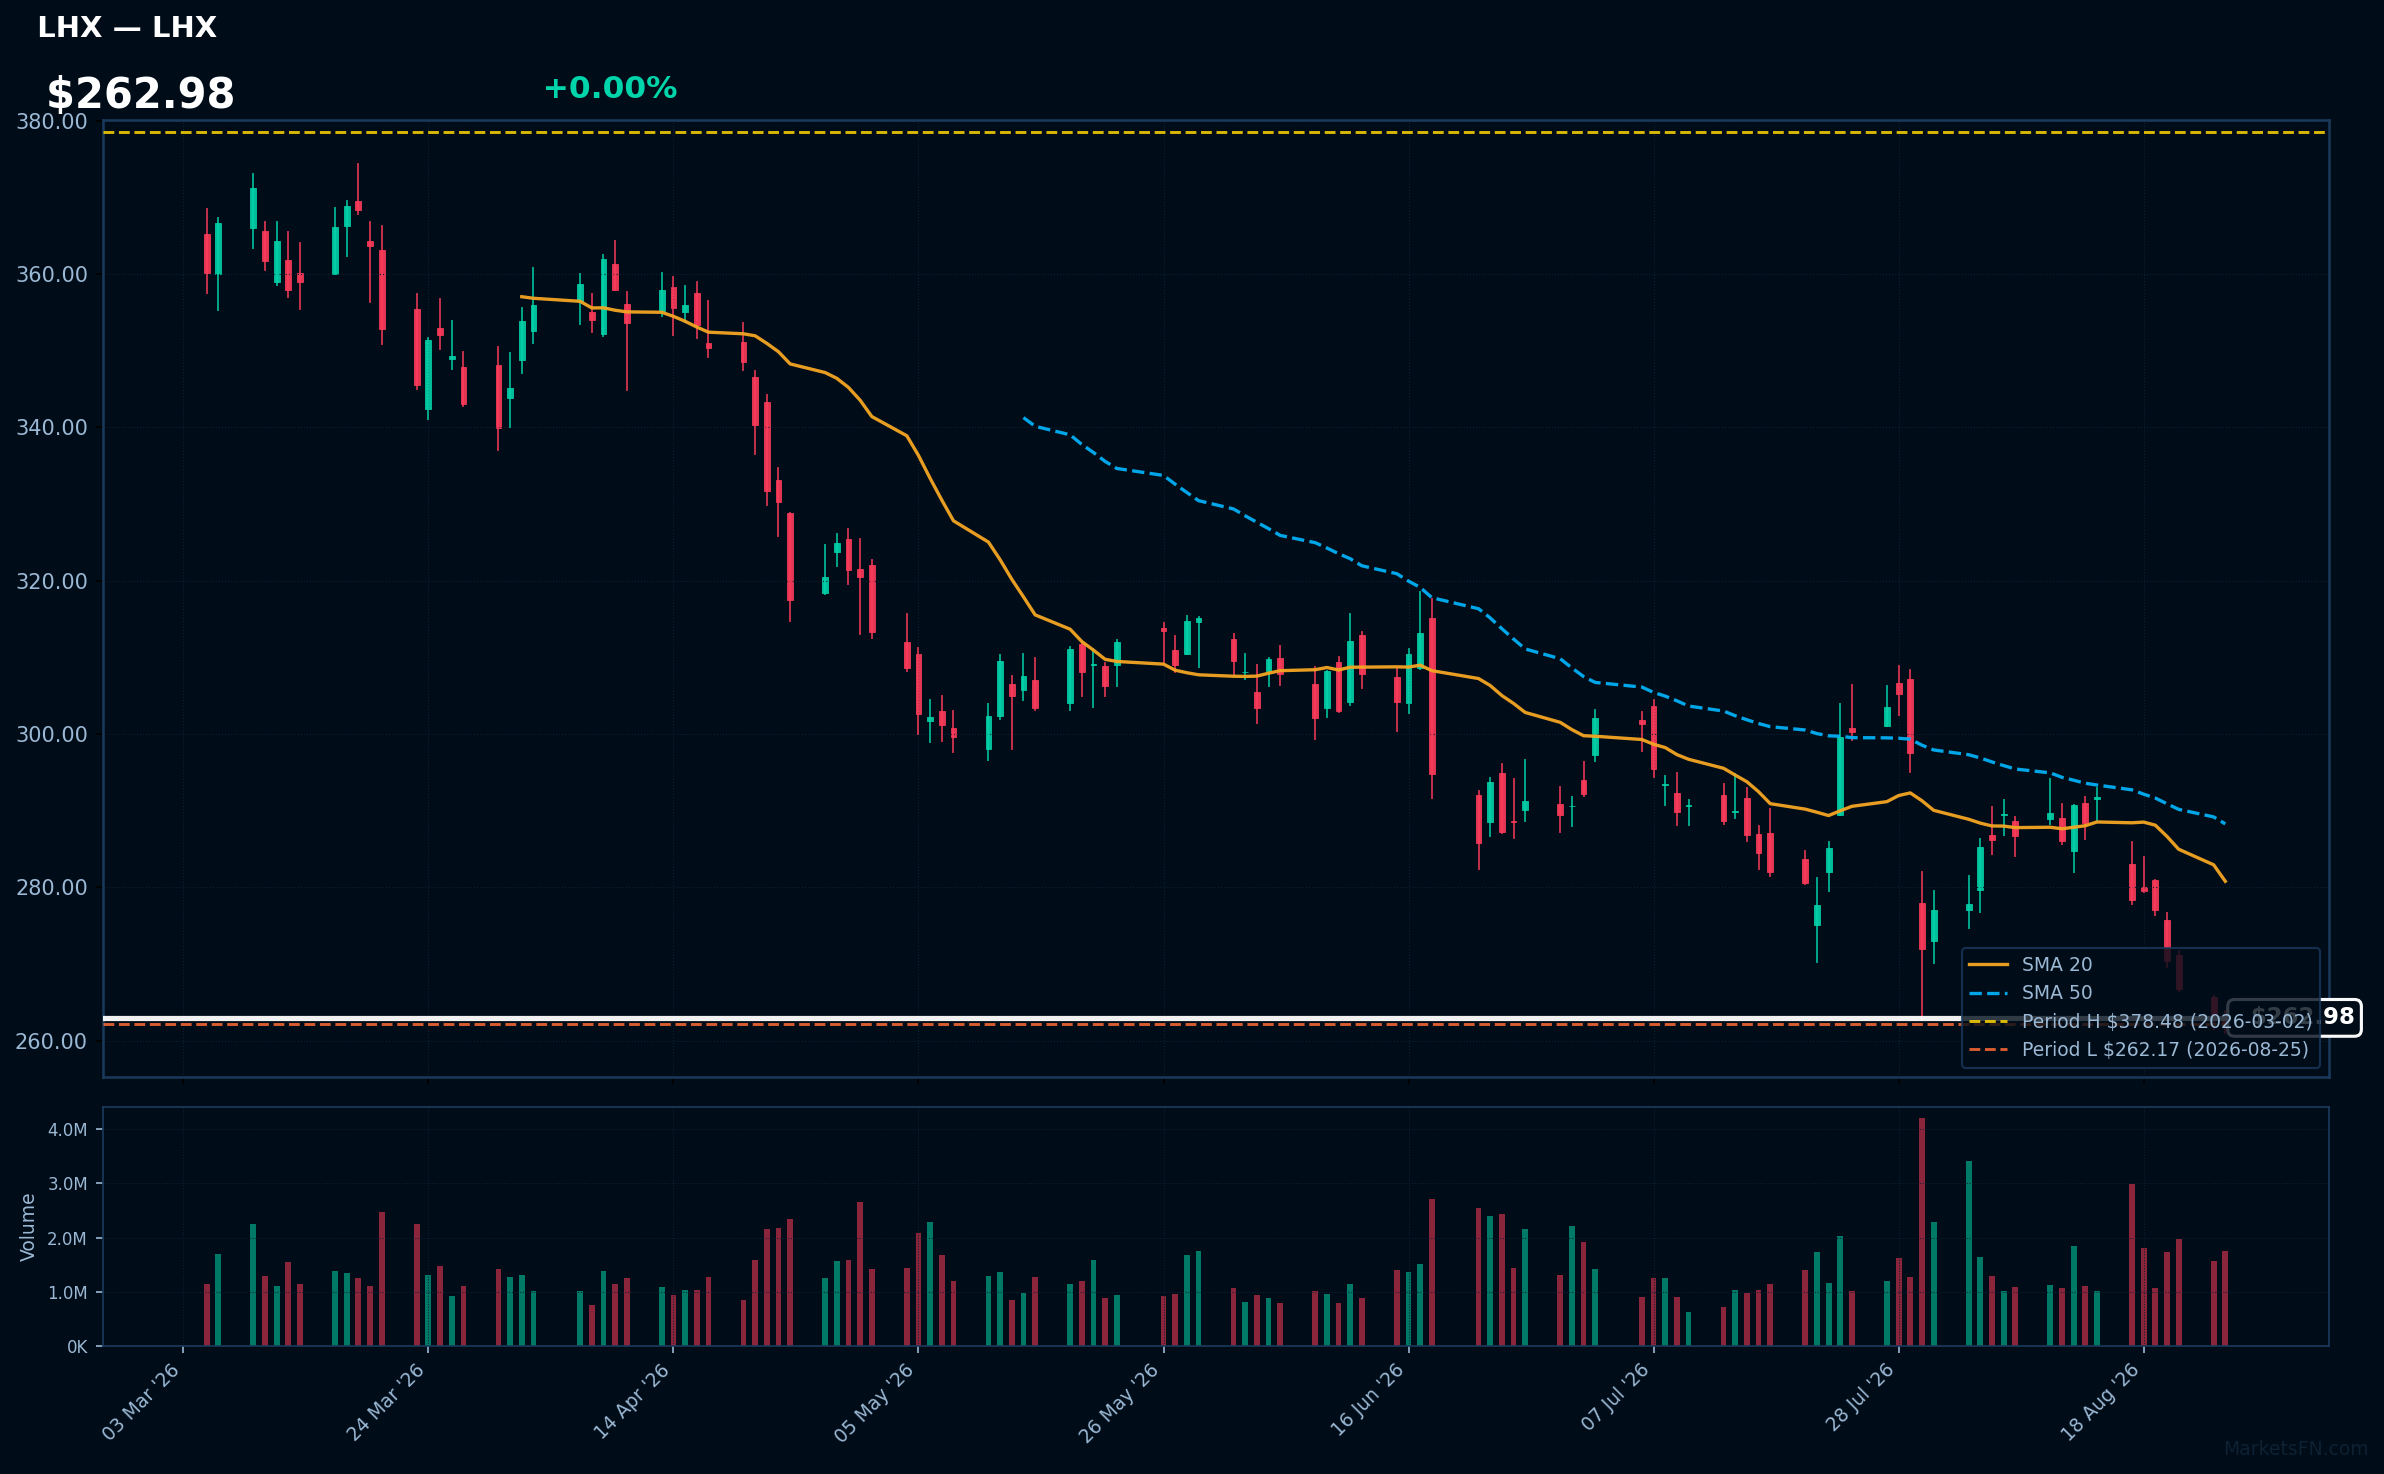
LHX | L3Harris Technologies Inc | Industrials | Price Last: $262.17 | % Realized: -13.90% | RSI: 33.6 | % above MA200: -16.8% | Trend: Below MA20, MA50, MA200
L3Harris Technologies Inc specializes in communication and electronic systems for government and commercial customers, focusing on defense, aerospace, and public safety. Investors should care due to its critical role in national security and technological advancements in these sectors.
The current technical situation indicates a warning sign, with an RSI(14) of 33.6 and a bearish MA alignment: price < MA20 < MA50 < MA200, indicating a sustained downtrend.
Related headlines
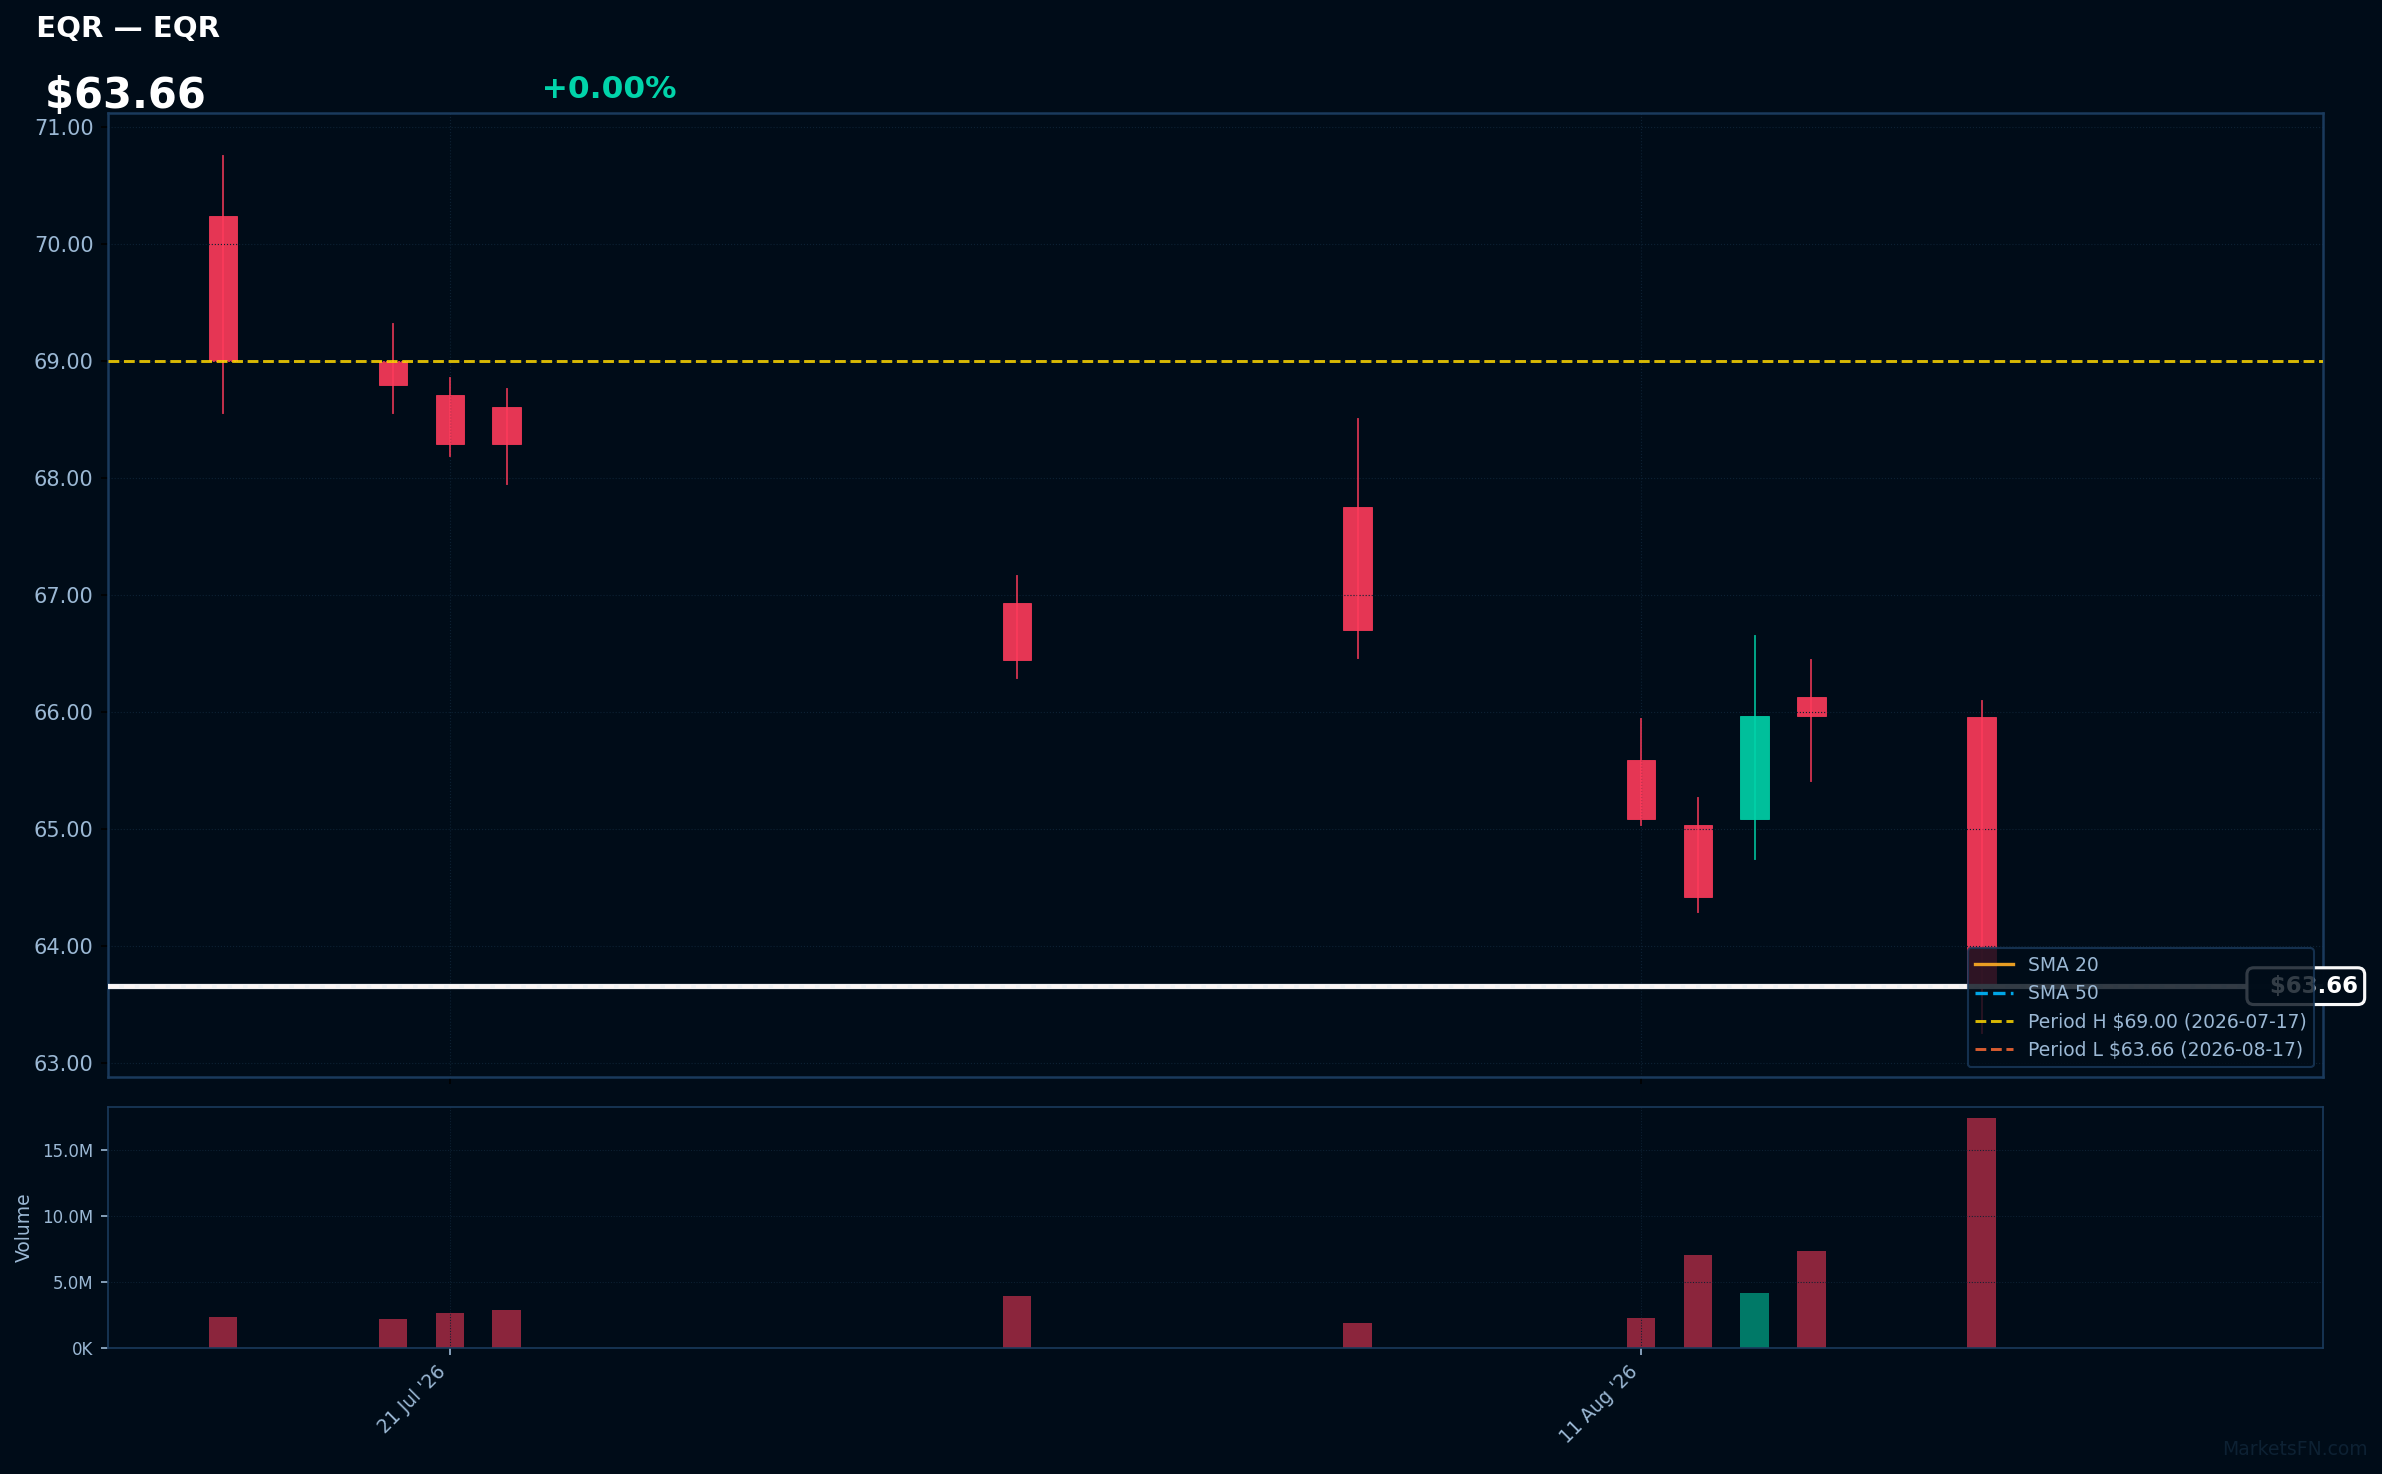
EQR | Equity Residential Properties Trust | Real Estate | Price Last: $63.66 | % Realized: -7.74% | RSI: 21.2 | % above MA200: — | Trend: —
Equity Residential Properties Trust (EQR) focuses on acquiring, developing, and managing residential properties in urban and high-density suburban areas, providing investors exposure to the multifamily housing sector, which is critical amid ongoing housing demand and rental growth trends.
The current technical situation indicates a warning sign, with an RSI(14) of 21.2 suggesting oversold conditions. The stock is testing major support, being only 0.0% above its 2026 YTD low, and has a period return of -7.7% over 2026 YTD.
Related headlines
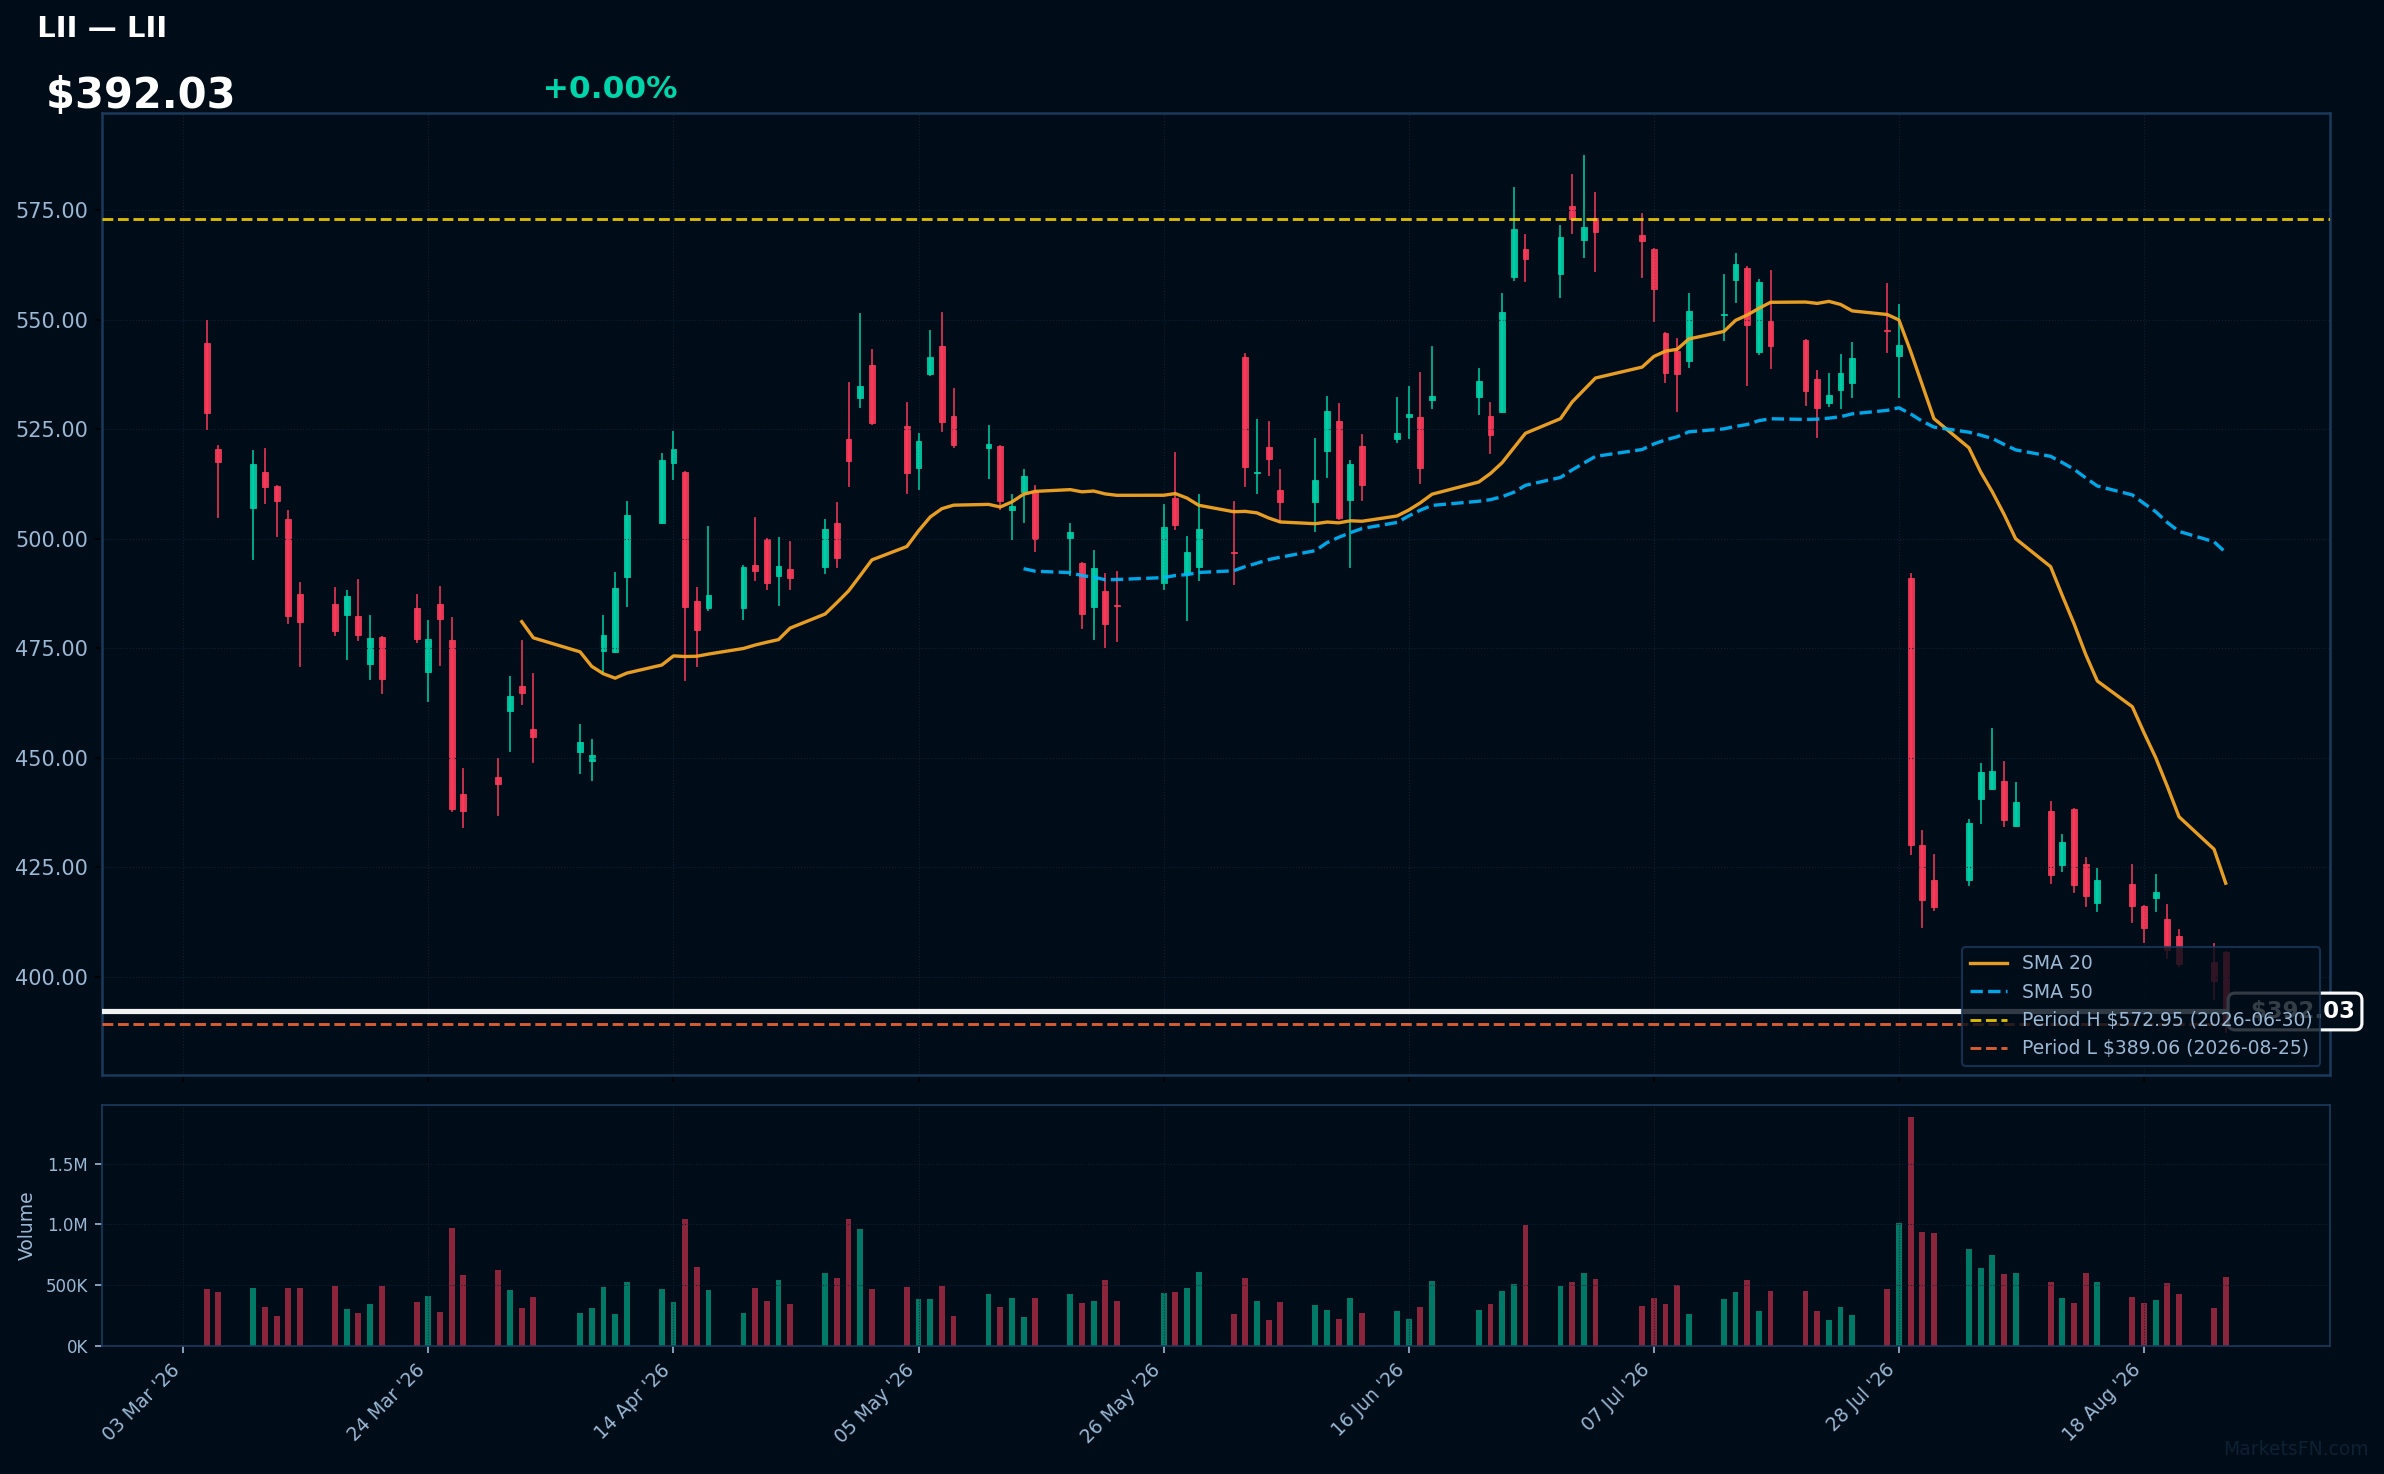
LII | Lennox International Inc | Industrials | Price Last: $389.06 | % Realized: -22.02% | RSI: 29.0 | % above MA200: -22.4% | Trend: Below MA20, MA50, MA200
Lennox International Inc designs and manufactures heating, ventilation, and air conditioning (HVAC) systems. Investors should care due to its significant role in energy-efficient climate control solutions, which are increasingly vital amid rising energy costs and environmental concerns.
The current technical situation indicates a bearish trend, with an RSI of 29.0 and a MA alignment of price < MA20 < MA50 < MA200, suggesting a sustained downtrend and testing major support.
Related headlines
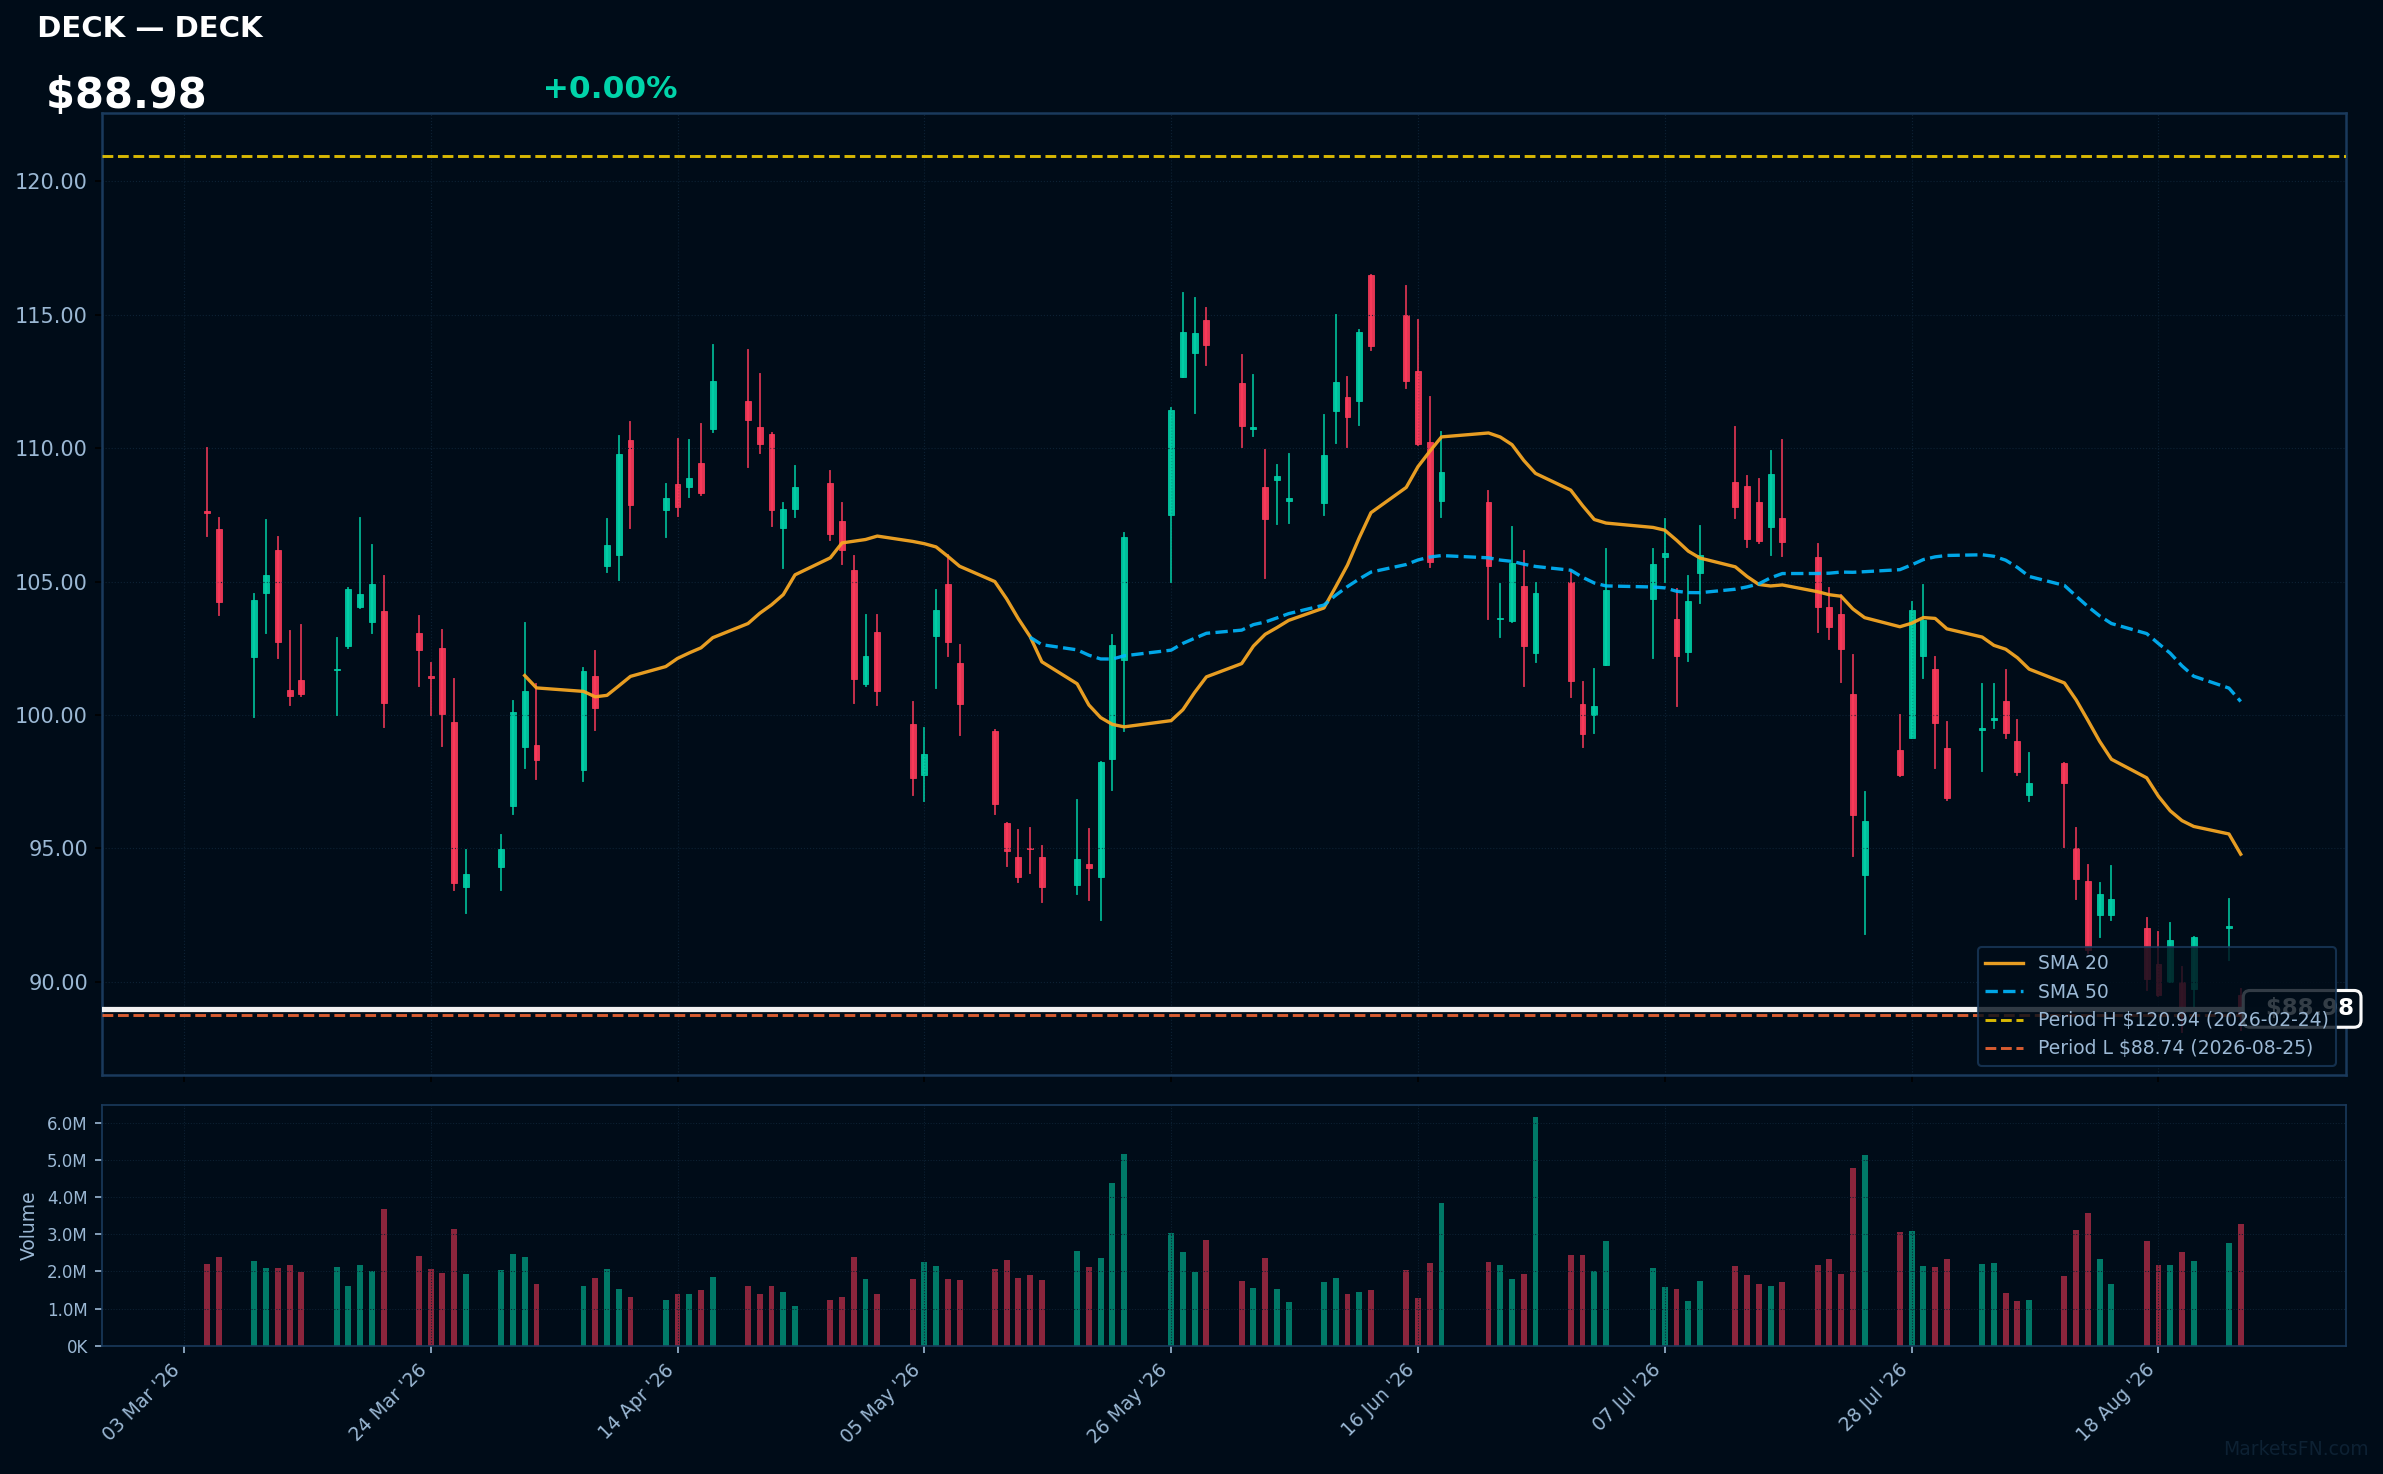
DECK | Deckers Outdoor Corp | Consumer Cyclical | Price Last: $88.74 | % Realized: -16.90% | RSI: 37.3 | % above MA200: -13.4% | Trend: Below MA20, MA50, MA200
Deckers Outdoor Corp designs and markets footwear, apparel, and accessories, focusing on lifestyle brands like UGG and HOKA. Investors should care due to its strong brand portfolio and potential for recovery in consumer spending, especially in the outdoor and lifestyle segments.
The current technical situation shows a bearish alignment with price at $88.98, RSI(14) at 37.3, and MA alignment indicating a sustained downtrend: price < MA20 < MA50 < MA200. The stock is testing major support, being only 0.0% above its 2026 YTD low.
Related headlines
Market Commentary
The proximity of certain S&P 500 stocks to their 2026 year-to-date extremes indicates a significant divergence in market performance. Stocks like Visa Inc, Merck & Co Inc, Pfizer Inc, DoorDash Inc, and Vertex Pharmaceuticals are all at 0.0% from their highs, suggesting strong investor confidence and robust fundamentals driving their valuations. Conversely, companies such as TJX Companies, L3Harris Technologies, Equity Residential Properties Trust, Lennox International, and Deckers Outdoor Corp are only marginally above their lows, reflecting potential challenges or market skepticism regarding their growth prospects.
This divergence may be attributed to sector-specific themes and broader market conditions. The high-performing stocks are likely benefiting from strong demand in sectors such as healthcare and technology, which have shown resilience amid economic fluctuations. In contrast, the underperforming stocks may be facing headwinds from changing consumer behaviors, supply chain issues, or economic uncertainties that disproportionately affect their sectors.
Investors should closely monitor upcoming earnings reports and economic indicators that could influence these trends. Key metrics such as consumer spending, inflation rates, and sector performance will be critical in determining whether the high-flying stocks can maintain their momentum or if the lagging stocks will recover. Additionally, any shifts in monetary policy could impact market sentiment and stock valuations across the board.
Methodology: All 503 S&P 500 constituents screened. Close prices downloaded from 2026-01-01. Period high = highest close since Jan 1 2026; period low = lowest close since Jan 1 2026. Distance = (current price / period extreme − 1) × 100. Technical indicators computed on up to 1 year of daily OHLCV data.
Disclaimer: For informational purposes only. Not investment advice. Past performance is not indicative of future results.