S&P 500 52-Week Highs & Lows Radar: Abbvie (ABBV), T-Mobile US (TMUS) and more
MarketsFN Team

Screening all 503 S&P 500 constituents for stocks nearest to their 52-week high and their 52-week low. Data as of October 09, 2026. % Realized = 52-week total return.
Legend: RSI > 70 = overbought · RSI < 30 = oversold · Green % Realized = positive 52W return · Red = negative.
📈 Nearest to 52-Week High
Sectors represented: Healthcare (2), Energy (2), Technology (1)
| Ticker | Company | Sector | Price Last | % Realized | 52-Week High Date | RSI | % above MA200 | Trend |
|---|---|---|---|---|---|---|---|---|
| ABBV | Abbvie Inc | Healthcare | $274.55 | +19.01% | 2026-10-09 | 69.3 | +18.0% | Above MA20, MA50, MA200 |
| FTNT | Fortinet Inc | Technology | $191.76 | +122.49% | 2026-10-09 | 70.7 | +58.1% | Above MA20, MA50, MA200 |
| MPC | Marathon Petroleum Corp | Energy | $464.62 | +147.72% | 2026-10-09 | 79.8 | +73.0% | Above MA20, MA50, MA200 |
| PSX | Phillips 66 | Energy | $282.99 | +115.87% | 2026-10-09 | 75.5 | +50.8% | Above MA20, MA50, MA200 |
| HUM | Humana Inc | Healthcare | $441.26 | +51.84% | 2026-10-09 | 68.7 | +48.6% | Above MA20, MA50, MA200 |
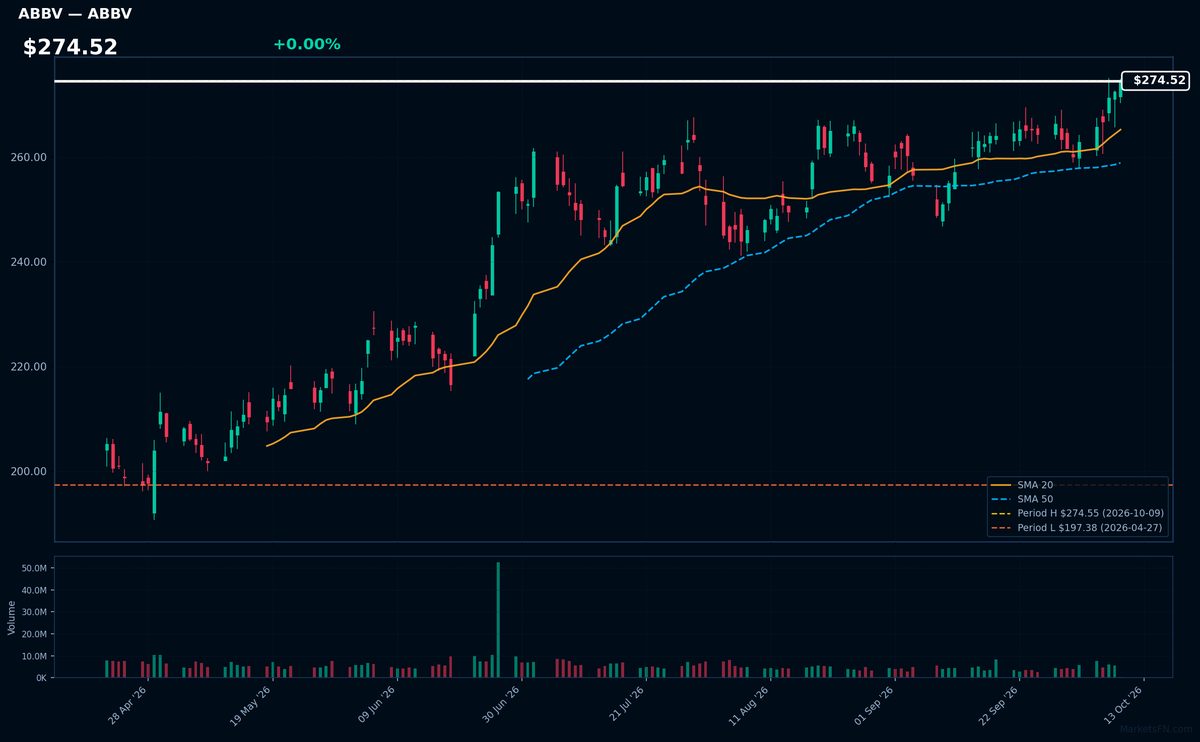
ABBV | Abbvie Inc | Healthcare | Price Last: $274.55 | % Realized: +19.01% | RSI: 69.3 | % above MA200: +18.0% | Trend: Above MA20, MA50, MA200
AbbVie is a biopharmaceutical leader with blockbuster drugs like Humira and Skyrizi, specializing in immunology and oncology. Investors care due to its strong pipeline, dividend growth, and ability to offset Humira biosimilar competition with newer therapies.
Technically bullish: RSI(14) at 69.3 shows momentum, while price > MA20 > MA50 > MA200 confirms uptrend. Stock tests 52-week high (+19% YoY), suggesting breakout potential but nearing overbought.
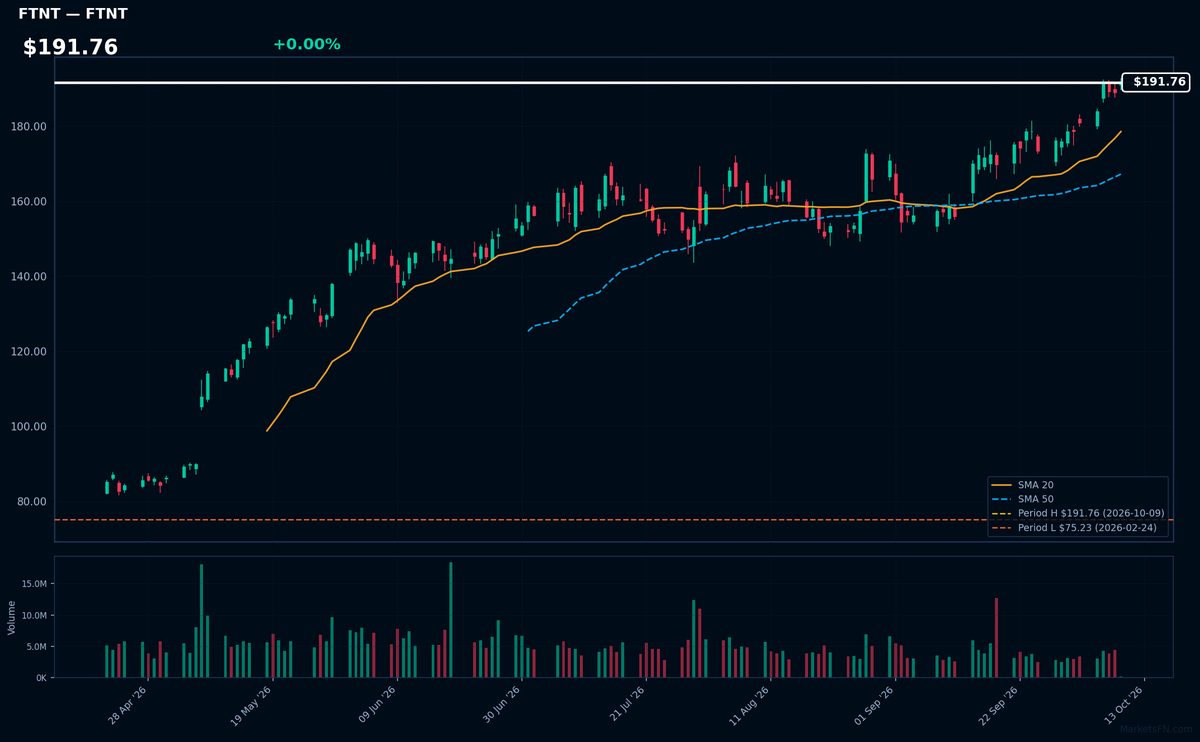
FTNT | Fortinet Inc | Technology | Price Last: $191.76 | % Realized: +122.49% | RSI: 70.7 | % above MA200: +58.1% | Trend: Above MA20, MA50, MA200
Fortinet provides cybersecurity solutions, including firewalls and threat detection, as enterprises prioritize digital defense. Investors care because cyber risks are escalating, driving consistent demand for its integrated security platforms.
Technically bullish: RSI(14) at 70.7 shows overbought momentum, but price > MA20 > MA50 > MA200 confirms uptrend. At 0.0% below 52-week high (+122.5% YoY), watch for breakout or pullback.
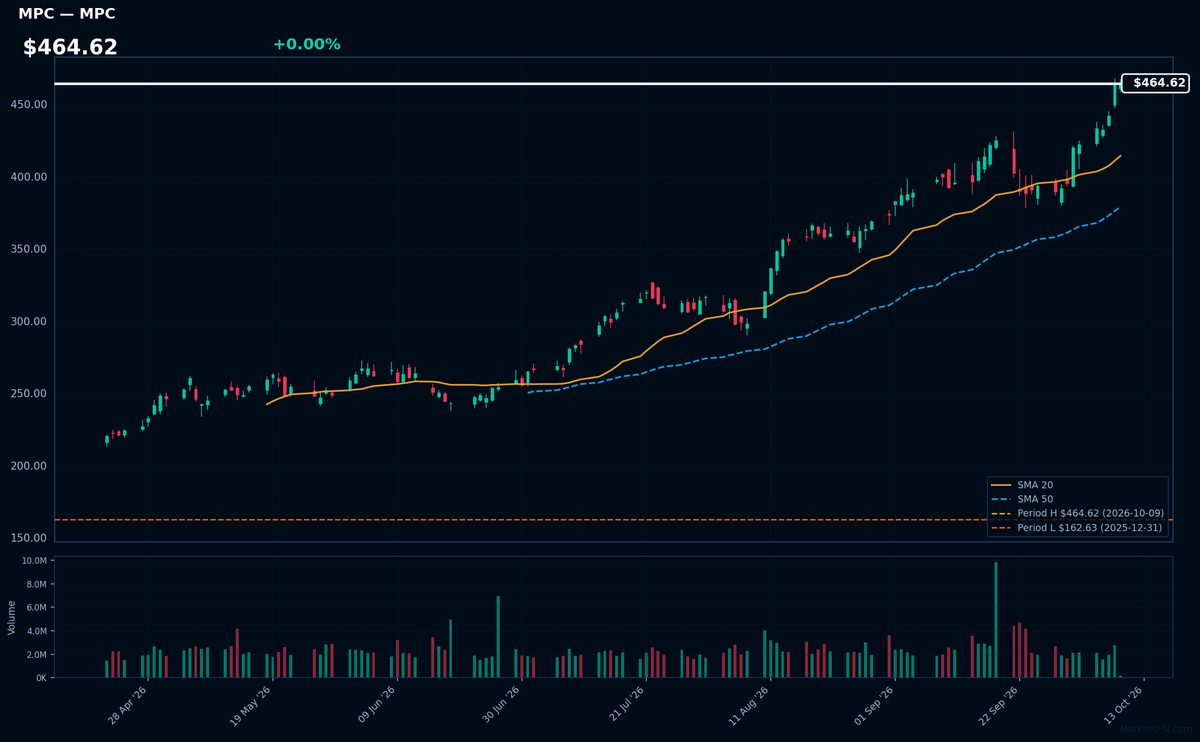
MPC | Marathon Petroleum Corp | Energy | Price Last: $464.62 | % Realized: +147.72% | RSI: 79.8 | % above MA200: +73.0% | Trend: Above MA20, MA50, MA200
Marathon Petroleum operates the largest US refining system by capacity, processing crude into fuels and lubricants. Investors watch MPC for its refining margin leverage and midstream/logistics assets, benefiting from volatile energy markets and domestic energy infrastructure needs.
MPC shows extreme bullish momentum (RSI 79.8, price > MA20 > MA50 > MA200) but sits at its 52-week high after a 147.7% rally — suggesting overbought conditions that may precede consolidation.
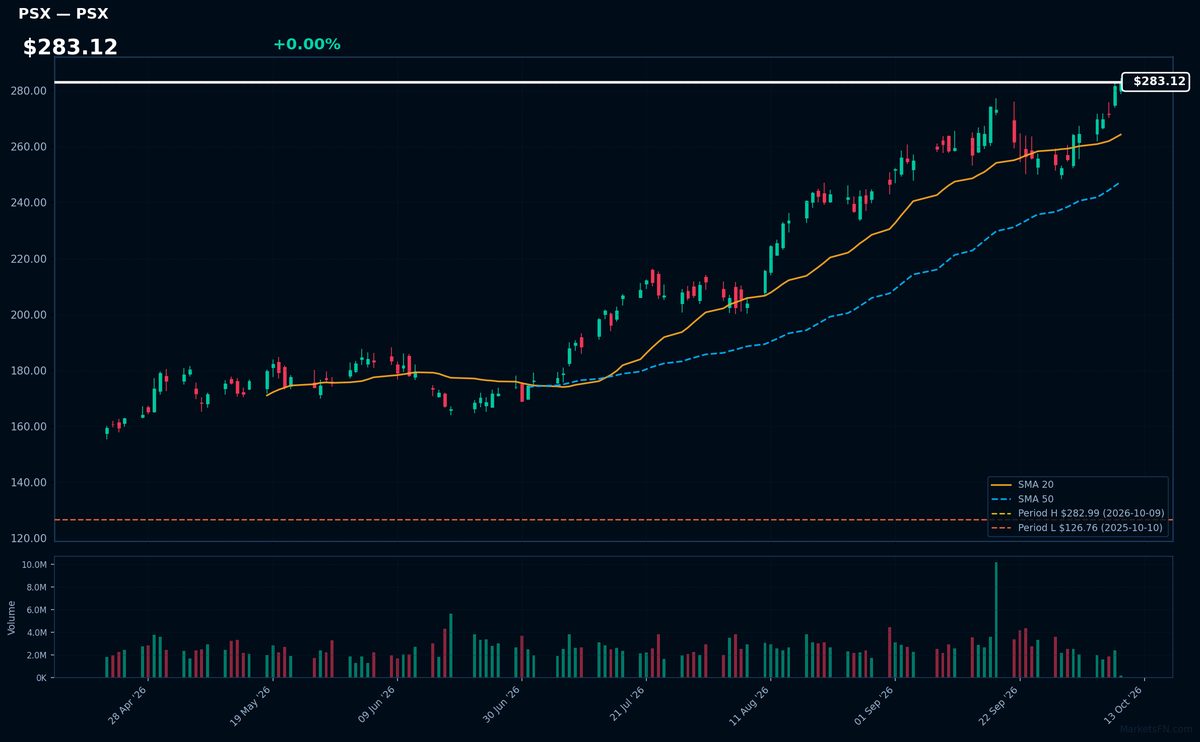
PSX | Phillips 66 | Energy | Price Last: $282.99 | % Realized: +115.87% | RSI: 75.5 | % above MA200: +50.8% | Trend: Above MA20, MA50, MA200
Phillips 66 operates refineries (13% of U.S. capacity), chemical plants, and midstream assets. Investors watch PSX for leveraged exposure to refining margins and its 3.9% dividend yield during energy cycles, with recent outperformance tied to strong crack spreads and renewable fuel investments.
Technically overbought (RSI 75.5) but in sustained uptrend (price > MA20 > MA50 > MA200), testing 52-week highs after 115.9% annual return. Current setup suggests momentum continuation risk/reward.
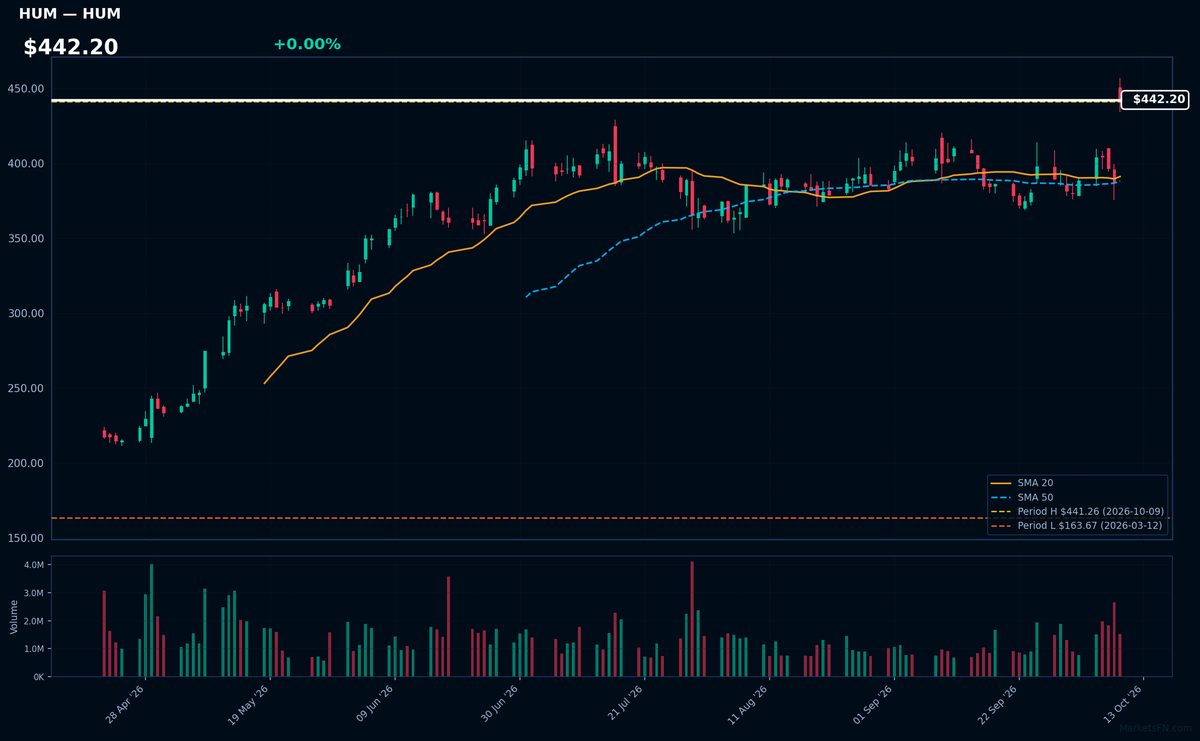
HUM | Humana Inc | Healthcare | Price Last: $441.26 | % Realized: +51.84% | RSI: 68.7 | % above MA200: +48.6% | Trend: Above MA20, MA50, MA200
Humana Inc operates as a health insurance provider, specializing in Medicare Advantage plans and value-based care models. Investors should monitor its dominant position in government-backed healthcare programs, which drive stable revenue streams amid demographic tailwinds.
Technically bullish with RSI(14) at 68.7 and price > MA20 > MA50 > MA200. The stock tests its 52-week high after gaining 51.8% over the past year, suggesting sustained momentum but nearing overbought territory.
📉 Nearest to 52-Week Low
Sectors represented: Communication Services (3), Basic Materials (1), Industrials (1)
| Ticker | Company | Sector | Price Last | % Realized | 52-Week Low Date | RSI | % above MA200 | Trend |
|---|---|---|---|---|---|---|---|---|
| TMUS | T-Mobile US Inc | Communication Services | $155.41 | -31.30% | 2026-10-09 | 33.2 | -18.4% | Below MA20, MA50, MA200 |
| CMCSA | Comcast Corp | Communication Services | $20.90 | -25.86% | 2026-10-09 | 25.9 | -21.3% | Below MA20, MA50, MA200 |
| CHTR | Charter Communications Inc | Communication Services | $106.59 | -59.78% | 2026-10-09 | 30.0 | -38.2% | Below MA20, MA50, MA200 |
| MLM | Martin Marietta Materials, Inc | Basic Materials | $477.88 | -24.60% | 2026-10-09 | 38.2 | -18.4% | Below MA20, MA50, MA200 |
| LII | Lennox International Inc | Industrials | $354.81 | -33.60% | 2026-10-09 | 37.5 | -26.6% | Below MA20, MA50, MA200 |
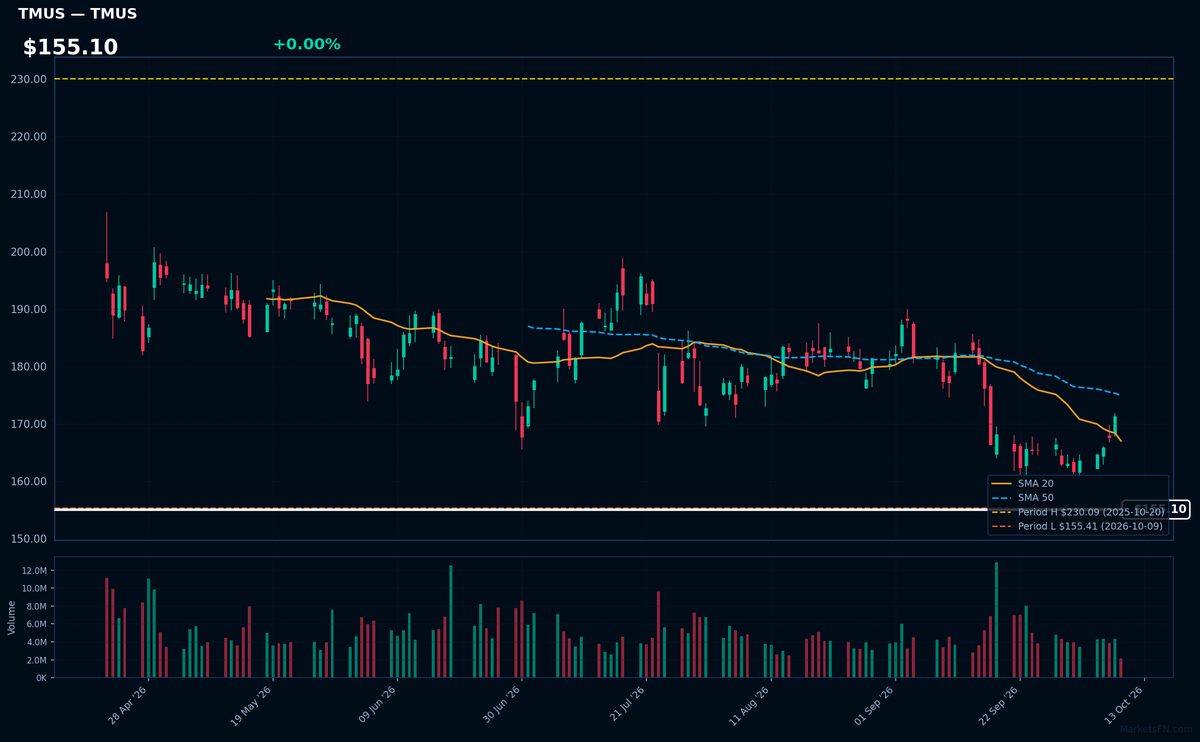
TMUS | T-Mobile US Inc | Communication Services | Price Last: $155.41 | % Realized: -31.30% | RSI: 33.2 | % above MA200: -18.4% | Trend: Below MA20, MA50, MA200
T-Mobile US Inc operates as a major wireless carrier in the U.S., known for aggressive pricing and network expansion. Investors watch its subscriber growth and 5G rollout, which drive revenue in the competitive telecom sector.
TMUS shows bearish momentum: RSI(14) at 33.2 (near oversold) with price below all key MAs (MA20/50/200). At 0.0% above 52-week lows after a -31.3% decline, this signals severe weakness, testing critical support.
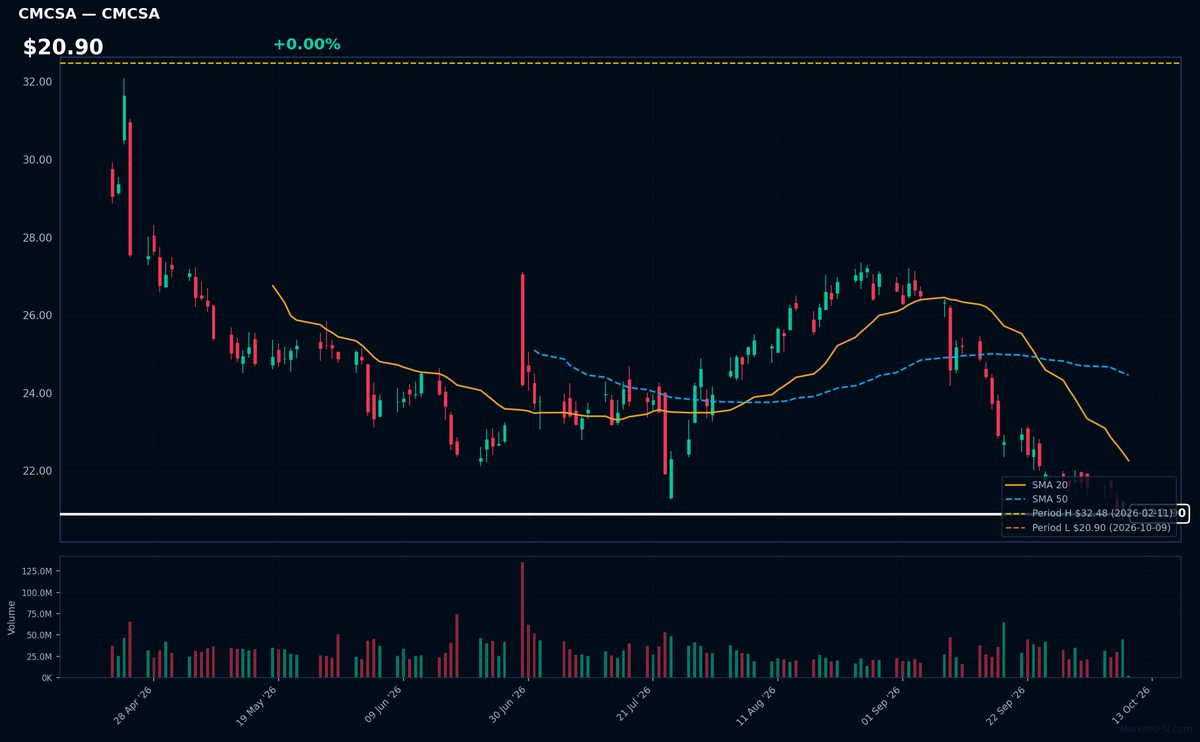
CMCSA | Comcast Corp | Communication Services | Price Last: $20.90 | % Realized: -25.86% | RSI: 25.9 | % above MA200: -21.3% | Trend: Below MA20, MA50, MA200
Comcast Corp operates as a global media and technology company, providing broadband, video, wireless, and streaming services. Investors monitor its infrastructure dominance in U.S. broadband and content scale via NBCUniversal, though cord-cutting pressures traditional revenue streams.
CMCSA shows extreme technical weakness: RSI(14) at 25.9 (oversold) with bearish MA alignment (price < MA20 < MA50 < MA200) and -25.9% 52-week return. Trading 0.0% above 52-week low signals critical support test—a warning sign absent fundamental catalysts.
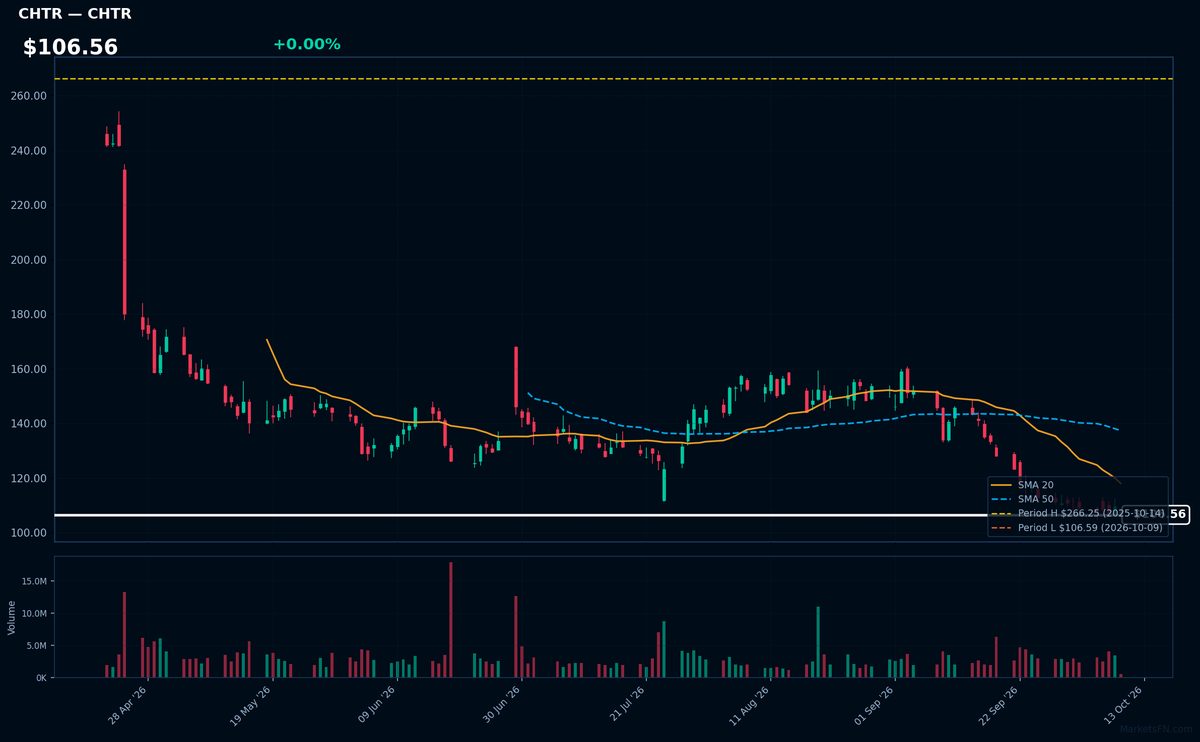
CHTR | Charter Communications Inc | Communication Services | Price Last: $106.59 | % Realized: -59.78% | RSI: 30.0 | % above MA200: -38.2% | Trend: Below MA20, MA50, MA200
Charter Communications Inc (CHTR) is a leading broadband connectivity and cable operator, providing essential internet, TV, and voice services to residential and business customers. Investors care due to its infrastructure-heavy, recurring-revenue model in a connectivity-dependent economy.
CHTR shows extreme technical weakness: RSI(14) at 30.0 (oversold), with sustained downtrend (price < MA20 < MA50 < MA200) and -59.8% 52-week return. Testing 52-week low warns of continued pressure.
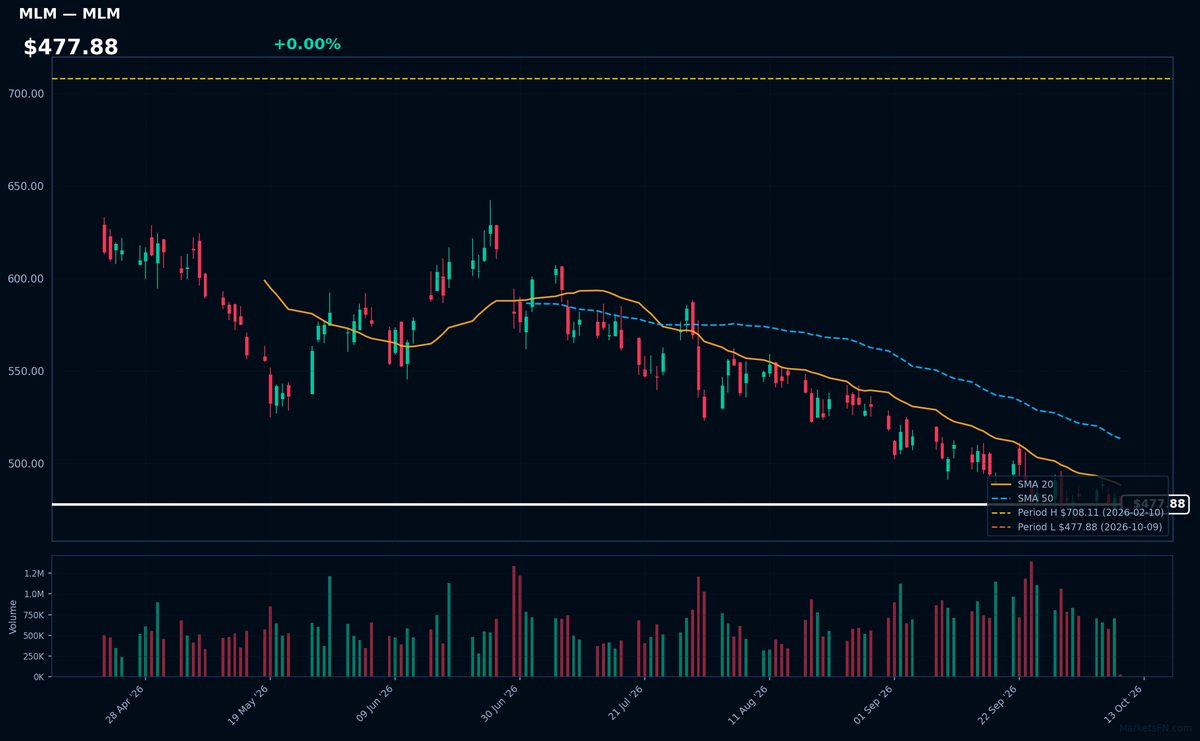
MLM | Martin Marietta Materials, Inc | Basic Materials | Price Last: $477.88 | % Realized: -24.60% | RSI: 38.2 | % above MA200: -18.4% | Trend: Below MA20, MA50, MA200
Martin Marietta Materials supplies construction aggregates (crushed stone, sand, gravel) and heavy building materials, critical for infrastructure and commercial projects. Investors monitor it as a cyclical proxy for construction activity and public works spending, with pricing power in regional markets.
MLM shows severe technical weakness: RSI(14) at 38.2 (approaching oversold), in a sustained downtrend (price < MA20 < MA50 < MA200), and hovering just 0.0% above its 52-week low. The 24.6% annual decline signals distribution, not a buying opportunity.
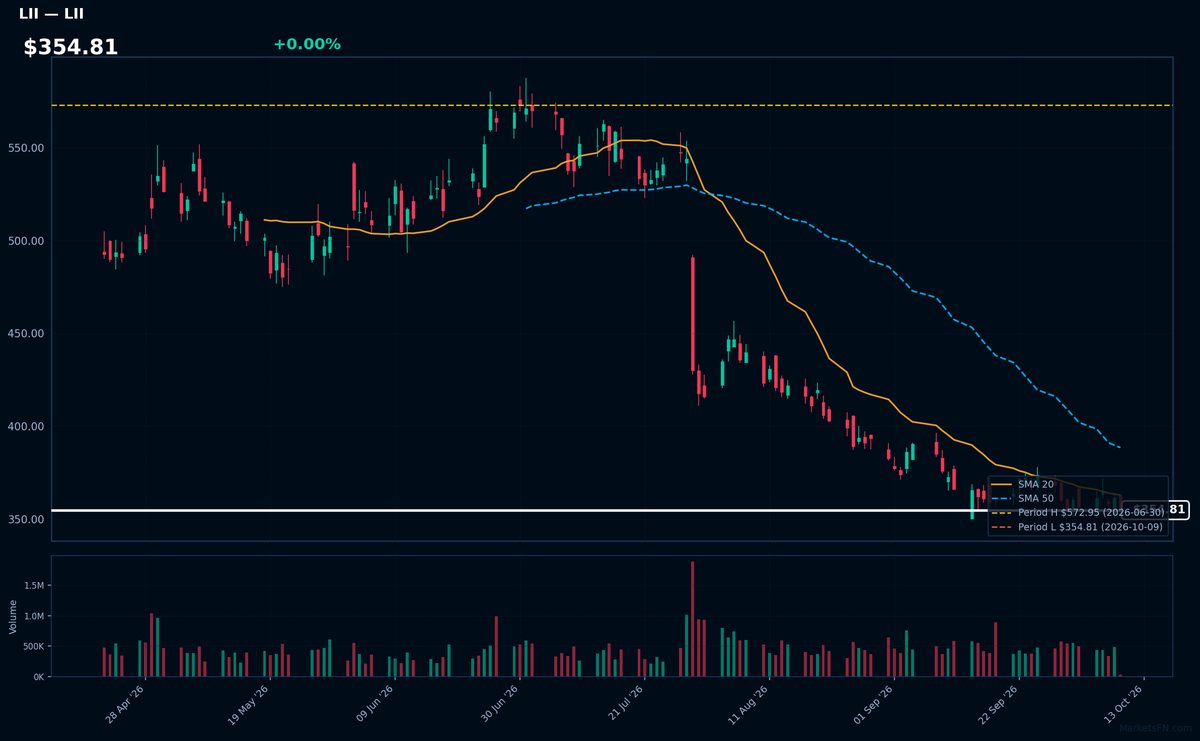
LII | Lennox International Inc | Industrials | Price Last: $354.81 | % Realized: -33.60% | RSI: 37.5 | % above MA200: -26.6% | Trend: Below MA20, MA50, MA200
Lennox International Inc manufactures HVAC systems and components, serving residential and commercial markets. Investors monitor LII for exposure to climate control demand, energy efficiency trends, and replacement cycles in North America's aging infrastructure.
Bearish technicals: RSI(14) at 37.5 shows weakening momentum, with price ($354.81) below all key MAs. Down 33.6% YTD, testing 52-week lows signals severe weakness.
Market Commentary
The concentration of S&P 500 stocks at 52-week highs (ABBV, FTNT, MPC, PSX, HUM) and lows (TMUS, CMCSA, CHTR, MLM, LII) signals divergent market sentiment. The highs are dominated by energy (MPC, PSX) and healthcare (ABBV, HUM), reflecting defensive positioning and strong sector-specific fundamentals, while the lows cluster in telecom (TMUS, CMCSA, CHTR) and materials (MLM, LII), suggesting cyclical pressure and regulatory/competitive headwinds.
Sector rotation appears tilted toward value and yield (energy refiners, pharma) amid inflation resilience, while growth-dependent telecom and housing-adjacent materials face higher rate sensitivity. Fortinet’s presence at highs underscores persistent cybersecurity demand, contrasting with broadband providers weighed by cord-cutting and capex concerns. Macro themes of sticky inflation (favoring energy) and Fed policy uncertainty (pressuring rate-sensitive sectors) are evident in these extremes.
Key levels to monitor are the 52-week highs for ABBV ($180.21) and MPC ($199.38), with potential catalysts including OPEC+ supply decisions and Humana’s Medicare Advantage pricing. For laggards, TMUS ($142.00 low) and MLM ($348.21 low) need to hold support, with telecom reliant on wireless ARPU trends and materials on infrastructure bill momentum. A break beyond these extremes could confirm sustained sector leadership or capitulation.
Methodology: All 503 S&P 500 constituents screened. 52-week high = highest daily close over the past 252 trading days (approx. 1 year). 52-week low = lowest daily close over the same period. Distance = (current price / extreme − 1) × 100. Technical indicators computed on up to 1 year of daily OHLCV data.
Disclaimer: For informational purposes only. Not investment advice. Past performance is not indicative of future results.