Nasdaq 100 52-Week Highs & Lows Radar: Fortinet (FTNT), T-Mobile US (TMUS) and more
MarketsFN Team

Screening all 101 Nasdaq 100 constituents for stocks nearest to their 52-week high and their 52-week low. Data as of October 09, 2026. % Realized = 52-week total return.
Legend: RSI > 70 = overbought · RSI < 30 = oversold · Green % Realized = positive 52W return · Red = negative.
📈 Nearest to 52-Week High
Sectors represented: Technology (4), Healthcare (1)
| Ticker | Company | Sector | Price Last | % Realized | 52-Week High Date | RSI | % above MA200 | Trend |
|---|---|---|---|---|---|---|---|---|
| FTNT | Fortinet Inc | Technology | $191.48 | +122.15% | 2026-10-09 | 70.4 | +57.9% | Above MA20, MA50, MA200 |
| TEAM | Atlassian Corporation | Technology | $204.28 | +38.27% | 2026-10-09 | 64.9 | +80.3% | Above MA20, MA50, MA200 |
| BIIB | Biogen Inc | Healthcare | $222.87 | +48.96% | 2026-09-28 | 53.1 | +13.5% | Above MA20, MA50, MA200 |
| AAPL | Apple Inc | Technology | $332.34 | +30.82% | 2026-09-25 | 51.4 | +14.3% | Above MA50, MA200 · Below MA20 |
| MSFT | Microsoft Corporation | Technology | $527.59 | +0.99% | 2025-10-28 | 64.2 | +21.6% | Above MA20, MA50, MA200 |
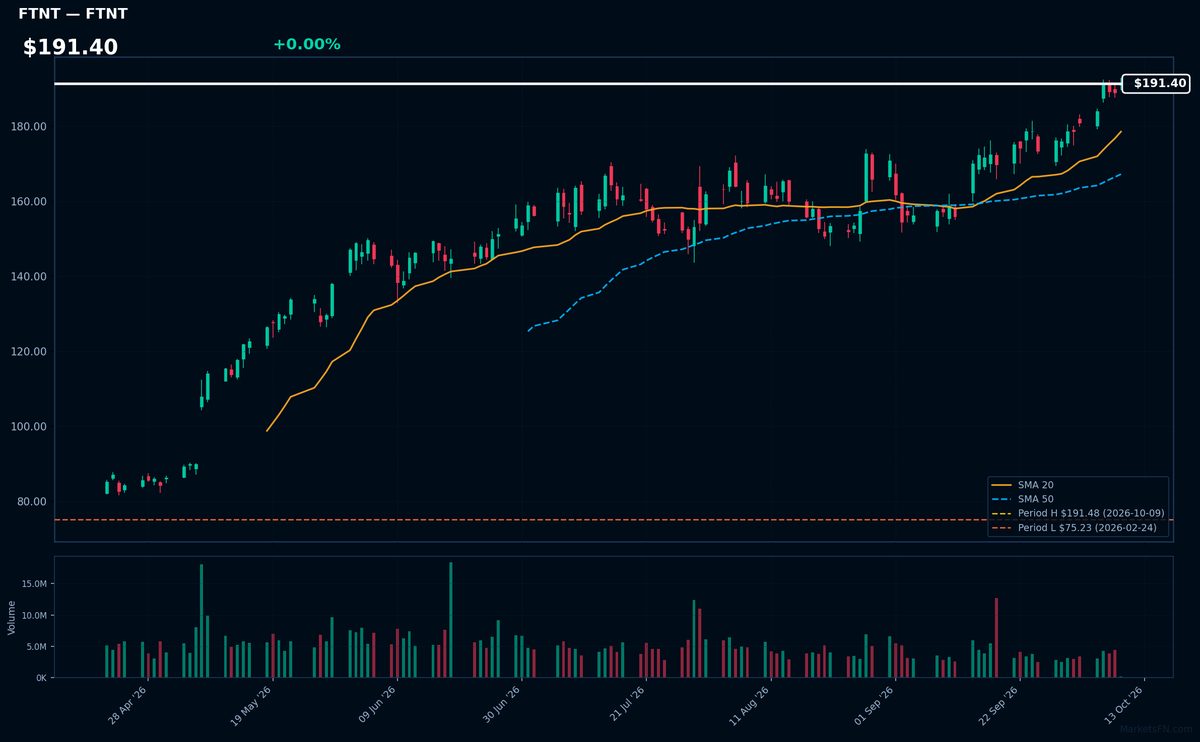
FTNT | Fortinet Inc | Technology | Price Last: $191.48 | % Realized: +122.15% | RSI: 70.4 | % above MA200: +57.9% | Trend: Above MA20, MA50, MA200
Fortinet provides cybersecurity solutions, specializing in network firewalls and threat detection. Investors care because digital transformation and remote work drive sustained demand for its integrated security platforms, with enterprises prioritizing defense against escalating cyber threats.
FTNT shows bullish momentum with price > MA20 > MA50 > MA200 (confirmed uptrend) and RSI(14) at 70.4 (near overbought). The stock tests its 52-week high after gaining 122.2% annually, suggesting strong buying pressure but warranting caution at extended levels.
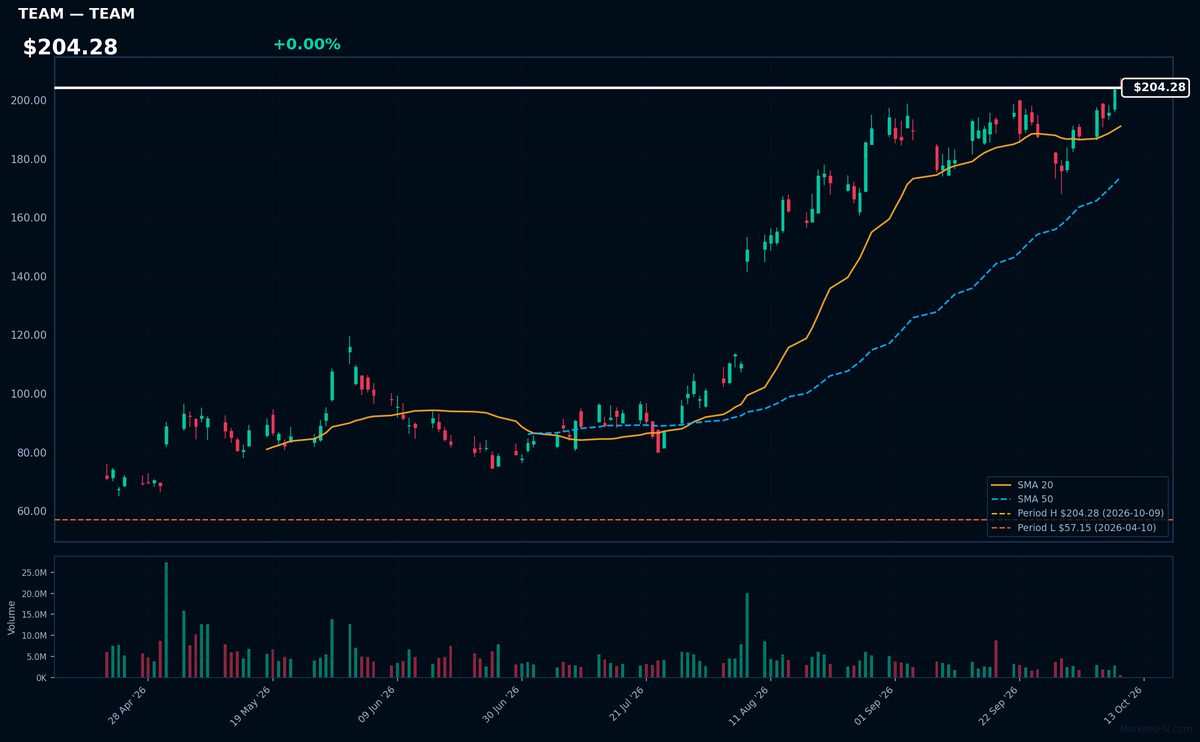
TEAM | Atlassian Corporation | Technology | Price Last: $204.28 | % Realized: +38.27% | RSI: 64.9 | % above MA200: +80.3% | Trend: Above MA20, MA50, MA200
Atlassian provides collaboration software (Jira, Confluence) for agile development teams. Investors care because its tools are mission-critical for software developers, creating sticky enterprise subscriptions with 90%+ gross margins, though growth is slowing as IT budgets tighten.
TEAM shows bullish momentum (RSI 64.9, price > MA20 > MA50 > MA200) but trades at 52-week highs (+38.3% YoY) — extended near-term but structurally strong. Watch RSI for overbought signals above 70.
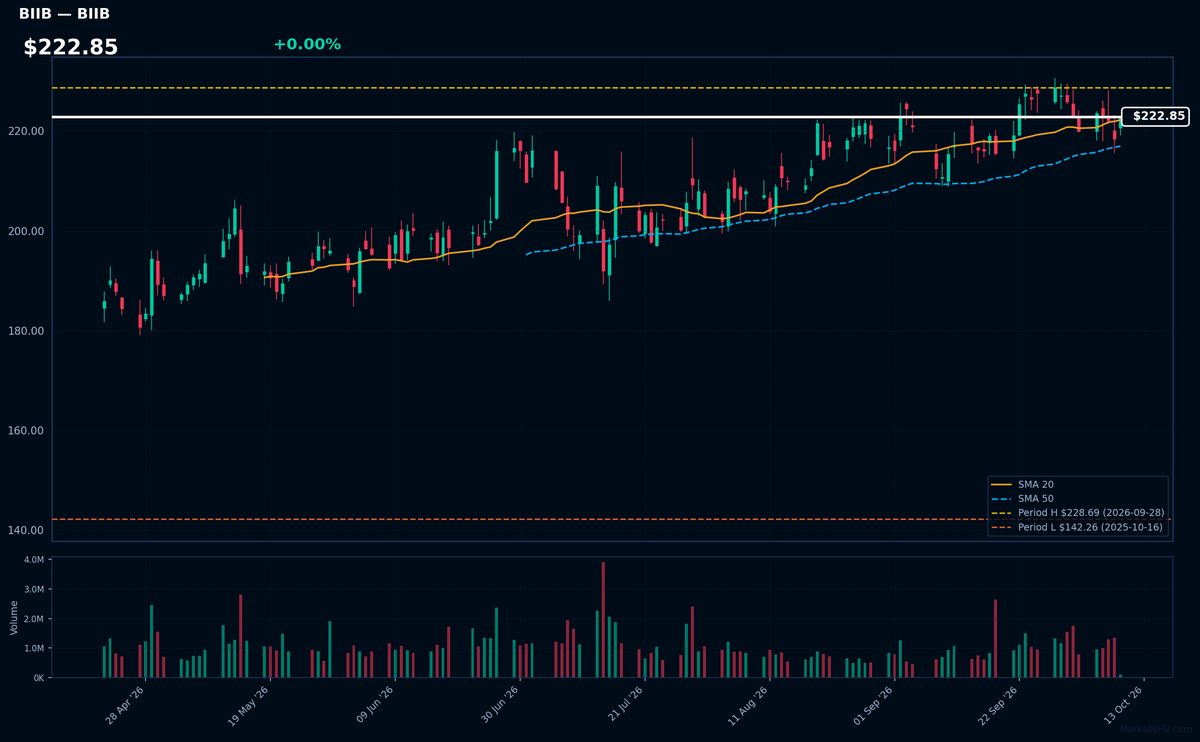
BIIB | Biogen Inc | Healthcare | Price Last: $222.87 | % Realized: +48.96% | RSI: 53.1 | % above MA200: +13.5% | Trend: Above MA20, MA50, MA200
Biogen specializes in neuroscience therapies, including multiple sclerosis drugs and Alzheimer's treatments like Aduhelm. Investors watch for FDA decisions and sales trends in these high-stakes, high-margin markets where clinical trial outcomes create binary stock moves.
Technically bullish with RSI(14) at 53.1 and price > MA20 > MA50 > MA200. The 49% 52-week return and 2.5% proximity to 52-week highs suggest sustained momentum, though RSI isn't yet overbought. MA alignment confirms the uptrend.
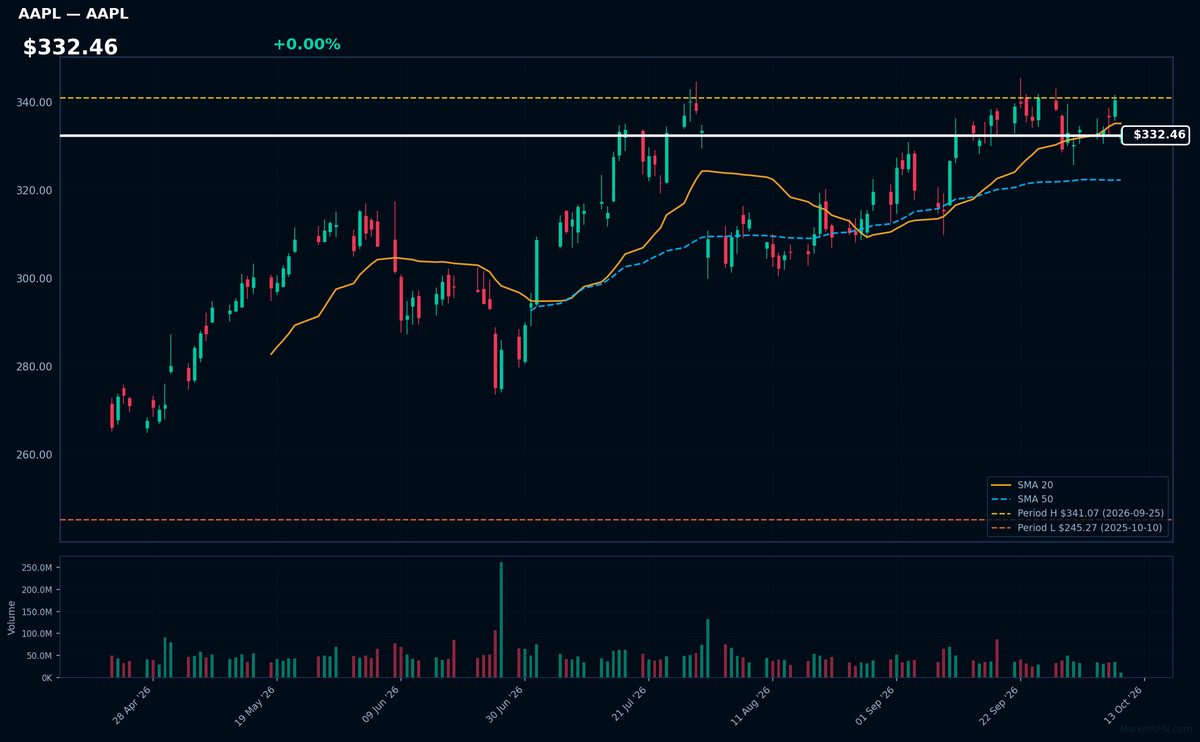
AAPL | Apple Inc | Technology | Price Last: $332.34 | % Realized: +30.82% | RSI: 51.4 | % above MA200: +14.3% | Trend: Above MA50, MA200 · Below MA20
Apple designs premium consumer electronics (iPhone, Mac), operates high-margin services (App Store, iCloud), and maintains unmatched brand loyalty. Investors care about its $332B cash pile, 30.8% annual return, and ecosystem lock-in that drives recurring revenue.
At $332.46, AAPL shows mixed signals: RSI(14) at 51.4 (neutral), price above MA50/MA200 but below MA20. Near 52-week high (-2.6%), the 30.8% annual gain suggests fundamental strength, but MA divergence warrants caution.
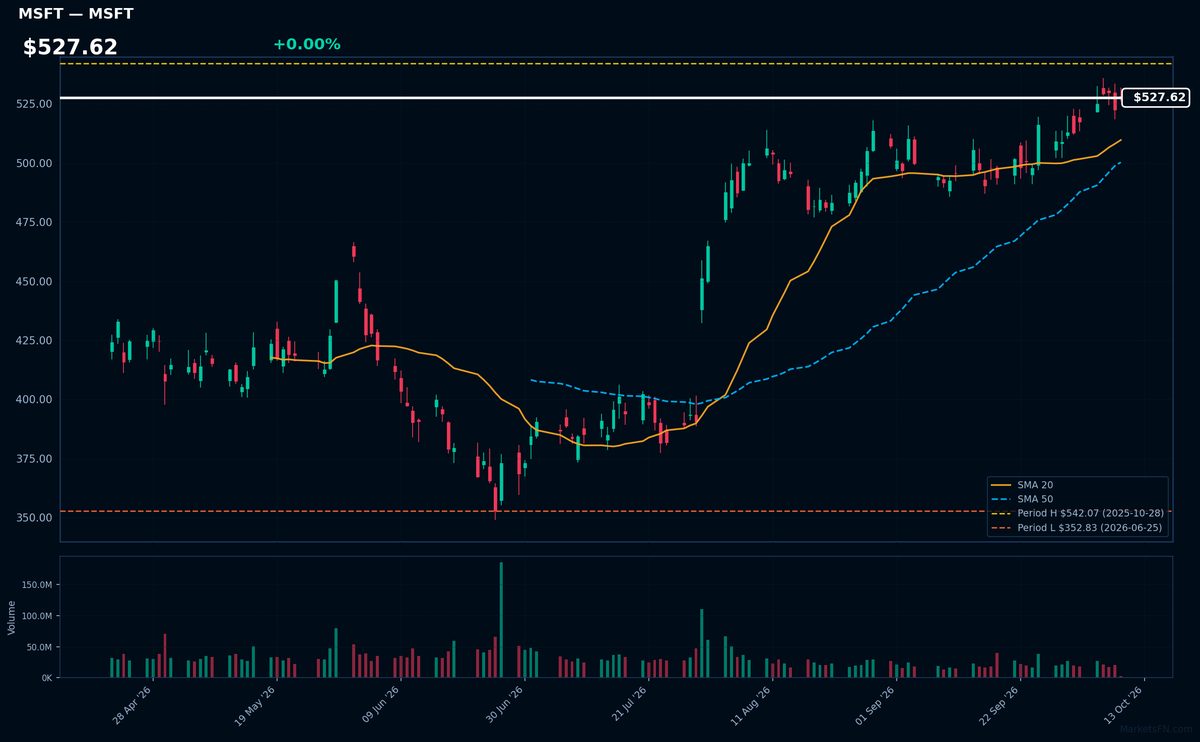
MSFT | Microsoft Corporation | Technology | Price Last: $527.59 | % Realized: +0.99% | RSI: 64.2 | % above MA200: +21.6% | Trend: Above MA20, MA50, MA200
Microsoft dominates enterprise software (Azure cloud, Office 365, Windows) and gaming (Xbox). Investors care for its recurring SaaS revenue, AI leadership via OpenAI integration, and 20%+ cloud growth sustaining margins. It's a cash cow with defensive qualities during downturns.
Technically bullish: $527.62 trades above all key MAs (20/50/200), RSI 64.2 shows momentum without overbought risk. The 2.7% gap to 52-week highs suggests breakout potential, but 1.0% annual return flags consolidation needs.
📉 Nearest to 52-Week Low
Sectors represented: Communication Services (3), Consumer Cyclical (1), Consumer Defensive (1)
| Ticker | Company | Sector | Price Last | % Realized | 52-Week Low Date | RSI | % above MA200 | Trend |
|---|---|---|---|---|---|---|---|---|
| TMUS | T-Mobile US Inc | Communication Services | $154.85 | -31.55% | 2026-10-09 | 33.0 | -18.7% | Below MA20, MA50, MA200 |
| CMCSA | Comcast Corp | Communication Services | $20.77 | -26.31% | 2026-10-09 | 25.2 | -21.7% | Below MA20, MA50, MA200 |
| CHTR | Charter Communications Inc | Communication Services | $105.69 | -60.12% | 2026-10-09 | 29.4 | -38.7% | Below MA20, MA50, MA200 |
| LULU | Lululemon Athletica inc | Consumer Cyclical | $92.57 | -46.64% | 2026-10-07 | 33.5 | -34.8% | Below MA20, MA50, MA200 |
| PEP | PepsiCo Inc | Consumer Defensive | $125.67 | -13.16% | 2026-10-07 | 36.3 | -14.3% | Below MA20, MA50, MA200 |
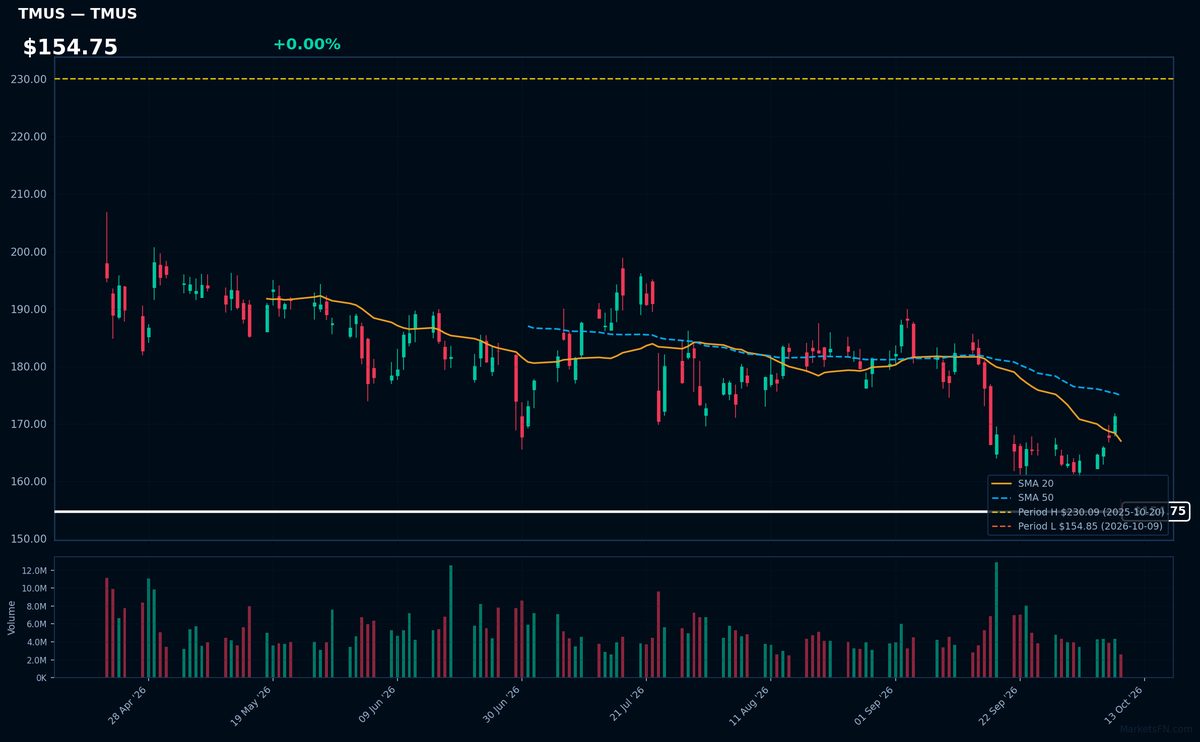
TMUS | T-Mobile US Inc | Communication Services | Price Last: $154.85 | % Realized: -31.55% | RSI: 33.0 | % above MA200: -18.7% | Trend: Below MA20, MA50, MA200
T-Mobile US Inc operates as a major wireless carrier, providing mobile voice/data services and 5G network expansion. Investors watch its subscriber growth and spectrum advantages in the competitive telecom sector.
TMUS shows severe technical weakness: RSI(14) at 33.0 with bearish MA alignment (price < MA20 < MA50 < MA200) and -31.5% 52-week return. Testing 52-week lows signals distribution.
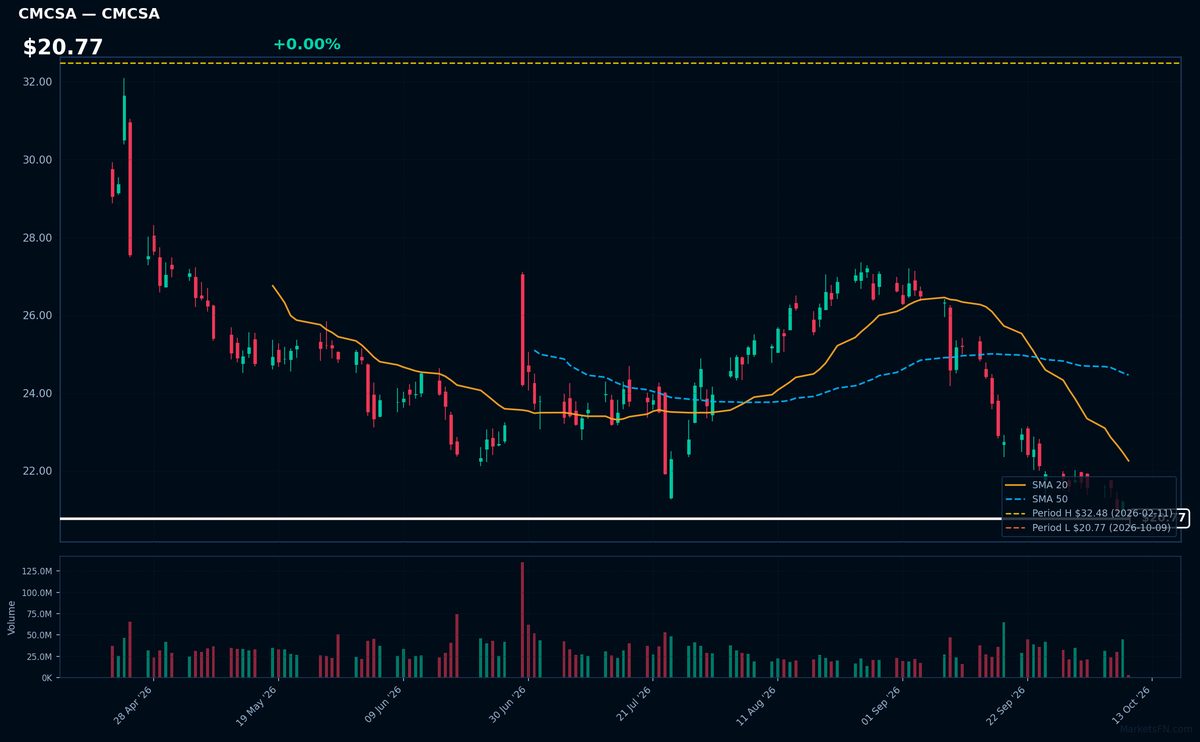
CMCSA | Comcast Corp | Communication Services | Price Last: $20.77 | % Realized: -26.31% | RSI: 25.2 | % above MA200: -21.7% | Trend: Below MA20, MA50, MA200
Comcast Corp operates as a global media and technology company, providing broadband, video, and wireless services through Xfinity, NBCUniversal, and Sky. Investors monitor its infrastructure-heavy cash flows and content assets in a competitive streaming landscape.
Technically concerning: RSI(14) at 25.2 (oversold) with bearish MA alignment (price < MA20 < MA50 < MA200). Stock tests 52-week low (-26.3% YoY), showing sustained downtrend. Extreme proximity to support warrants caution.
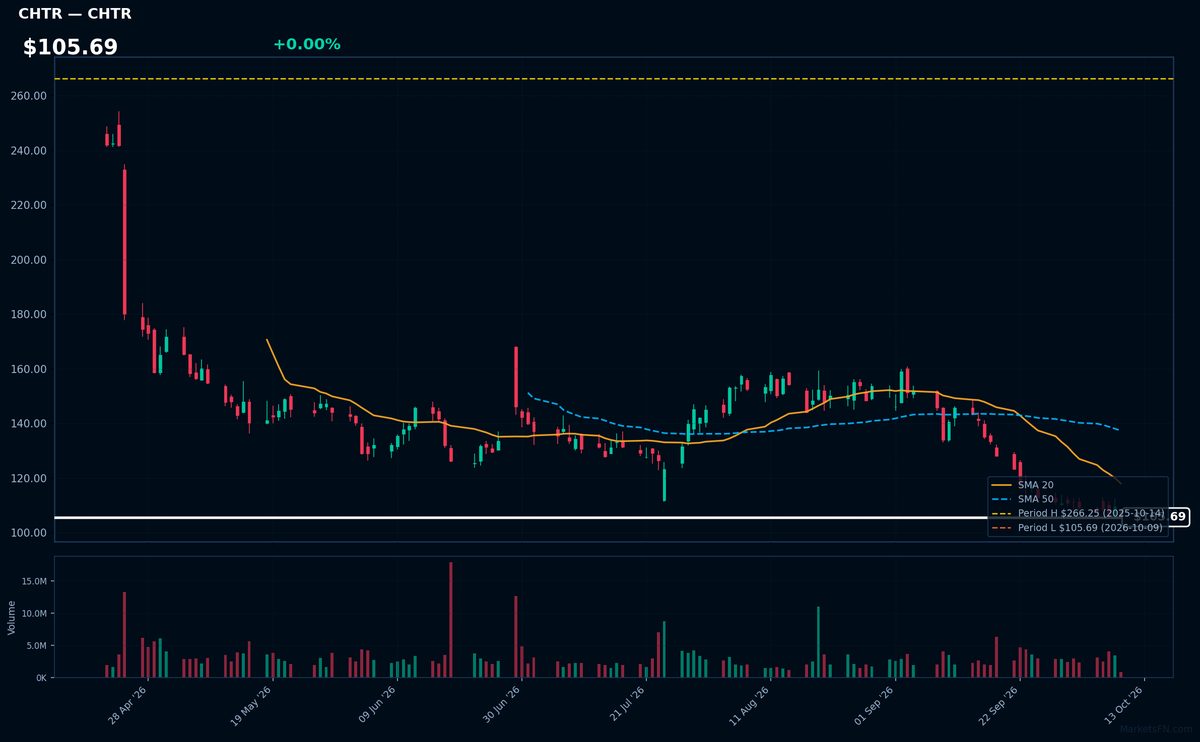
CHTR | Charter Communications Inc | Communication Services | Price Last: $105.69 | % Realized: -60.12% | RSI: 29.4 | % above MA200: -38.7% | Trend: Below MA20, MA50, MA200
Charter Communications Inc (CHTR) operates as a broadband connectivity and cable operator, providing essential internet, TV, and voice services to residential/commercial customers. Investors watch CHTR for its infrastructure dominance in underserved markets and recurring revenue model tied to connectivity demand.
Technically, CHTR shows severe weakness: RSI(14) at 29.4 (oversold) with bearish MA alignment (price < MA20 < MA50 < MA200) and -60.1% 52-week return. The stock tests its 52-week low (0.0% above), signaling breakdown risk.
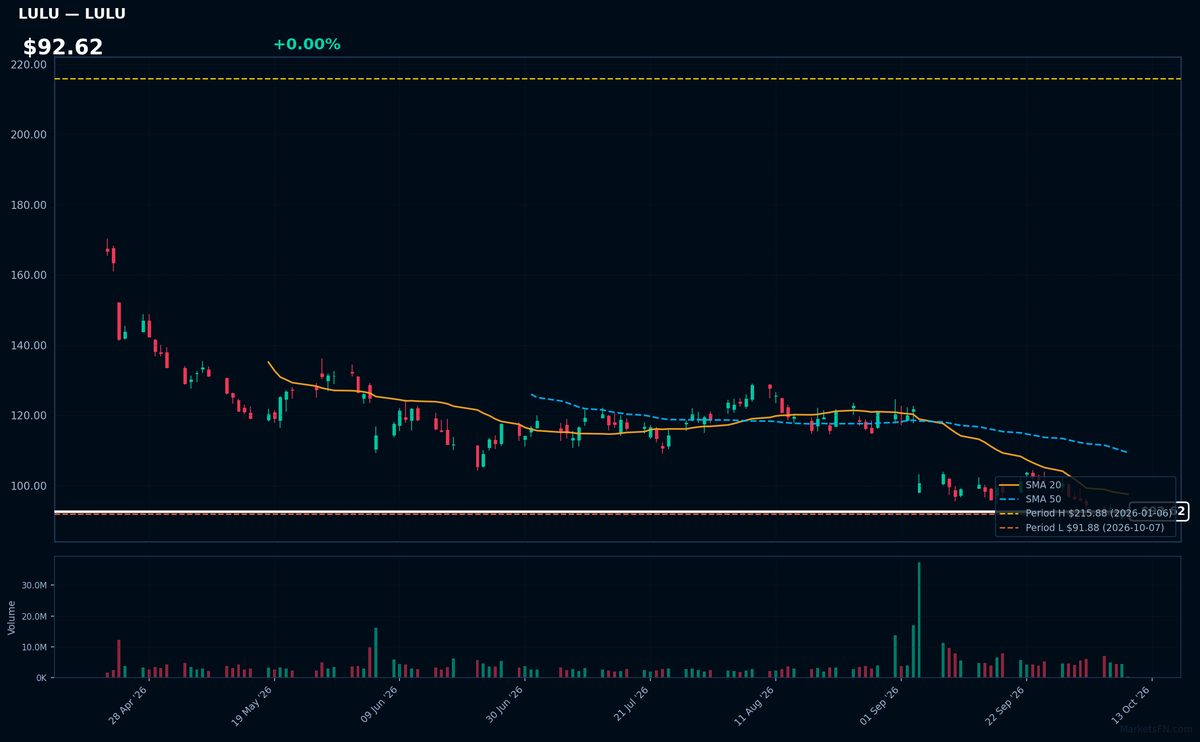
LULU | Lululemon Athletica inc | Consumer Cyclical | Price Last: $92.57 | % Realized: -46.64% | RSI: 33.5 | % above MA200: -34.8% | Trend: Below MA20, MA50, MA200
Lululemon designs premium athletic apparel and accessories, dominating the high-growth athleisure market with cult-like brand loyalty. Investors care because its direct-to-consumer model commands premium pricing and 60% gross margins, though recent China slowdown raises execution risks.
Technically dire: RSI 33.5 shows oversold conditions amid bearish MA alignment (price < MA20 < MA50 < MA200). Stock tests 52-week lows (-46.6% YTD) with just 0.8% buffer, signaling breakdown risk if support fails.
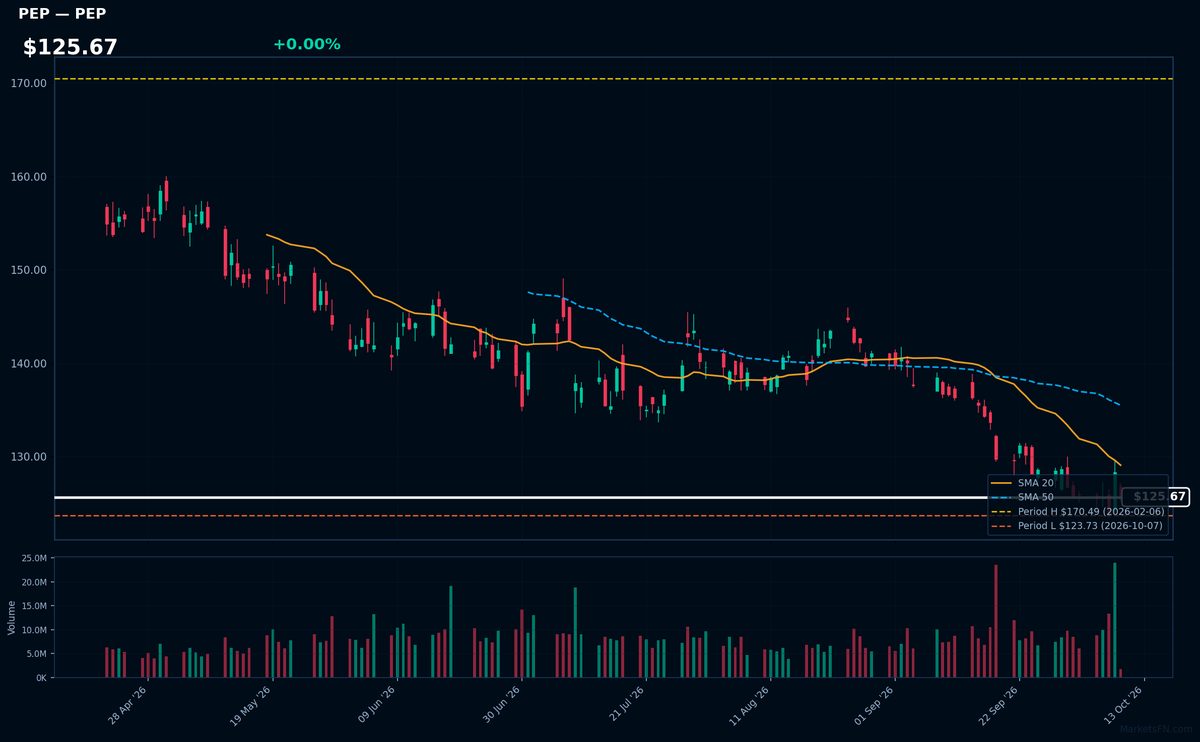
PEP | PepsiCo Inc | Consumer Defensive | Price Last: $125.67 | % Realized: -13.16% | RSI: 36.3 | % above MA200: -14.3% | Trend: Below MA20, MA50, MA200
PepsiCo Inc operates a global food and beverage portfolio including Pepsi, Frito-Lay, Quaker, and Tropicana, with resilient demand across economic cycles. Investors care for its stable cash flows, 2.4% dividend yield, and pricing power in snacks/beverages despite recent underperformance.
Technically concerning: RSI(14) at 36.3 shows oversold conditions amid bearish MA alignment (price < MA20 < MA50 < MA200). Trading just 1.6% above 52-week lows after a -13.2% decline, PEP tests critical support. Downtrend intact.
Market Commentary
The clustering of tech-heavy Nasdaq 100 names like FTNT, TEAM, AAPL, and MSFT near 52-week highs suggests sustained institutional confidence in cybersecurity (FTNT), collaboration software (TEAM), and mega-cap tech resilience despite macro uncertainty. Conversely, telecom/media (TMUS, CMCSA, CHTR) and consumer discretionary (LULU) languishing near 52-week lows reflects pressure from rising rates and slowing broadband/capex growth.
Divergence within tech highlights bifurcated sector trends: Cloud infrastructure and AI beneficiaries (MSFT) outperform, while consumer-facing tech and capex-sensitive telecoms struggle. Macro drivers include sticky software margins (TEAM’s 0.0% from high) versus consumer spending fatigue (PEP +1.6% from low). The 2.5%-2.7% pullback in AAPL/BIIB from highs suggests cautious profit-taking ahead of earnings.
Monitor whether FTNT/TEAM sustain breakout momentum above current levels (0.0% from highs) or face resistance. For laggards, TMUS/CHTR at 0.0% above lows need to hold support; a breakdown could signal broader telecom weakness. Near-term catalysts include cloud spending guidance (MSFT) and consumer health data (LULU/PEP). Strictly observe the 52-week thresholds as inflection points.
Methodology: All 101 Nasdaq 100 constituents screened. 52-week high = highest daily close over the past 252 trading days (approx. 1 year). 52-week low = lowest daily close over the same period. Distance = (current price / extreme − 1) × 100. Technical indicators computed on up to 1 year of daily OHLCV data.
Disclaimer: For informational purposes only. Not investment advice. Past performance is not indicative of future results.