Nasdaq 100 2026 YTD Highs & Lows Radar: Palantir (PLTR), Lululemon Athletica inc (LULU) and more
MarketsFN Team

Screening all 101 Nasdaq 100 constituents for stocks nearest to their 2026 year-to-date high and their 2026 YTD low. Data as of October 09, 2026. % Realized = total return since Jan 1 2026.
Legend: RSI > 70 = overbought · RSI < 30 = oversold · Green % Realized = positive YTD return · Red = negative.
📈 Nearest to 2026 High
Sectors represented: Technology (5)
| Ticker | Company | Sector | Price Last | % Realized | 2026 YTD High Date | RSI | % above MA200 | Trend |
|---|---|---|---|---|---|---|---|---|
| PLTR | Palantir Technologies Inc | Technology | $198.78 | +18.42% | 2026-10-08 | 70.6 | +30.5% | Above MA20, MA50, MA200 |
| TEAM | Atlassian Corporation | Technology | $203.57 | +31.54% | 2026-10-08 | 65.1 | +79.7% | Above MA20, MA50, MA200 |
| AAPL | Apple Inc | Technology | $340.42 | +25.61% | 2026-09-25 | 52.2 | +17.1% | Above MA20, MA50, MA200 |
| FTNT | Fortinet Inc | Technology | $189.10 | +142.81% | 2026-10-06 | 69.6 | +55.9% | Above MA20, MA50, MA200 |
| MSFT | Microsoft Corporation | Technology | $522.61 | +10.50% | 2026-10-07 | 64.3 | +20.4% | Above MA20, MA50, MA200 |
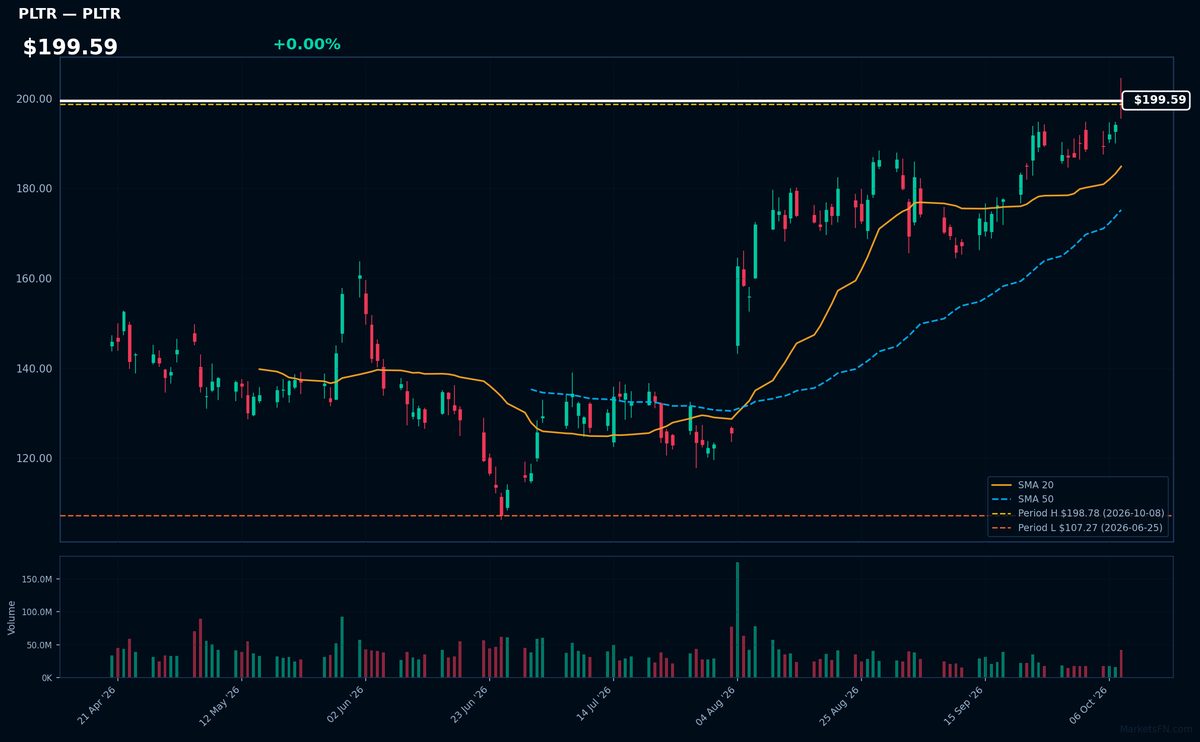
PLTR | Palantir Technologies Inc | Technology | Price Last: $198.78 | % Realized: +18.42% | RSI: 70.6 | % above MA200: +30.5% | Trend: Above MA20, MA50, MA200
Palantir provides AI-powered data analytics platforms for government and enterprise clients, specializing in national security and complex operational decision-making. Investors care due to its unique positioning in classified government contracts and growing commercial adoption of its AI/ML tools.
Technically overbought (RSI 70.6) but with bullish momentum (price > MA20 > MA50 > MA200). The 18.4% YTD surge tests all-time highs, suggesting continuation risk/reward.
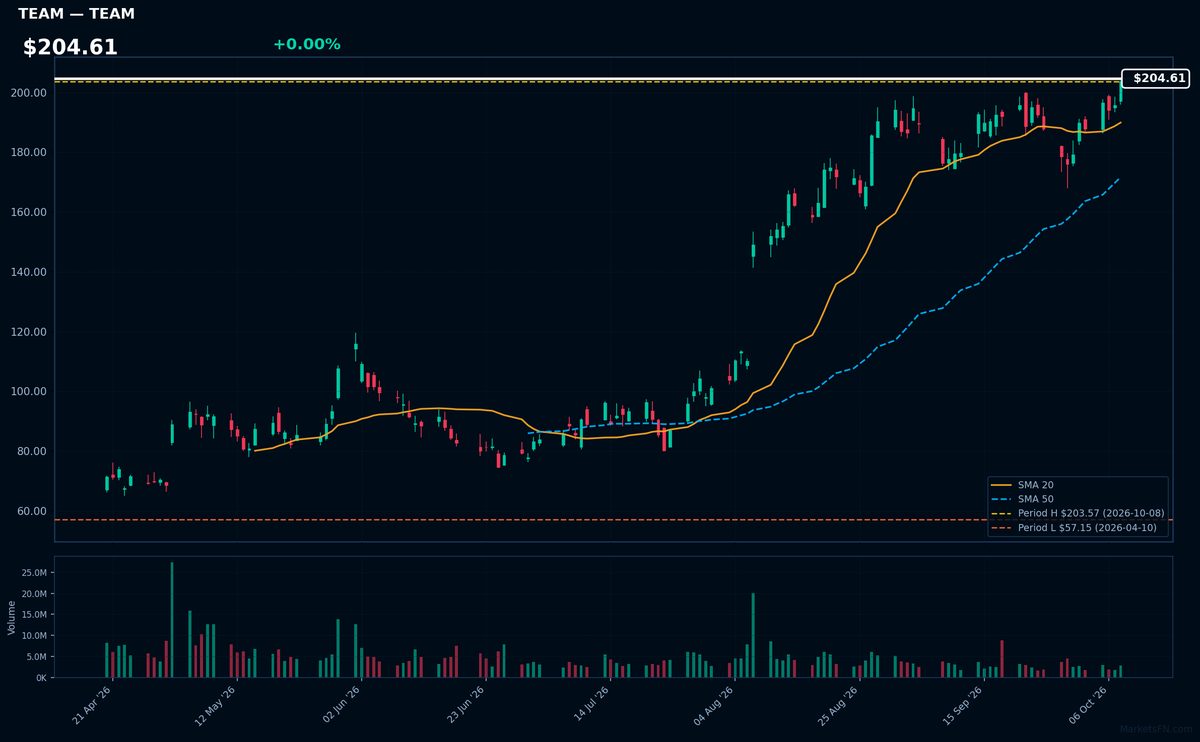
TEAM | Atlassian Corporation | Technology | Price Last: $203.57 | % Realized: +31.54% | RSI: 65.1 | % above MA200: +79.7% | Trend: Above MA20, MA50, MA200
Atlassian provides collaboration software (Jira, Confluence) for agile development teams. Investors care because its tools are essential for modern software development workflows, creating sticky enterprise subscriptions with high renewal rates.
TEAM shows bullish momentum (RSI 65.1, price > MA20 > MA50 > MA200) after a 31.5% YTD rally, now testing YTD highs. The uptrend remains intact but RSI nears overbought territory.
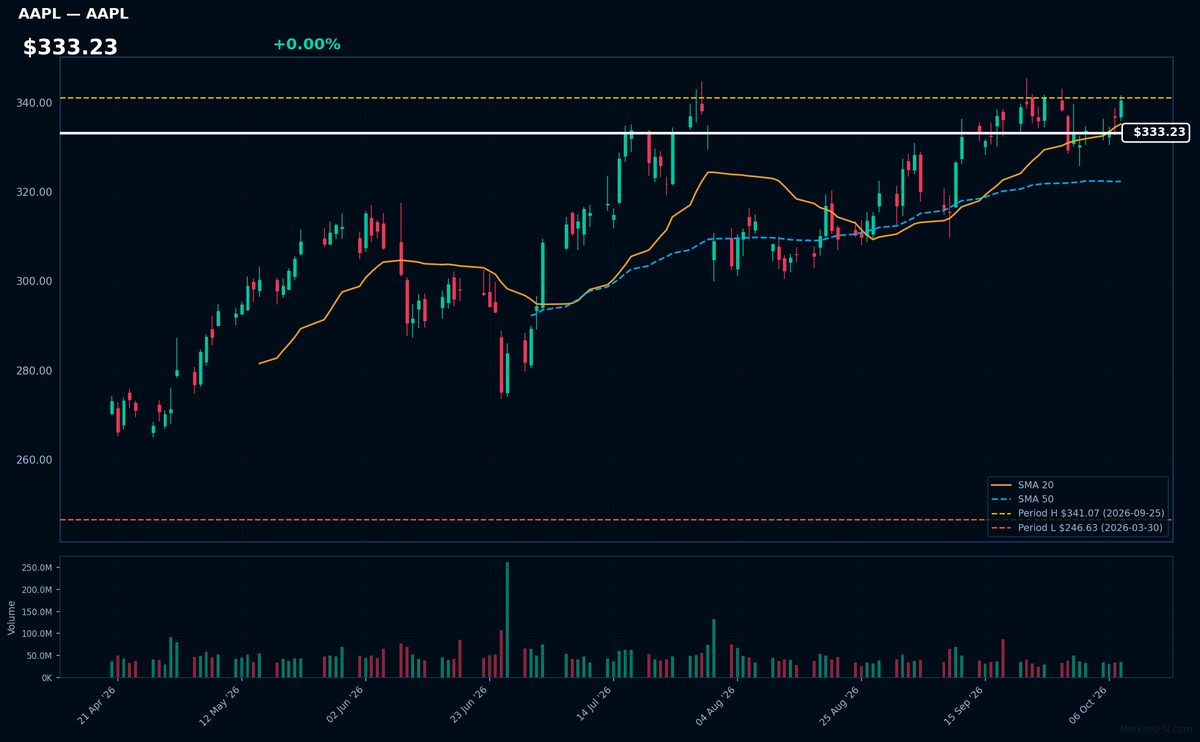
AAPL | Apple Inc | Technology | Price Last: $340.42 | % Realized: +25.61% | RSI: 52.2 | % above MA200: +17.1% | Trend: Above MA20, MA50, MA200
Apple Inc designs premium consumer electronics (iPhones, Macs), operates services (App Store, iCloud), and dominates wearables (AirPods, Apple Watch). Investors care because its ecosystem drives recurring revenue and industry-leading margins.
AAPL trades at $333.23 with mixed signals: RSI 52.2 (neutral), above MA50/MA200 but below MA20. The 25.6% YTD gain suggests momentum, but proximity to YTD highs (0.2% below) warrants caution.
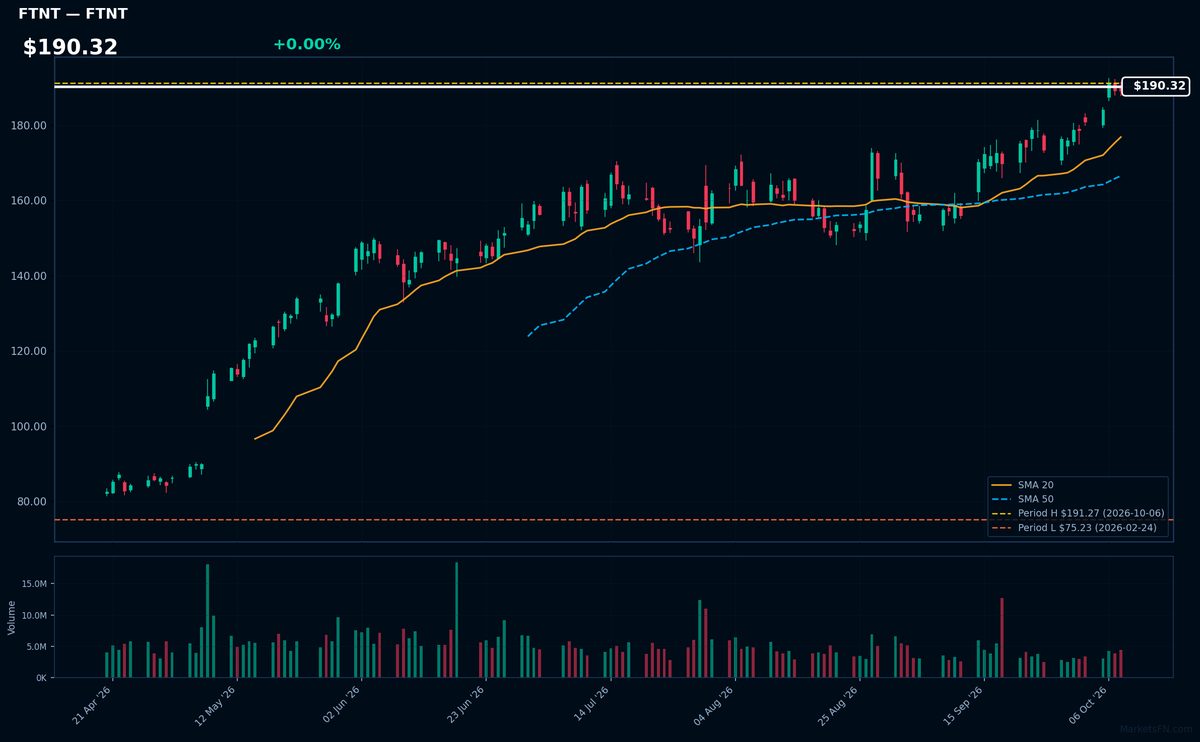
FTNT | Fortinet Inc | Technology | Price Last: $189.10 | % Realized: +142.81% | RSI: 69.6 | % above MA200: +55.9% | Trend: Above MA20, MA50, MA200
Fortinet Inc provides cybersecurity solutions like firewalls and endpoint protection, critical as digital threats grow. Investors care because its products defend corporate networks, a necessity in today's cloud-driven economy, ensuring recurring revenue from security subscriptions.
Fortinet shows bullish momentum with price > MA20 > MA50 > MA200 (RSI 69.6 nearing overbought). At 1.1% below its 2026 YTD high after a 142.8% YTD surge, it tests breakout levels—watch for consolidation or continuation.
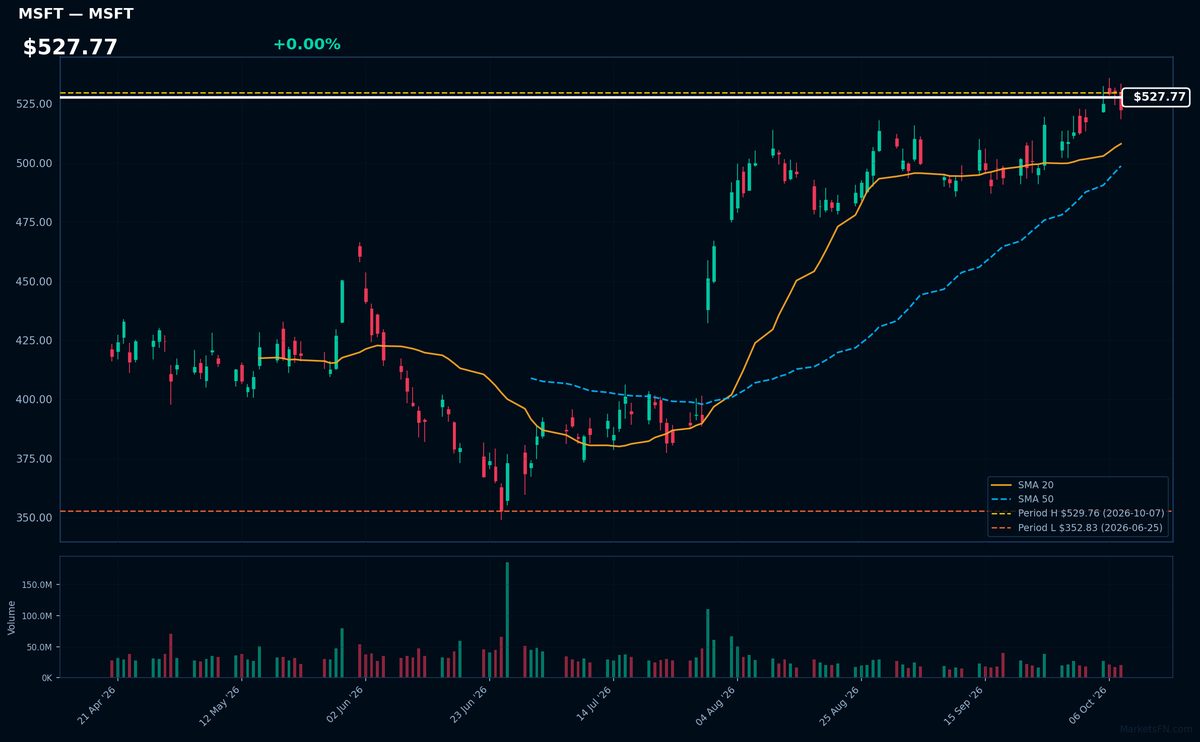
MSFT | Microsoft Corporation | Technology | Price Last: $522.61 | % Realized: +10.50% | RSI: 64.3 | % above MA200: +20.4% | Trend: Above MA20, MA50, MA200
Microsoft dominates enterprise software (Azure cloud, Office 365, Windows) and gaming (Xbox), with growing AI integration across products. Investors care for its cash flow durability (35% operating margins) and cloud/AI leadership sustaining double-digit revenue growth.
Technically bullish with RSI(14) at 64.3 and price > MA20 > MA50 > MA200. The 10.5% YTD gain shows momentum, but proximity to YTD highs (1.3% below) warrants caution for near-term pullback risk.
📉 Nearest to 2026 Low
Sectors represented: Communication Services (2), Consumer Cyclical (1), Healthcare (1), Industrials (1)
| Ticker | Company | Sector | Price Last | % Realized | 2026 YTD Low Date | RSI | % above MA200 | Trend |
|---|---|---|---|---|---|---|---|---|
| LULU | Lululemon Athletica inc | Consumer Cyclical | $92.68 | -56.04% | 2026-10-07 | 33.3 | -34.7% | Below MA20, MA50, MA200 |
| CMCSA | Comcast Corp | Communication Services | $21.21 | -23.39% | 2026-10-07 | 25.9 | -20.1% | Below MA20, MA50, MA200 |
| AZN | Astrazeneca plc ADR | Healthcare | $158.78 | -13.30% | 2026-08-04 | 43.9 | -12.5% | Below MA20, MA50, MA200 |
| CHTR | Charter Communications Inc | Communication Services | $109.67 | -47.60% | 2026-10-07 | 29.8 | -36.4% | Below MA20, MA50, MA200 |
| HON | Honeywell International Inc | Industrials | $206.60 | +0.57% | 2026-09-14 | 38.7 | -10.4% | Below MA20, MA50, MA200 |
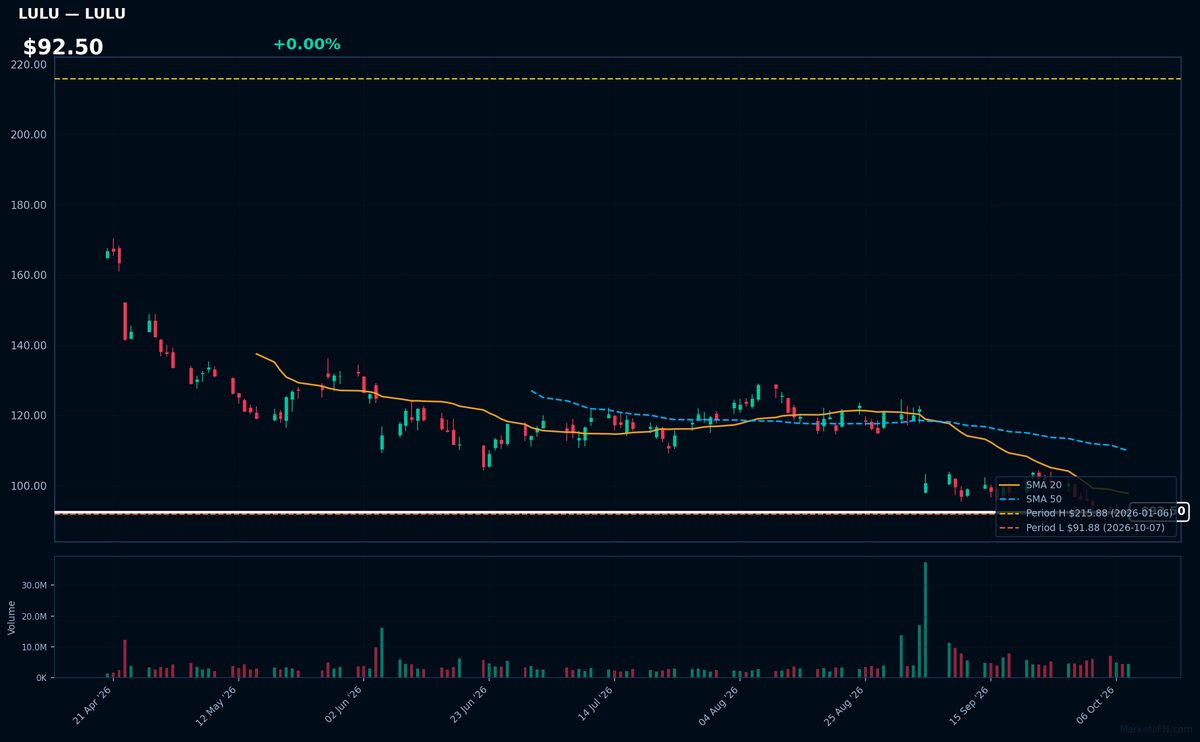
LULU | Lululemon Athletica inc | Consumer Cyclical | Price Last: $92.68 | % Realized: -56.04% | RSI: 33.3 | % above MA200: -34.7% | Trend: Below MA20, MA50, MA200
Lululemon designs premium athletic apparel and yoga wear, dominating the high-end activewear market with cult-like brand loyalty. Investors watch for its ability to maintain premium pricing power amid consumer spending shifts.
Technically broken: RSI(14) at 33.3 shows oversold conditions, but the bearish MA stack (price < MA20 < MA50 < MA200) confirms sustained downtrend. Down 56% YTD and clinging 0.9% above YTD lows signals severe weakness.
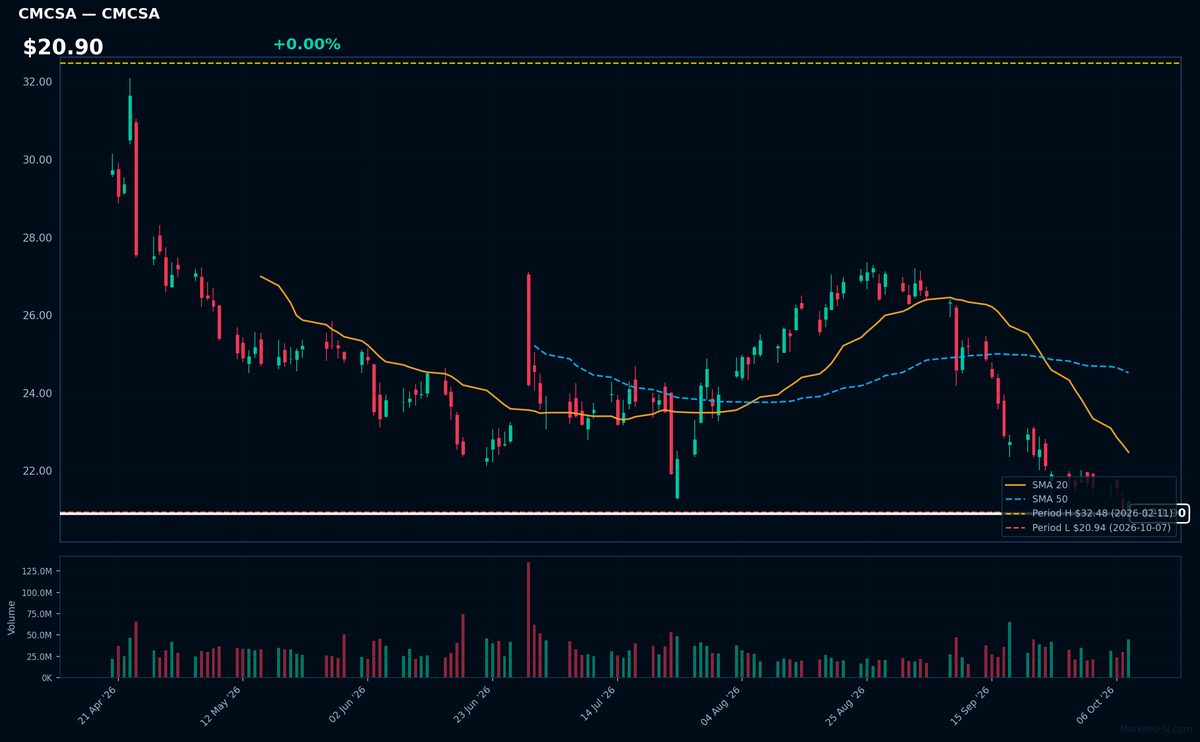
CMCSA | Comcast Corp | Communication Services | Price Last: $21.21 | % Realized: -23.39% | RSI: 25.9 | % above MA200: -20.1% | Trend: Below MA20, MA50, MA200
Comcast operates as a media and technology conglomerate, providing broadband, video, and wireless services through Xfinity, along with content via NBCUniversal. Investors watch CMCSA for its infrastructure dominance in U.S. connectivity and cyclical advertising exposure.
CMCSA shows extreme technical weakness: RSI(14) at 25.9 (oversold) with bearish MA alignment (price < MA20 < MA50 < MA200). Trading just 1.3% above YTD lows after a -23.4% decline, this signals capitulation, not momentum. The setup warns of potential breakdown unless fundamentals reverse sentiment.
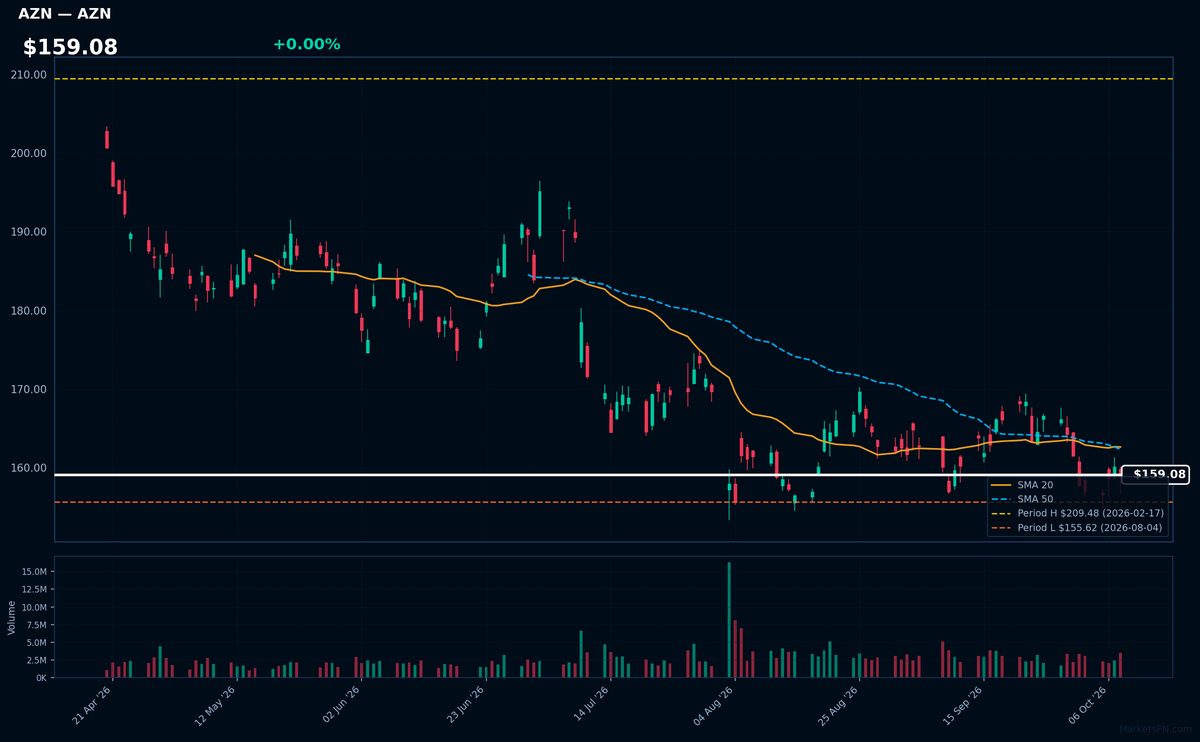
AZN | Astrazeneca plc ADR | Healthcare | Price Last: $158.78 | % Realized: -13.30% | RSI: 43.9 | % above MA200: -12.5% | Trend: Below MA20, MA50, MA200
AstraZeneca develops biopharmaceuticals, including blockbuster cancer drugs and COVID-19 vaccines. Investors care because its oncology pipeline and emerging markets exposure drive growth, though patent cliffs loom for key drugs like Tagrisso.
Technically weak: RSI(14) at 43.9 shows no momentum, trading below MA20/MA50/MA200. At just 2.0% above 2026 lows (-13.3% YTD), this tests critical support.
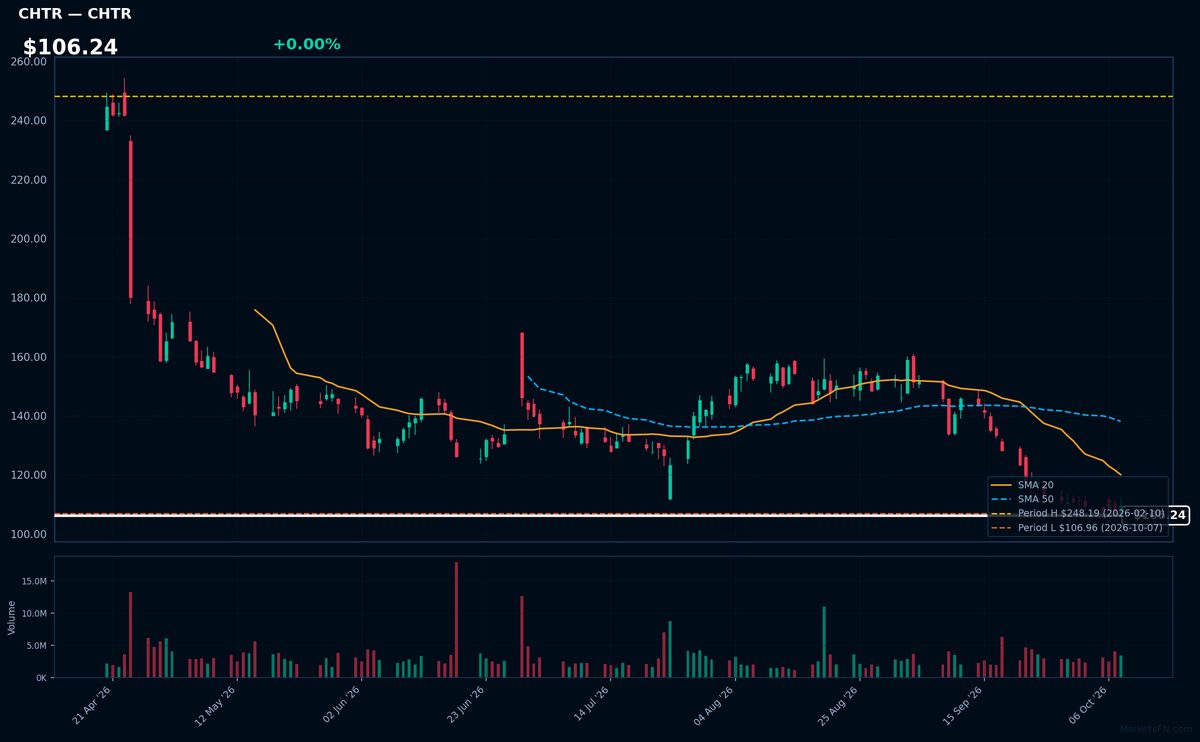
CHTR | Charter Communications Inc | Communication Services | Price Last: $109.67 | % Realized: -47.60% | RSI: 29.8 | % above MA200: -36.4% | Trend: Below MA20, MA50, MA200
Charter Communications Inc provides cable TV, internet, and voice services to residential and business customers, operating under the Spectrum brand. Investors monitor its performance as a key player in the competitive U.S. broadband and pay-TV markets, where subscriber trends and pricing power directly impact cash flows.
CHTR shows extreme technical weakness: RSI(14) at 29.8 signals oversold conditions, while a sustained downtrend (price < MA20 < MA50 < MA200) confirms bearish momentum. The stock trades just 2.5% above its 2026 low after a -47.6% YTD plunge, testing critical support levels.
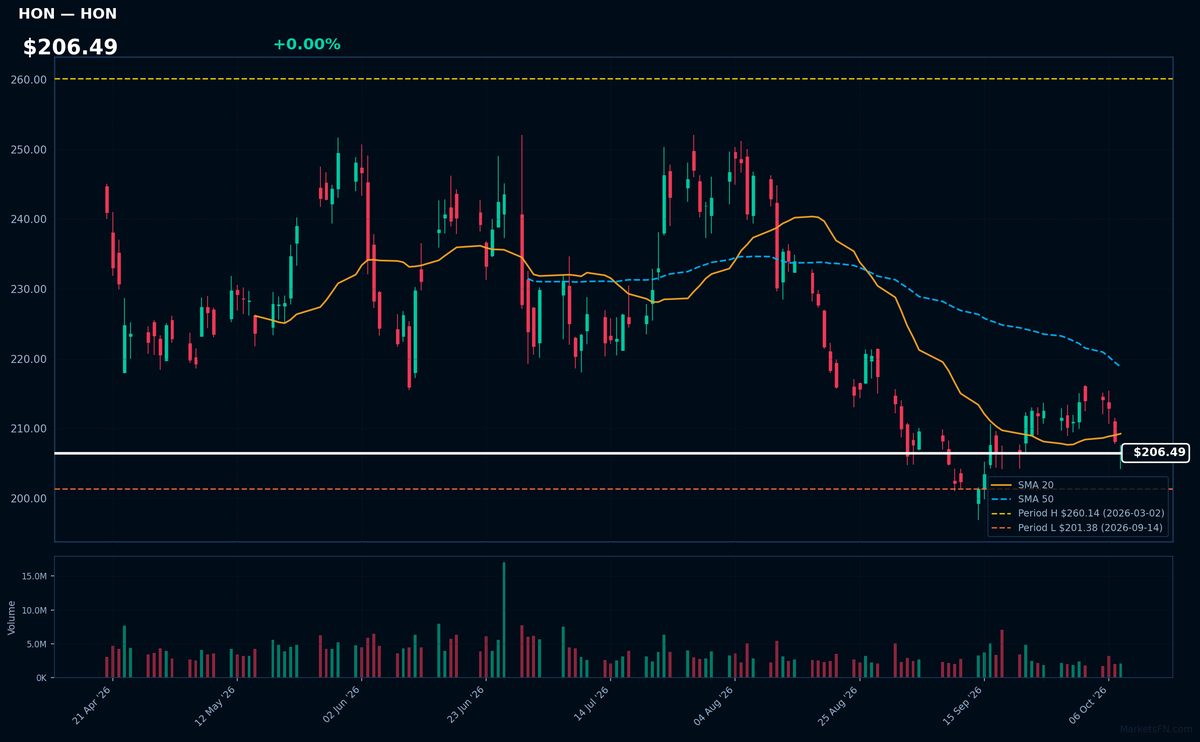
HON | Honeywell International Inc | Industrials | Price Last: $206.60 | % Realized: +0.57% | RSI: 38.7 | % above MA200: -10.4% | Trend: Below MA20, MA50, MA200
Honeywell International Inc operates in aerospace, building technologies, performance materials, and safety solutions, serving critical industrial and commercial markets. Investors care for its diversified high-tech portfolio and stable government/industrial contracts, providing resilience amid economic cycles.
HON shows bearish momentum: RSI(14) at 38.7 signals near-oversold conditions, while price ($206.49) sits below all key MAs (MA20 < MA50 < MA200). Testing 2026 YTD lows (+2.6%) suggests weakening support—a caution flag despite the 0.6% YTD gain.
Market Commentary
The Nasdaq 100's 2026 YTD extremes reveal a stark divergence in tech performance, with Palantir (PLTR) and Atlassian (TEAM) holding at all-time highs while Apple (AAPL) and Microsoft (MSFT) linger just -0.2% and -1.3% below peaks. Conversely, Lululemon (LULU) and Comcast (CMCSA) hover near lows at +0.9% and +1.3% above troughs, signaling weak demand for consumer discretionary and telecom names. This suggests investors are rewarding pure-play AI and cloud infrastructure firms while punishing legacy-dependent or cyclical exposures.
The bifurcation reflects macro pressures favoring efficiency-focused tech: cybersecurity (Fortinet -1.1% from high) and enterprise software dominate as rate-sensitive sectors (Charter +2.5% above low) struggle. Bond market volatility and AI adoption timelines are compressing valuations, with high-margin SaaS models like Atlassian (0.0% from high) absorbing tighter liquidity better than capital-intensive firms like Honeywell (+2.6% above low). The Fed's policy path remains critical—any dovish shift could revive depressed infrastructure plays.
Traders should monitor relative strength in AI beneficiaries (PLTR, MSFT) versus consumer tech (AAPL) for rotation signals. A sustained break above 2026 highs in cybersecurity (FTNT) or breakdown in resilient pharma (AstraZeneca +2.0% above low) may confirm sector leadership. Key risk: If 10Y yields rebound, currently depressed names (CHTR, HON) could face renewed selling pressure.
Methodology: All 101 Nasdaq 100 constituents screened. Close prices downloaded from 2026-01-01. Period high = highest close since Jan 1 2026; period low = lowest close since Jan 1 2026. Distance = (current price / period extreme − 1) × 100. Technical indicators computed on up to 1 year of daily OHLCV data.
Disclaimer: For informational purposes only. Not investment advice. Past performance is not indicative of future results.