S&P 500 2026 YTD Highs & Lows Radar: Palantir (PLTR), Hormel Foods (HRL) and more
MarketsFN Team

Screening all 503 S&P 500 constituents for stocks nearest to their 2026 year-to-date high and their 2026 YTD low. Data as of October 09, 2026. % Realized = total return since Jan 1 2026.
Legend: RSI > 70 = overbought · RSI < 30 = oversold · Green % Realized = positive YTD return · Red = negative.
📈 Nearest to 2026 High
Sectors represented: Energy (2), Technology (1), Healthcare (1), Consumer Defensive (1)
| Ticker | Company | Sector | Price Last | % Realized | 2026 YTD High Date | RSI | % above MA200 | Trend |
|---|---|---|---|---|---|---|---|---|
| PLTR | Palantir Technologies Inc | Technology | $198.78 | +18.42% | 2026-10-08 | 71.5 | +30.5% | Above MA20, MA50, MA200 |
| ABBV | Abbvie Inc | Healthcare | $272.42 | +18.80% | 2026-10-08 | 68.8 | +17.1% | Above MA20, MA50, MA200 |
| PM | Philip Morris International Inc | Consumer Defensive | $200.50 | +25.08% | 2026-10-08 | 65.6 | +12.1% | Above MA20, MA50, MA200 |
| MPC | Marathon Petroleum Corp | Energy | $463.34 | +180.57% | 2026-10-08 | 78.2 | +72.5% | Above MA20, MA50, MA200 |
| PSX | Phillips 66 | Energy | $281.60 | +115.67% | 2026-10-08 | 73.6 | +50.1% | Above MA20, MA50, MA200 |
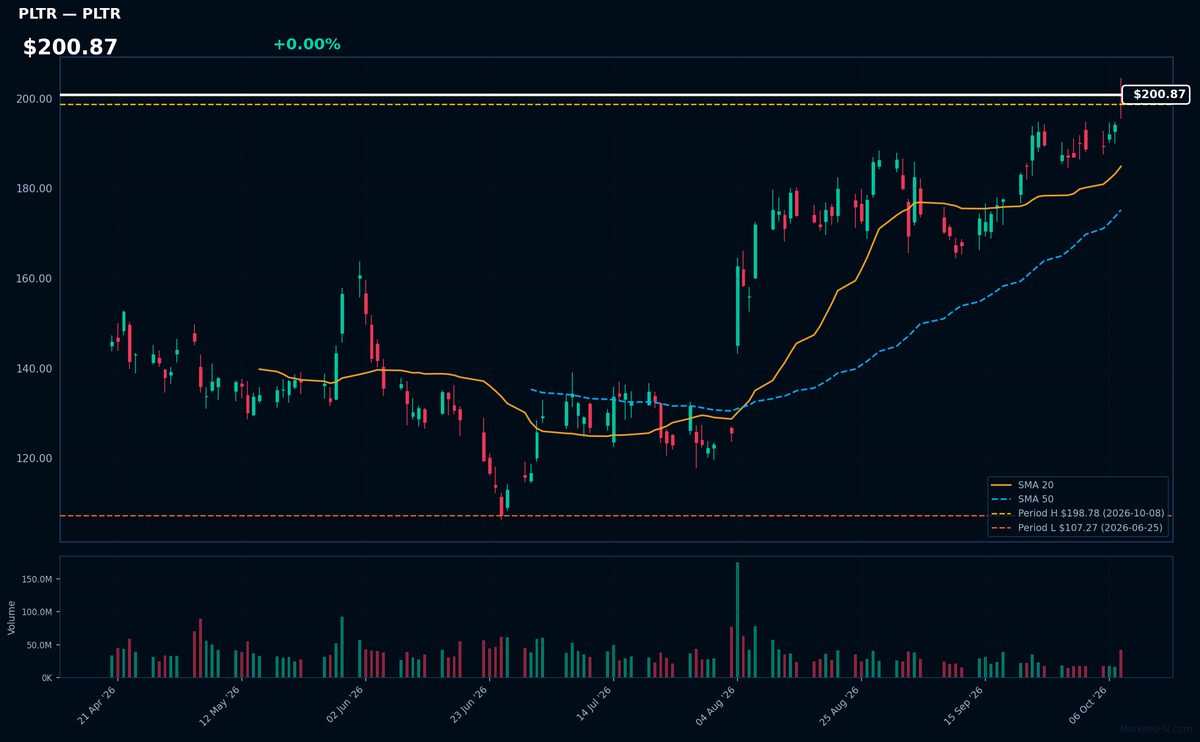
PLTR | Palantir Technologies Inc | Technology | Price Last: $198.78 | % Realized: +18.42% | RSI: 71.5 | % above MA200: +30.5% | Trend: Above MA20, MA50, MA200
Palantir provides AI-powered data analytics platforms for government and commercial clients, specializing in national security and enterprise decision-making. Investors care due to its unique positioning in classified government contracts and growing commercial adoption of its AI/ML tools.
PLTR shows strong momentum with bullish MA alignment (price > MA20 > MA50 > MA200) and overbought RSI(71.5). The stock sits at its YTD high after gaining 18.4% in 2026, suggesting continuation potential but requiring caution near extremes.
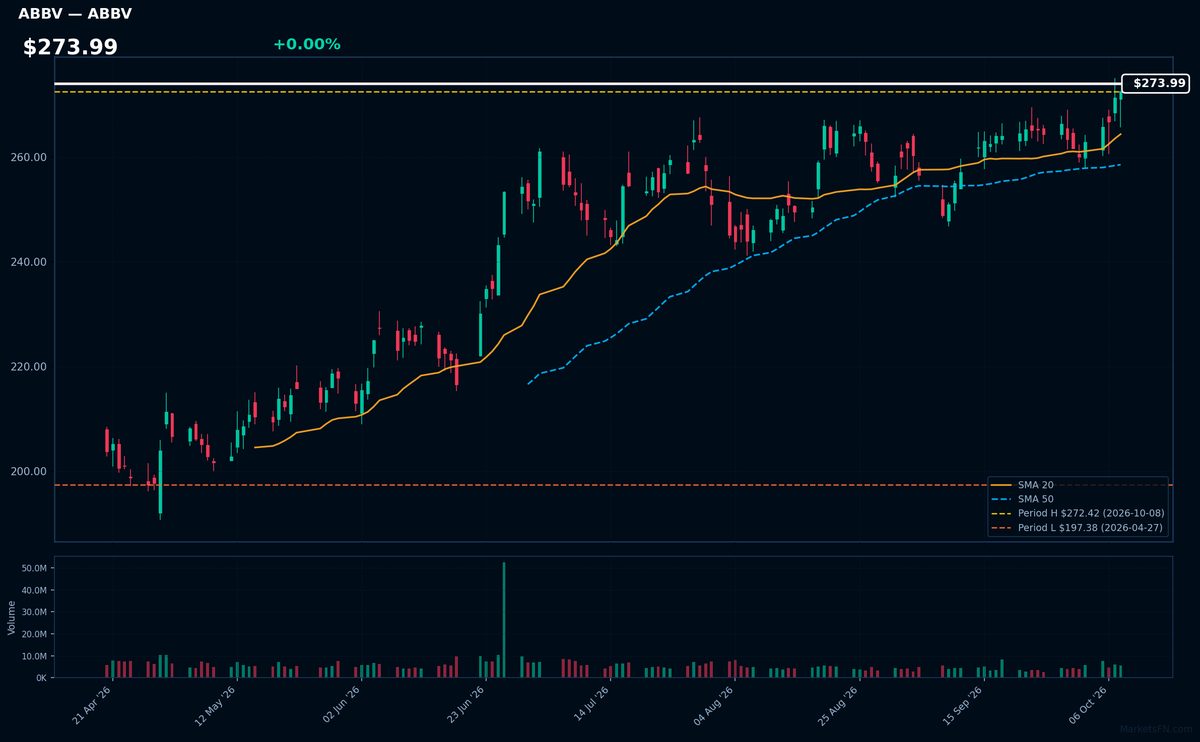
ABBV | Abbvie Inc | Healthcare | Price Last: $272.42 | % Realized: +18.80% | RSI: 68.8 | % above MA200: +17.1% | Trend: Above MA20, MA50, MA200
AbbVie dominates immunology with blockbuster Humira and newer biologics Skyrizi/Rinvoq, while building an oncology pipeline through acquisitions. Investors care for its transition to post-Humira growth, 3.6% dividend yield, and cash flow stability despite patent cliffs.
Technically bullish (price $273.99 > MA20 > MA50 > MA200) with RSI(14) at 68.8 nearing overbought. Stock sits 0.0% below YTD high after 18.8% 2026 gains — watch for breakout confirmation or pullback from extended levels.
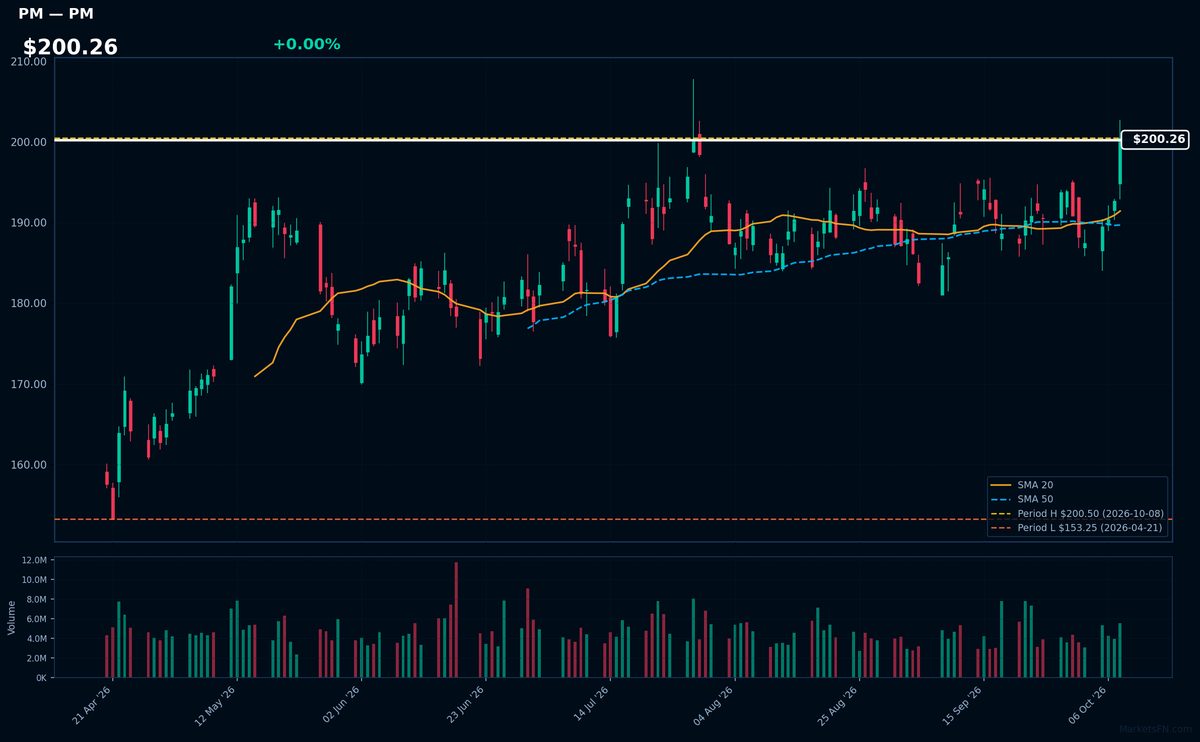
PM | Philip Morris International Inc | Consumer Defensive | Price Last: $200.50 | % Realized: +25.08% | RSI: 65.6 | % above MA200: +12.1% | Trend: Above MA20, MA50, MA200
Philip Morris International manufactures and sells cigarettes, heated tobacco, and nicotine products outside the U.S., including Marlboro and IQOS. Investors care because it dominates global tobacco outside China while transitioning to reduced-risk products, with stable cash flows supporting its 5.7% dividend yield.
PM shows strong bullish momentum with RSI(14) at 65.6 and price > MA20 > MA50 > MA200. The stock sits 0.0% below its 2026 high after gaining 25.1% YTD, suggesting sustained uptrend potential but nearing overbought territory.
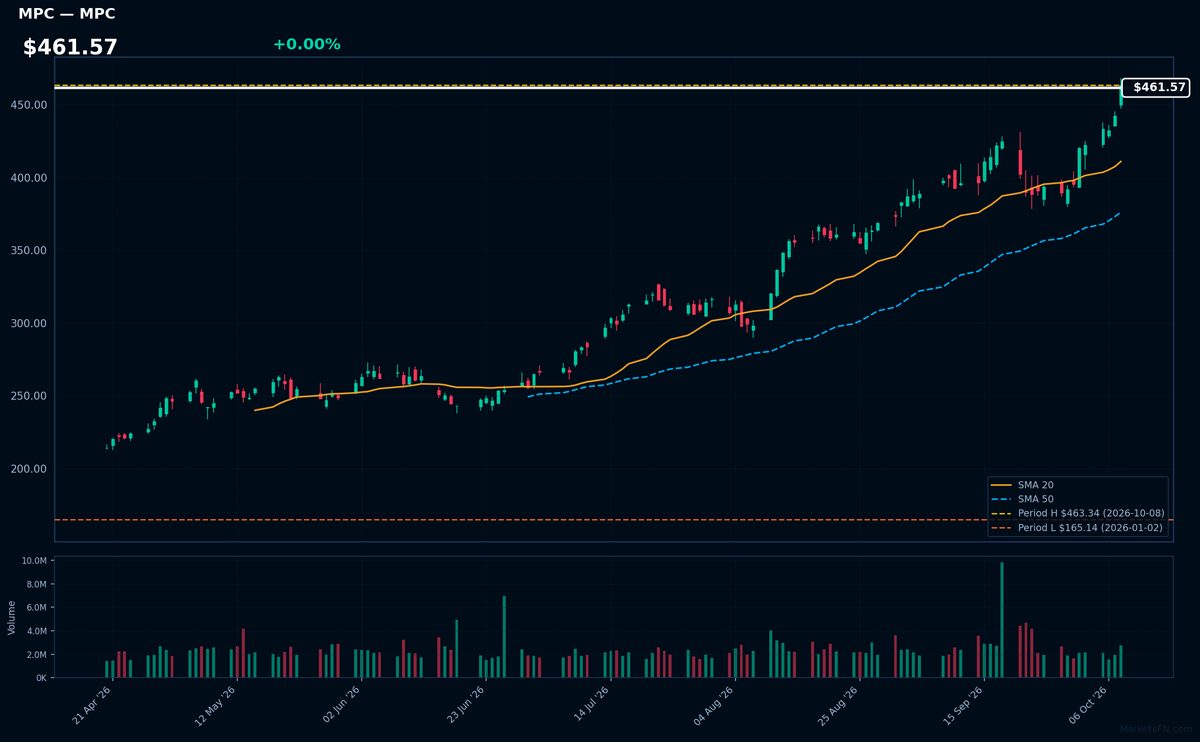
MPC | Marathon Petroleum Corp | Energy | Price Last: $463.34 | % Realized: +180.57% | RSI: 78.2 | % above MA200: +72.5% | Trend: Above MA20, MA50, MA200
Marathon Petroleum operates refineries processing 3M barrels/day and a 5,500-mile pipeline network, directly exposed to crack spreads and fuel demand cycles. Investors watch its ability to capitalize on volatile energy margins through its integrated midstream/downstream assets.
Technically overbought (RSI 78.2) but with bullish MA alignment (price > MA20 > MA50 > MA200) after 180.6% YTD surge. Extreme proximity to YTD highs suggests momentum continuation risk/reward.
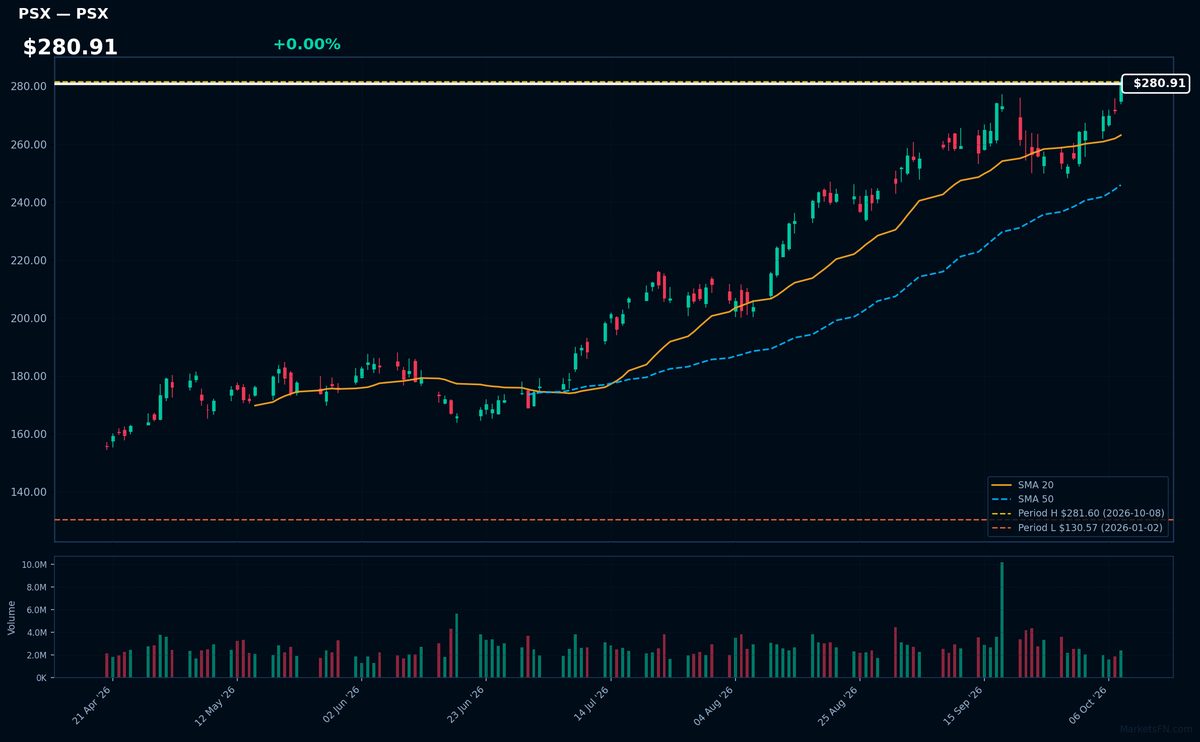
PSX | Phillips 66 | Energy | Price Last: $281.60 | % Realized: +115.67% | RSI: 73.6 | % above MA200: +50.1% | Trend: Above MA20, MA50, MA200
Phillips 66 refines, transports, and markets fuels and lubricants globally, with a growing renewable fuels segment. Investors care because its vertically integrated midstream/downstream model captures margin stability across energy cycles, while its chemical and renewable investments diversify beyond traditional refining.
Technically extreme: RSI(14) at 73.6 signals overbought conditions despite bullish MA alignment (price > MA20 > MA50 > MA200). The 115.7% YTD surge to $280.91—testing all-time highs—suggests speculative momentum, not fundamental support. Watch for mean reversion.
📉 Nearest to 2026 Low
Sectors represented: Basic Materials (2), Consumer Cyclical (2), Consumer Defensive (1)
| Ticker | Company | Sector | Price Last | % Realized | 2026 YTD Low Date | RSI | % above MA200 | Trend |
|---|---|---|---|---|---|---|---|---|
| HRL | Hormel Foods Corp | Consumer Defensive | $19.42 | -16.97% | 2026-10-08 | 25.8 | -15.8% | Below MA20, MA50, MA200 |
| MOS | Mosaic Company | Basic Materials | $19.73 | -21.14% | 2026-10-08 | 26.3 | -19.1% | Below MA20, MA50, MA200 |
| ALB | Albemarle Corp | Basic Materials | $102.10 | -29.06% | 2026-10-08 | 32.3 | -33.9% | Below MA20, MA50, MA200 |
| LKQ | LKQ Corp | Consumer Cyclical | $22.01 | -26.71% | 2026-10-08 | 30.8 | -21.4% | Below MA20, MA50, MA200 |
| MGM | MGM Resorts International | Consumer Cyclical | $30.01 | -17.76% | 2026-10-07 | 14.5 | -24.2% | Below MA20, MA50, MA200 |
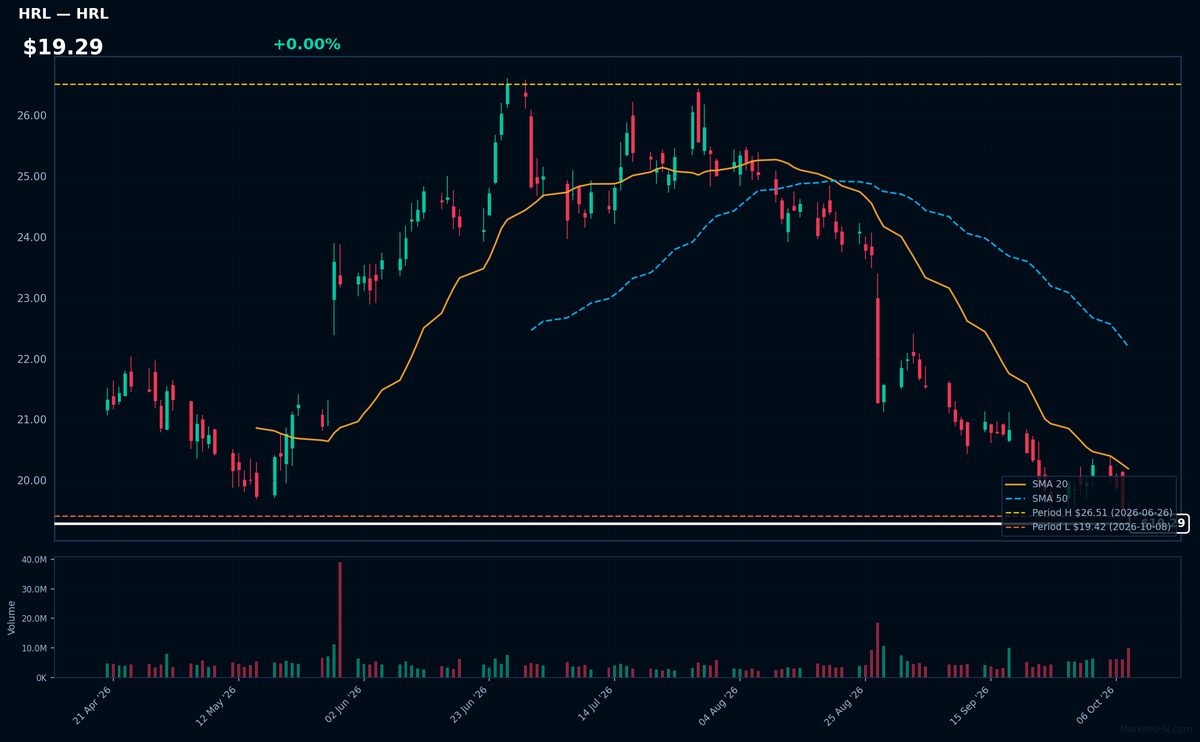
HRL | Hormel Foods Corp | Consumer Defensive | Price Last: $19.42 | % Realized: -16.97% | RSI: 25.8 | % above MA200: -15.8% | Trend: Below MA20, MA50, MA200
Hormel Foods produces branded shelf-stable meats (SPAM, Hormel chili), refrigerated foods (Jennie-O turkey), and plant-based proteins. Investors watch it as a defensive consumer staples play with pricing power in processed foods, though exposed to commodity costs.
Technically broken: RSI 25.8 shows oversold conditions amid bearish MA alignment (price < MA20 < MA50 < MA200). Testing 2026 lows after -17.0% YTD decline warns of persistent downtrend unless fundamentals reverse.
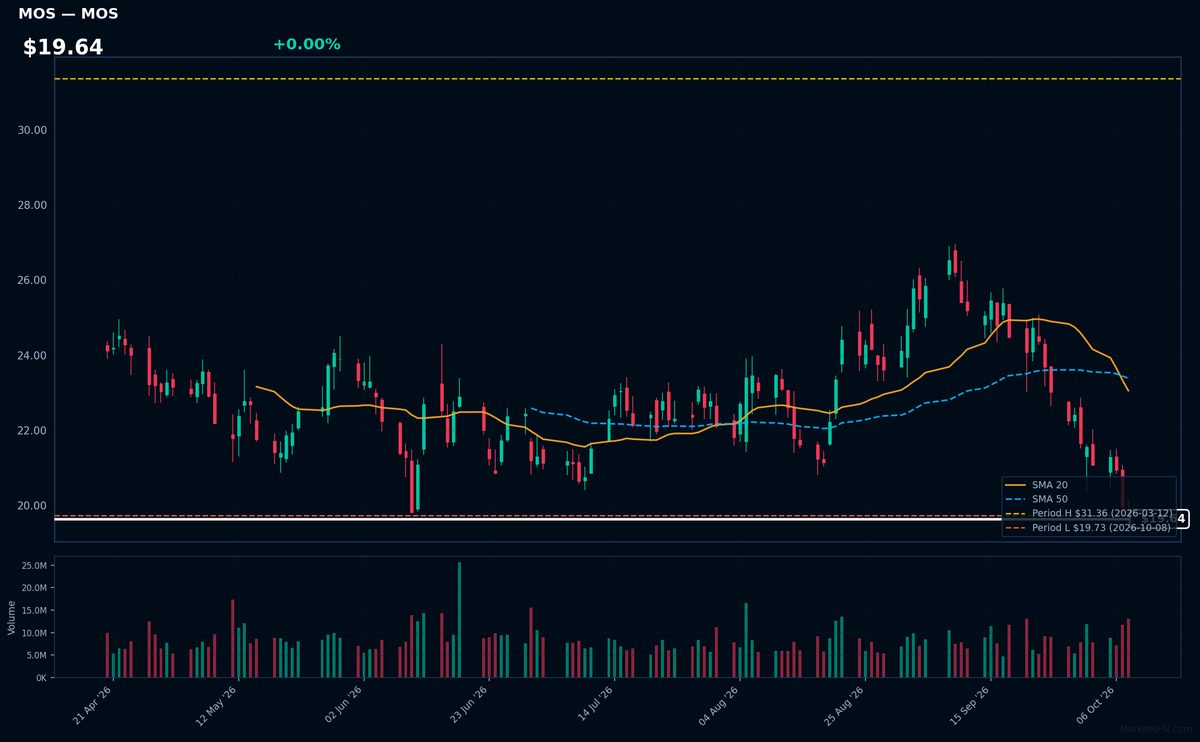
MOS | Mosaic Company | Basic Materials | Price Last: $19.73 | % Realized: -21.14% | RSI: 26.3 | % above MA200: -19.1% | Trend: Below MA20, MA50, MA200
Mosaic Company produces concentrated phosphate and potash crop nutrients, critical for global agriculture. Investors watch MOS as a leveraged play on fertilizer demand cycles and food security trends, with volatile earnings tied to commodity prices and farm economics.
Technically extreme: RSI(14) at 26.3 signals oversold conditions amid bearish MA alignment (price < MA20 < MA50 < MA200). Testing 2026 lows after -21.1% YTD decline warns of persistent selling pressure.
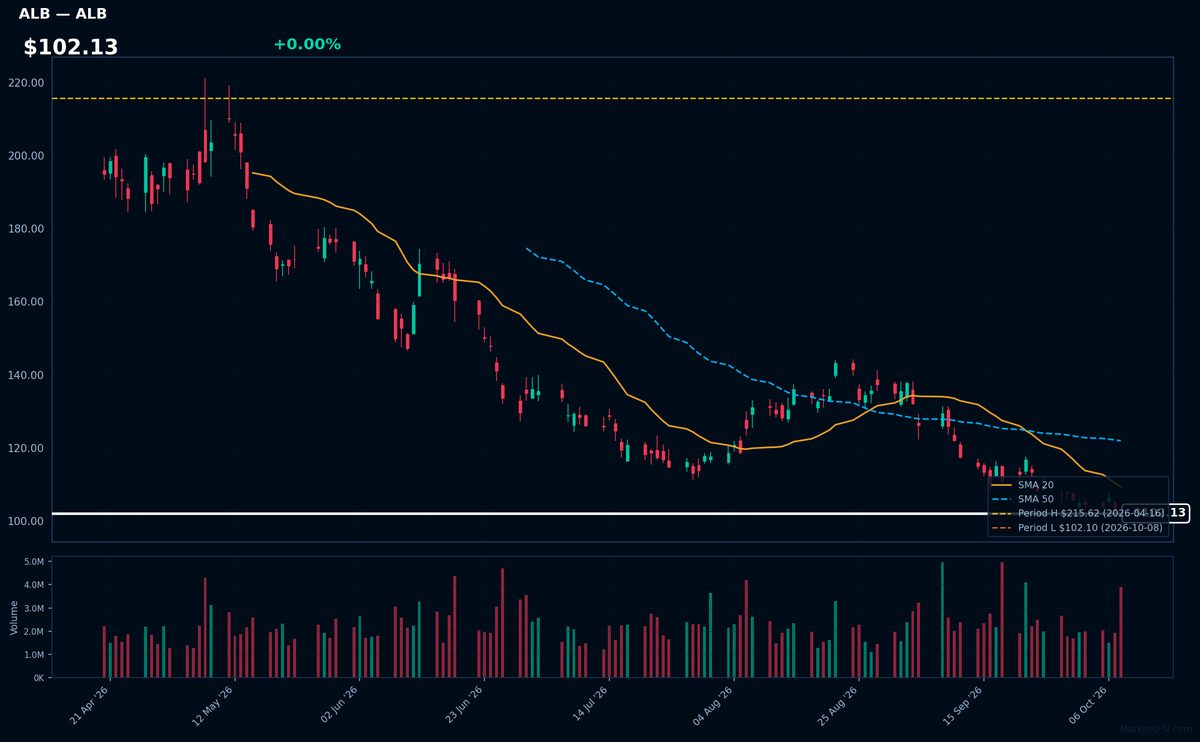
ALB | Albemarle Corp | Basic Materials | Price Last: $102.10 | % Realized: -29.06% | RSI: 32.3 | % above MA200: -33.9% | Trend: Below MA20, MA50, MA200
Albemarle Corp is a leading global producer of lithium, bromine, and catalysts critical for electric vehicle batteries, flame retardants, and refining. Investors monitor ALB as a key EV supply chain play with exposure to lithium price cycles and energy transition trends.
ALB shows severe technical weakness: RSI(14) at 32.3 confirms oversold conditions amid a sustained downtrend (price < MA20 < MA50 < MA200). The stock tests critical support, down 29.1% YTD in 2026. This alignment signals persistent selling pressure, not fundamental strength.
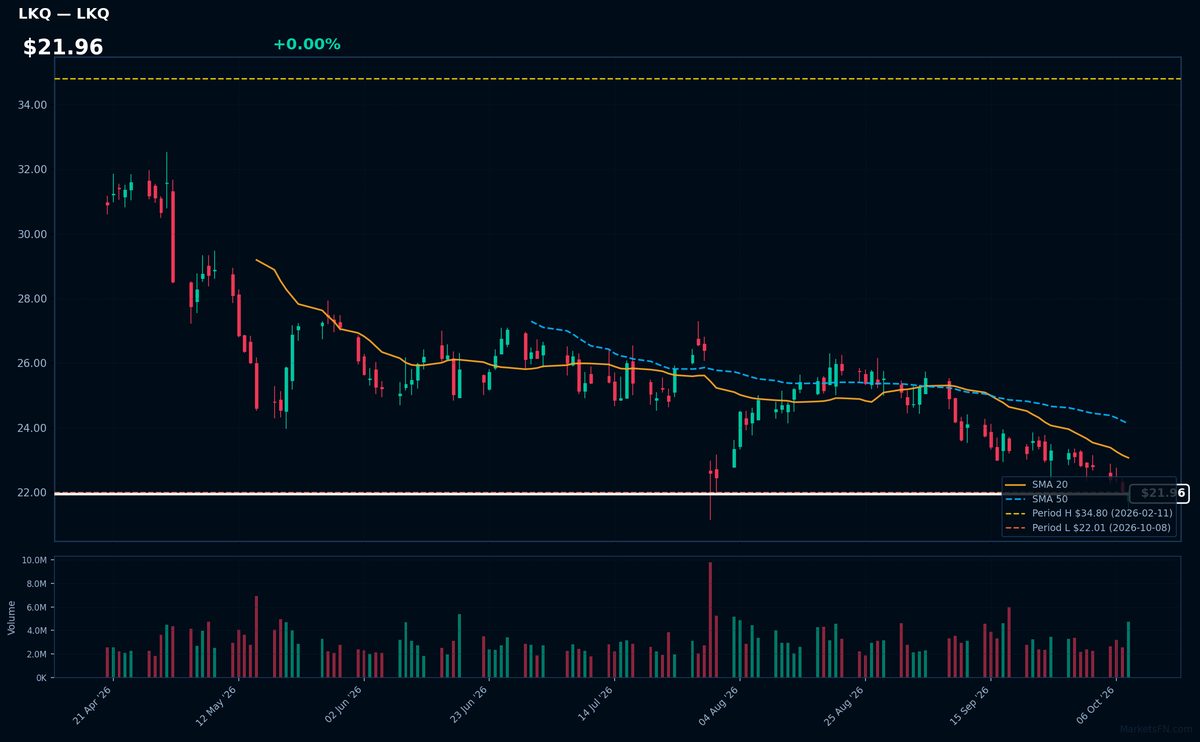
LKQ | LKQ Corp | Consumer Cyclical | Price Last: $22.01 | % Realized: -26.71% | RSI: 30.8 | % above MA200: -21.4% | Trend: Below MA20, MA50, MA200
LKQ Corp is a leading distributor of vehicle replacement parts, serving collision repair shops and mechanical service providers. Investors should care because its aftermarket parts business provides cost-effective alternatives to OEM parts, benefiting from insurance industry partnerships and steady demand from aging vehicle fleets.
LKQ shows extreme technical weakness: RSI(14) at 30.8 signals near-oversold conditions, while the bearish MA alignment (price < MA20 < MA50 < MA200) confirms a sustained downtrend. The stock trades just 0.0% above its 2026 low after a -26.7% YTD plunge—testing critical support.
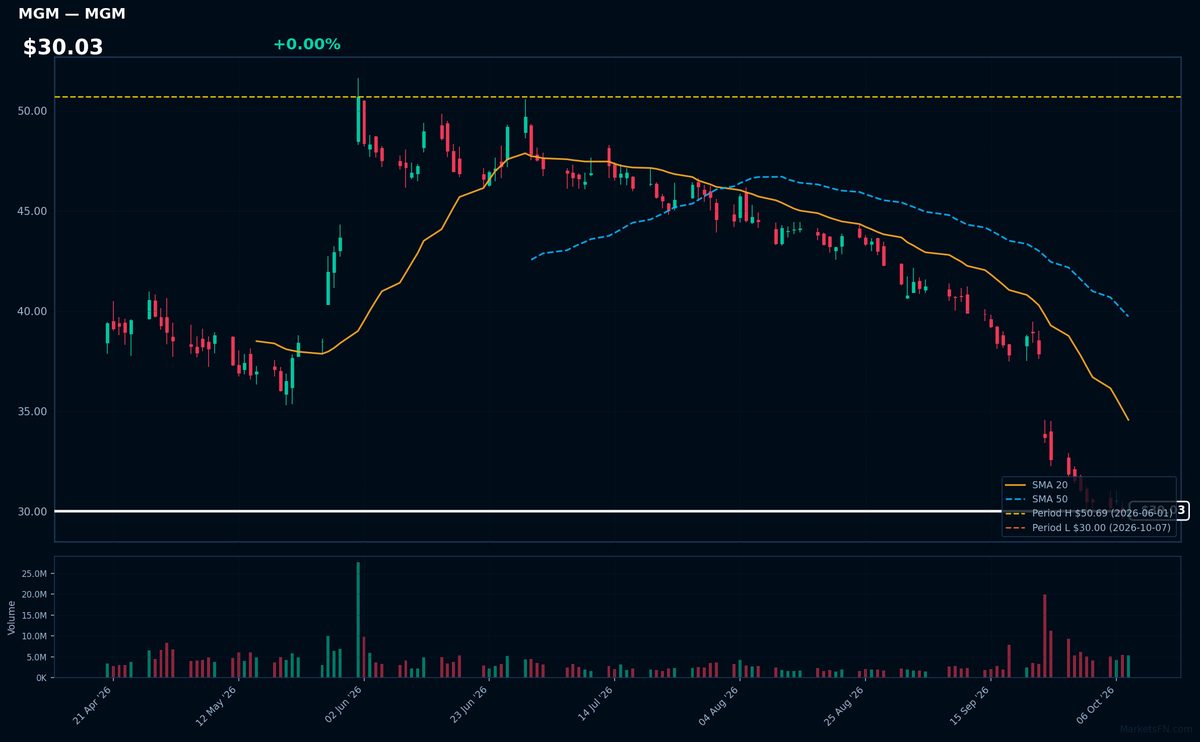
MGM | MGM Resorts International | Consumer Cyclical | Price Last: $30.01 | % Realized: -17.76% | RSI: 14.5 | % above MA200: -24.2% | Trend: Below MA20, MA50, MA200
MGM Resorts International owns and operates iconic casino resorts like Bellagio and MGM Grand in Las Vegas, Macau, and regional US markets. Investors watch MGM for its high-beta exposure to consumer discretionary spending, gaming demand cycles, and real estate value of its premium casino properties.
MGM shows extreme technical weakness at RSI(14) of 14.5 with a sustained downtrend (price $30.03 below all key MAs). The stock tests critical support at just 0.0% above its 2026 low after a -17.8% YTD decline — a clear warning sign of capitulation.
Market Commentary
The fact that PLTR, ABBV, PM, MPC, and PSX are trading at their 2026 highs suggests strong investor conviction in sectors like defense technology (PLTR), pharmaceuticals (ABBV), tobacco (PM), and energy refining (MPC, PSX). Conversely, HRL, MOS, ALB, LKQ, and MGM hovering near 2026 lows reflects persistent weakness in consumer staples (HRL), agriculture (MOS), lithium (ALB), auto parts (LKQ), and gaming (MGM). These extremes highlight a bifurcated market where cyclical and growth-oriented names thrive while defensive and commodity-linked stocks lag.
Sector themes reveal a preference for companies with pricing power (ABBV, PM) and energy beneficiaries (MPC, PSX) amid inflationary pressures. The laggards face sector-specific headwinds: soft agricultural commodity prices (MOS), lithium oversupply (ALB), and discretionary spending concerns (MGM). The energy-refining duo (MPC, PSX) at highs suggests tight fuel markets, while PLTR’s strength aligns with AI/defense demand. The clustering near extremes indicates low dispersion, where winners and losers are narrowly defined by macro and sector trends.
Investors should monitor whether these extremes mark exhaustion points or sustained trends. For highs, watch energy margins and AI adoption; for lows, track lithium demand recovery (ALB) and consumer spending shifts (HRL, MGM). Sector rotation risks loom if inflation cools or growth slows abruptly. The next catalyst may be earnings guidance from these names to confirm or contradict their current positioning.
Methodology: All 503 S&P 500 constituents screened. Close prices downloaded from 2026-01-01. Period high = highest close since Jan 1 2026; period low = lowest close since Jan 1 2026. Distance = (current price / period extreme − 1) × 100. Technical indicators computed on up to 1 year of daily OHLCV data.
Disclaimer: For informational purposes only. Not investment advice. Past performance is not indicative of future results.