S&P 500 52-Week Highs & Lows Radar: Microsoftoration (MSFT), Copart, (CPRT) and more
MarketsFN Team

Screening all 503 S&P 500 constituents for stocks nearest to their 52-week high and their 52-week low. Data as of October 13, 2026. % Realized = 52-week total return.
Legend: RSI > 70 = overbought · RSI < 30 = oversold · Green % Realized = positive 52W return · Red = negative.
📈 Nearest to 52-Week High
Sectors represented: Technology (3), Financial (1), Energy (1)
| Ticker | Company | Sector | Price Last | % Realized | 52-Week High Date | RSI | % above MA200 | Trend |
|---|---|---|---|---|---|---|---|---|
| MSFT | Microsoft Corporation | Technology | $549.91 | +6.98% | 2026-10-13 | 72.9 | +26.5% | Above MA20, MA50, MA200 |
| AAPL | Apple Inc | Technology | $343.83 | +38.83% | 2026-10-13 | 63.1 | +18.0% | Above MA20, MA50, MA200 |
| V | Visa Inc | Financial | $392.40 | +14.30% | 2026-10-13 | 71.9 | +15.9% | Above MA20, MA50, MA200 |
| XOM | Exxon Mobil Corp | Energy | $173.83 | +54.87% | 2026-10-13 | 71.3 | +15.2% | Above MA20, MA50, MA200 |
| PLTR | Palantir Technologies Inc | Technology | $210.10 | +18.56% | 2026-10-13 | 76.9 | +37.8% | Above MA20, MA50, MA200 |
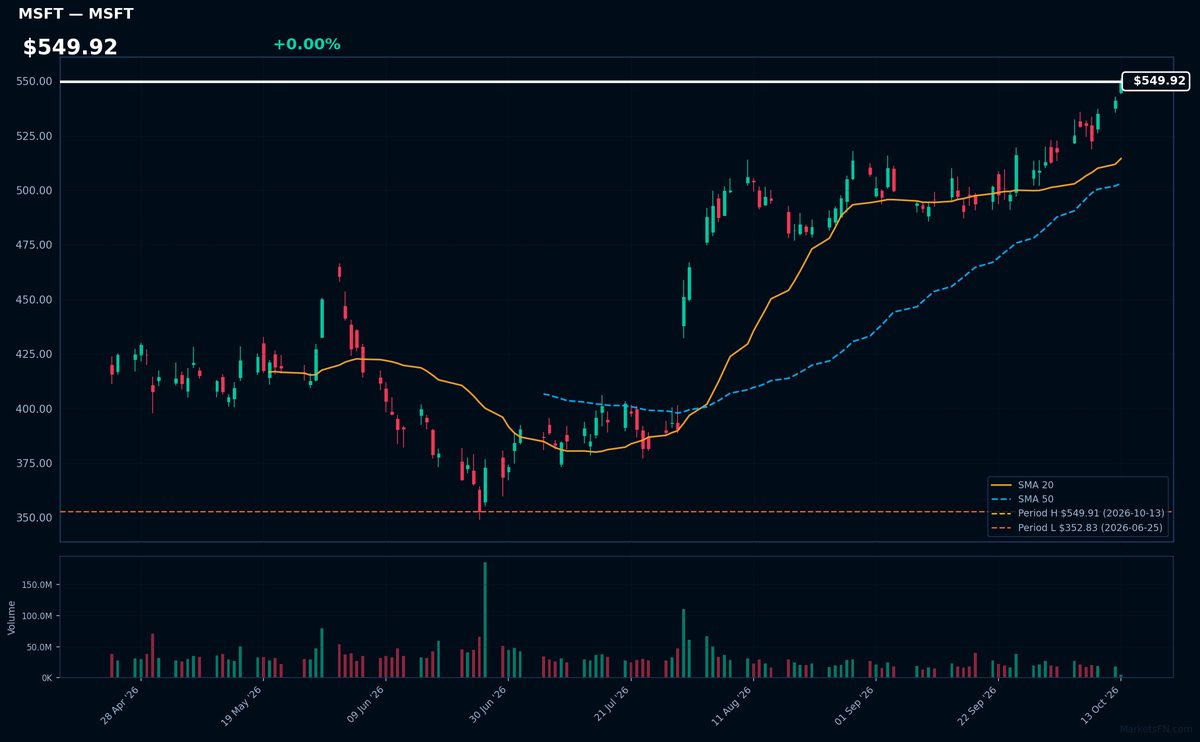
MSFT | Microsoft Corporation | Technology | Price Last: $549.91 | % Realized: +6.98% | RSI: 72.9 | % above MA200: +26.5% | Trend: Above MA20, MA50, MA200
Microsoft dominates enterprise software (Azure cloud, Office 365) and gaming (Xbox), with growing AI monetization via Copilot. Investors care for its recurring revenue streams, cloud margin expansion, and positioning as an AI infrastructure leader.
Technically bullish with RSI(14) at 72.9 (overbought) but confirmed by bullish MA alignment (price > MA20 > MA50 > MA200). At 52-week highs (+7.0% YTD), momentum suggests continuation barring mean reversion.
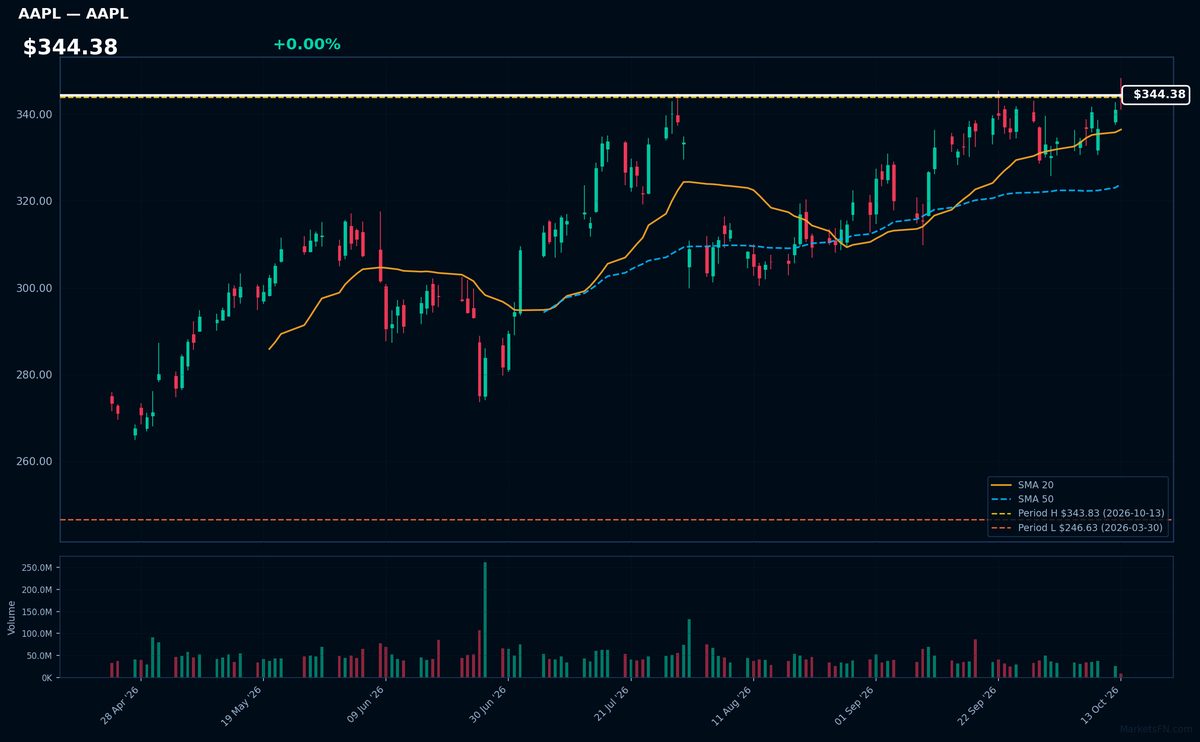
AAPL | Apple Inc | Technology | Price Last: $343.83 | % Realized: +38.83% | RSI: 63.1 | % above MA200: +18.0% | Trend: Above MA20, MA50, MA200
Apple designs premium consumer electronics (iPhone, Mac, Apple Watch) and operates high-margin services (App Store, iCloud). Investors care due to its pricing power, ecosystem lock-in, and $344B market cap — making it a core tech holding with recurring revenue streams.
Technically bullish: RSI(14) at 63.1 shows momentum without overbought conditions, confirmed by bullish MA alignment (price > MA20 > MA50 > MA200). Stock tests 52-week highs after 38.8% annual return — watch for breakout confirmation.
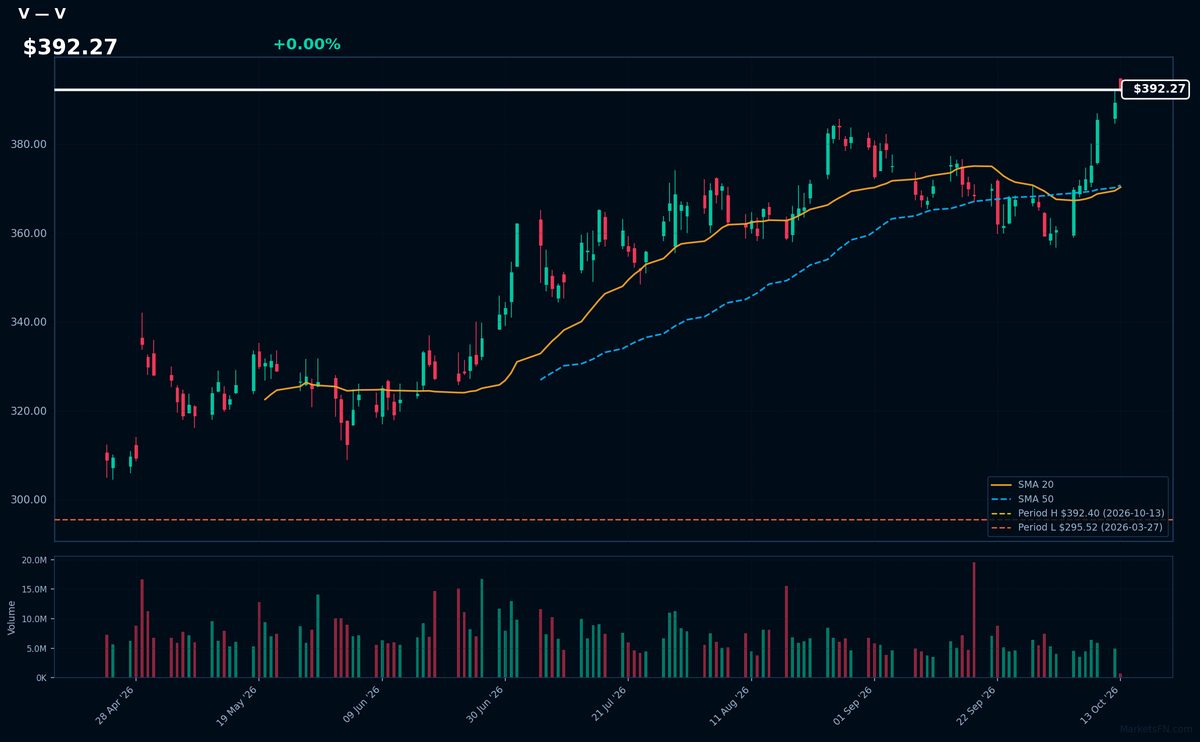
V | Visa Inc | Financial | Price Last: $392.40 | % Realized: +14.30% | RSI: 71.9 | % above MA200: +15.9% | Trend: Above MA20, MA50, MA200
Visa operates the world's largest payment network, processing over $14 trillion annually. Investors care because it's a capital-light toll bridge on global digital payments growth, with 60%+ operating margins and recession-resistant revenue streams from transaction fees.
Technically overbought (RSI 71.9) but bullish with price above all MAs (20/50/200) and testing 52-week highs (+14.3% YTD). Mixed signals suggest consolidation may precede next leg up.
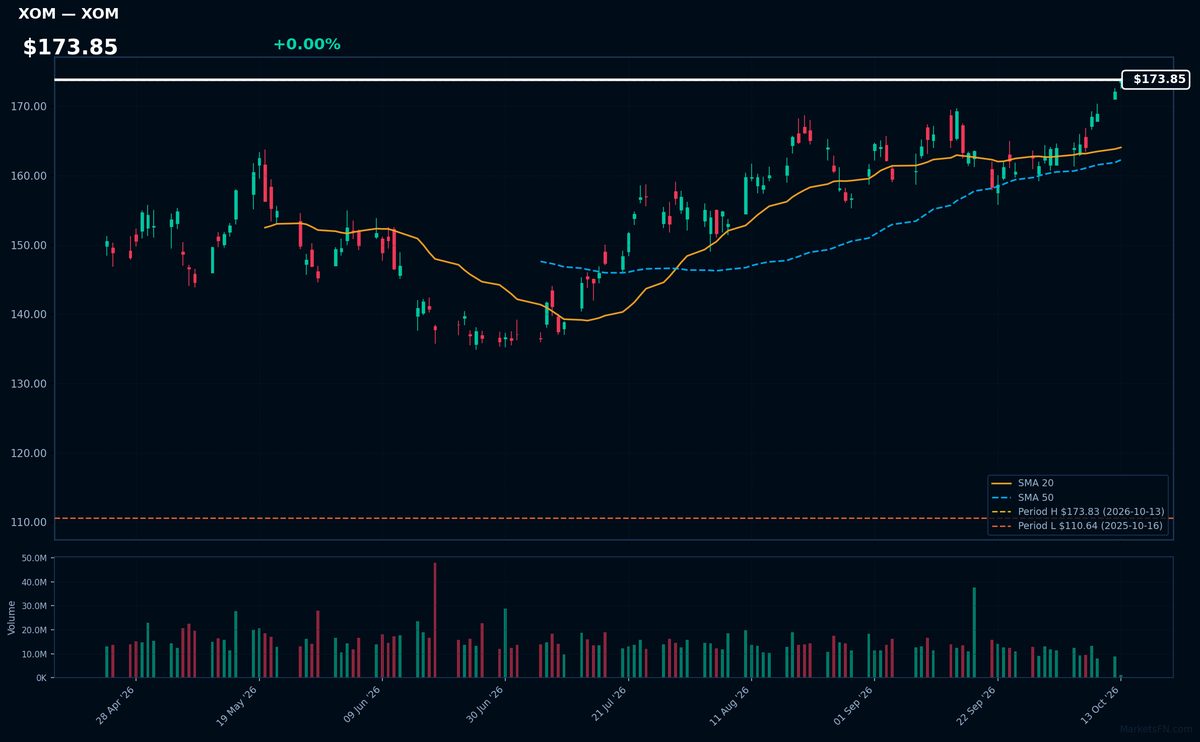
XOM | Exxon Mobil Corp | Energy | Price Last: $173.83 | % Realized: +54.87% | RSI: 71.3 | % above MA200: +15.2% | Trend: Above MA20, MA50, MA200
Exxon Mobil Corp (XOM) is an integrated energy giant spanning oil/gas production, refining, and chemical manufacturing. Investors care due to its scale, dividend reliability, and direct exposure to energy prices—critical as global demand fluctuates and geopolitical risks persist.
Technically bullish: RSI(14) at 71.3 (overbought) but with sustained uptrend (price > MA20 > MA50 > MA200). Stock tests 52-week high after 54.9% annual return—momentum extreme but no reversal signal yet.
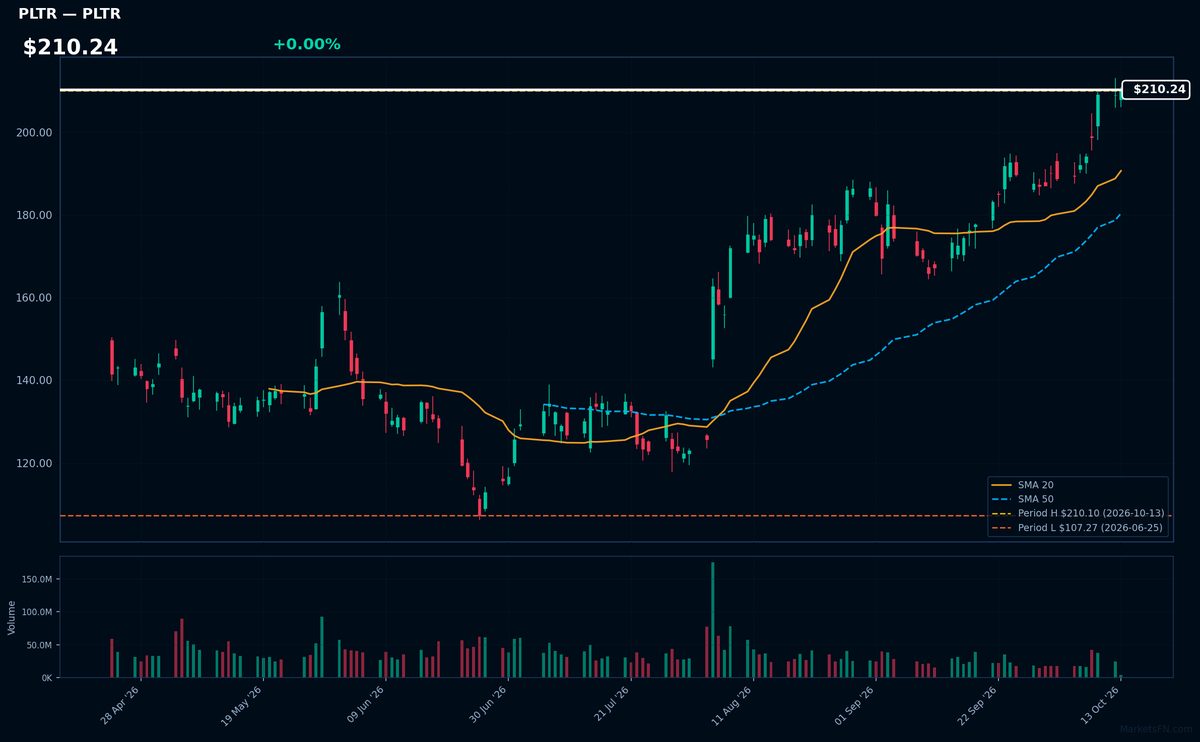
PLTR | Palantir Technologies Inc | Technology | Price Last: $210.10 | % Realized: +18.56% | RSI: 76.9 | % above MA200: +37.8% | Trend: Above MA20, MA50, MA200
Palantir provides AI-powered data analytics platforms for government and commercial clients, specializing in national security and enterprise decision-making. Investors care due to its unique positioning in classified government contracts and growing commercial adoption of its AI/ML solutions.
Technically bullish with RSI(14) at 76.9 (overbought) and sustained uptrend (price > MA20 > MA50 > MA200). At 0.0% below 52-week high after 18.6% annual gain, momentum is extreme but risks mean reversion.
📉 Nearest to 52-Week Low
Sectors represented: Industrials (2), Basic Materials (1), Consumer Defensive (1), Communication Services (1)
| Ticker | Company | Sector | Price Last | % Realized | 52-Week Low Date | RSI | % above MA200 | Trend |
|---|---|---|---|---|---|---|---|---|
| CPRT | Copart, Inc | Industrials | $26.42 | -40.05% | 2026-10-13 | 33.1 | -20.1% | Below MA20, MA50, MA200 |
| MLM | Martin Marietta Materials, Inc | Basic Materials | $474.64 | -25.68% | 2026-10-13 | 36.5 | -18.7% | Below MA20, MA50, MA200 |
| LII | Lennox International Inc | Industrials | $348.81 | -33.46% | 2026-10-13 | 34.3 | -27.6% | Below MA20, MA50, MA200 |
| HRL | Hormel Foods Corp | Consumer Defensive | $19.17 | -18.60% | 2026-10-13 | 26.7 | -16.7% | Below MA20, MA50, MA200 |
| TKO | TKO Group Holdings Inc | Communication Services | $173.48 | -8.02% | 2026-10-12 | 36.3 | -11.2% | Below MA20, MA50, MA200 |
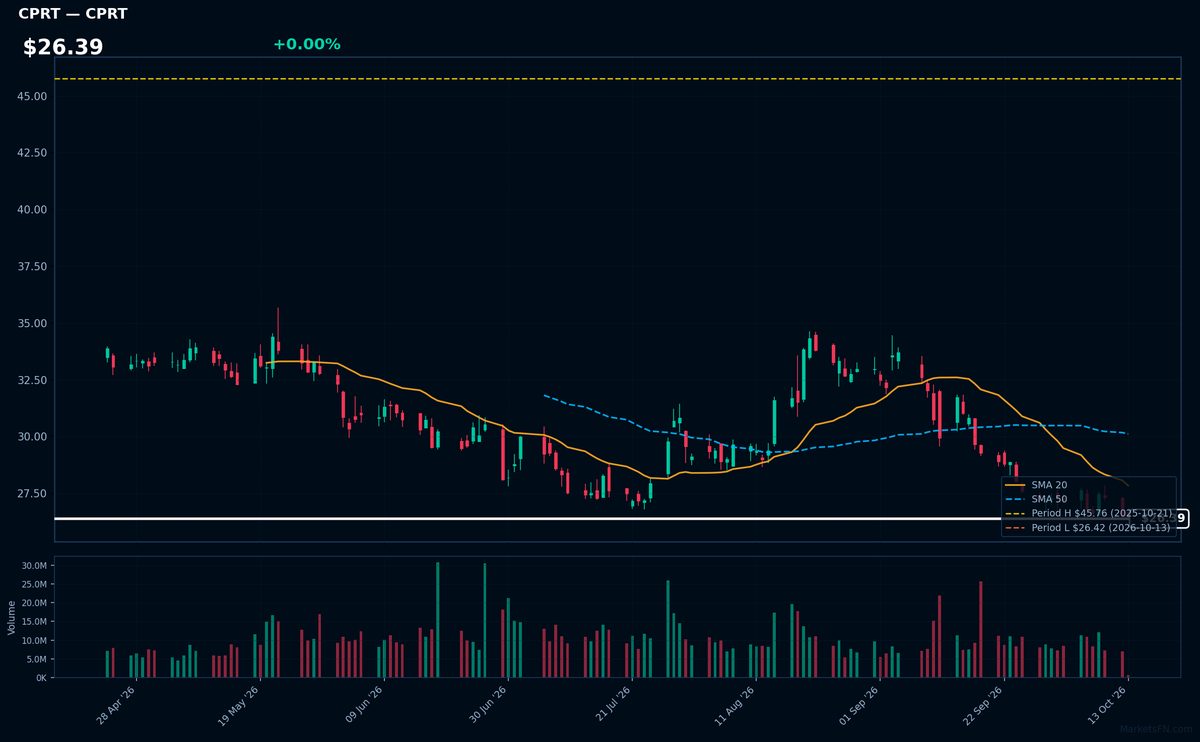
CPRT | Copart, Inc | Industrials | Price Last: $26.42 | % Realized: -40.05% | RSI: 33.1 | % above MA200: -20.1% | Trend: Below MA20, MA50, MA200
Copart operates an online vehicle auction platform, specializing in salvage and used cars for insurers, dealers, and individuals. Investors care because its asset-light model dominates the $10B+ North American salvage market with high margins and recurring insurer relationships.
Technically dire: RSI(14) at 33.1 shows oversold conditions amid a sustained downtrend (price < MA20 < MA50 < MA200). Trading just 0.0% above 52-week lows after a -40.0% plunge, this tests critical support with no bullish reversal signals.
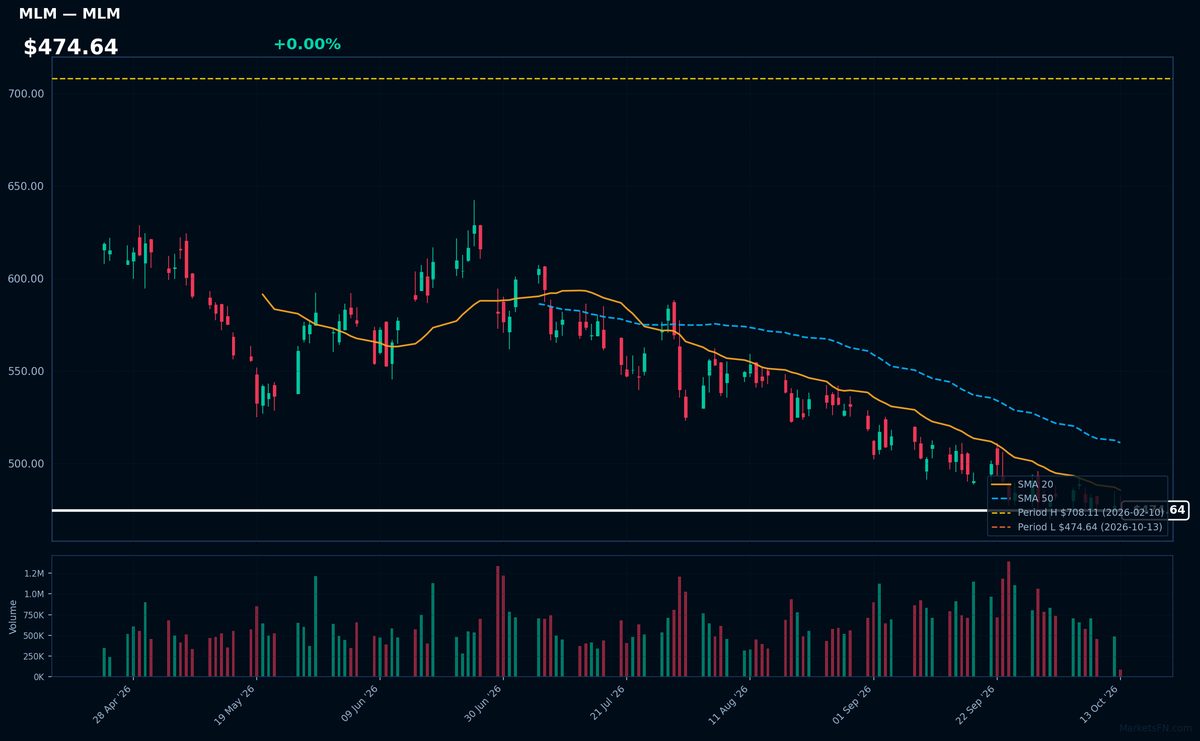
MLM | Martin Marietta Materials, Inc | Basic Materials | Price Last: $474.64 | % Realized: -25.68% | RSI: 36.5 | % above MA200: -18.7% | Trend: Below MA20, MA50, MA200
Martin Marietta Materials supplies construction aggregates (crushed stone, sand, gravel) and heavy building materials for infrastructure and commercial projects. Investors watch MLM as a cyclical play on infrastructure spending and non-residential construction activity, with pricing power in regional markets.
MLM shows severe technical weakness: RSI(14) at 36.5 confirms bearish momentum, with sustained downtrend (price < MA20 < MA50 < MA200). Trading just 0.0% above 52-week lows after a -25.7% annual decline signals critical support testing. Current alignment warns of persistent selling pressure.
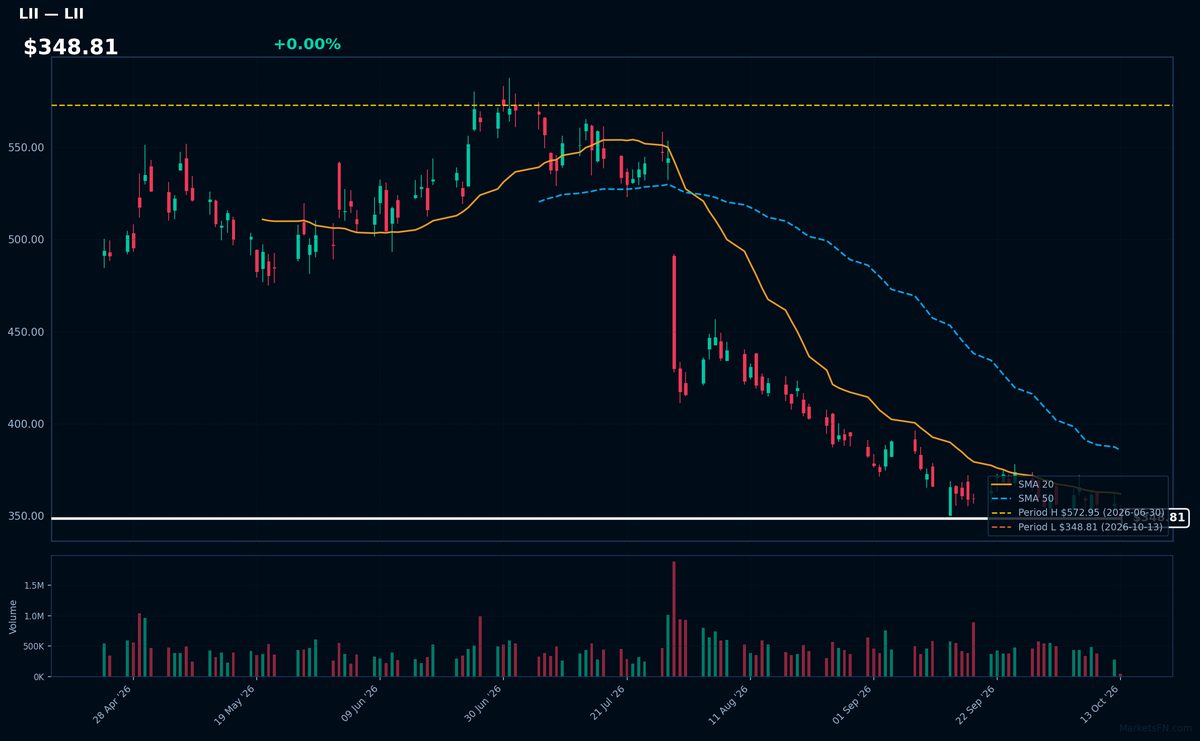
LII | Lennox International Inc | Industrials | Price Last: $348.81 | % Realized: -33.46% | RSI: 34.3 | % above MA200: -27.6% | Trend: Below MA20, MA50, MA200
Lennox International manufactures HVAC systems and components for residential/commercial markets. Investors watch LII as a pure-play on climate control demand, with cyclical exposure to construction activity and replacement cycles in North America.
Severe technical deterioration: RSI(14) at 34.3 shows oversold conditions within a sustained downtrend (price < MA20 < MA50 < MA200). Testing 52-week lows (-33.5% YoY) signals capitulation risk.
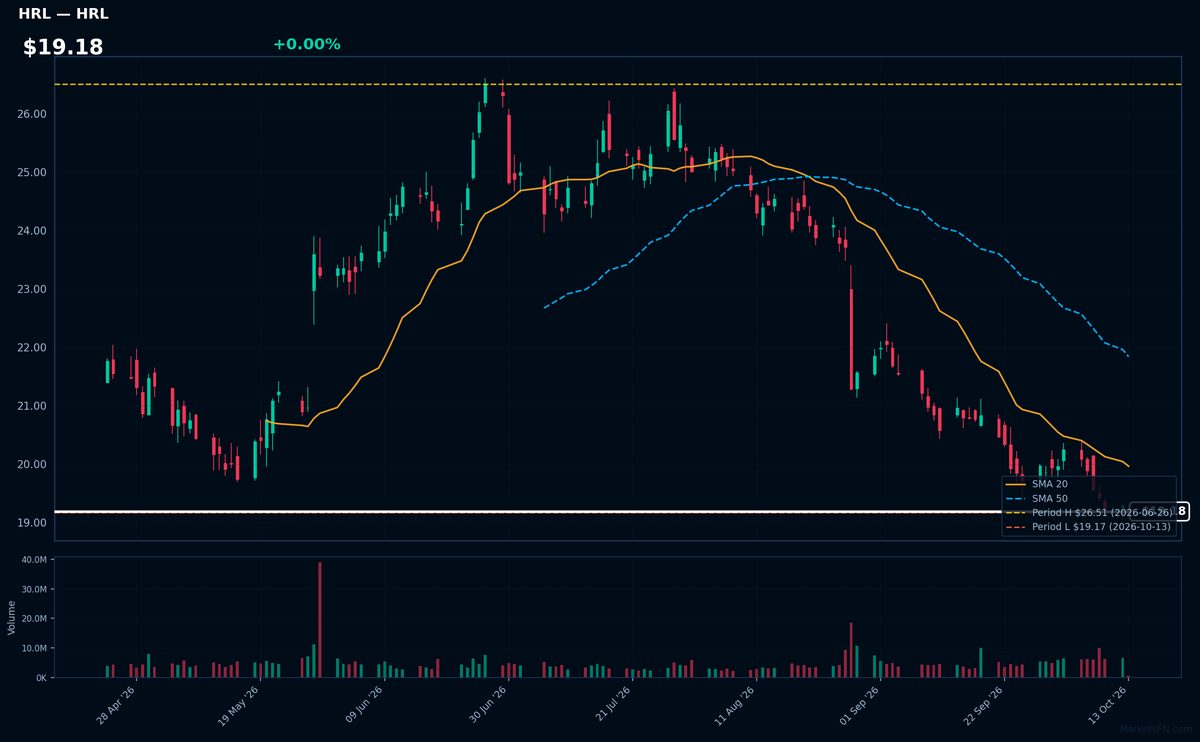
HRL | Hormel Foods Corp | Consumer Defensive | Price Last: $19.17 | % Realized: -18.60% | RSI: 26.7 | % above MA200: -16.7% | Trend: Below MA20, MA50, MA200
Hormel Foods produces branded shelf-stable meats (SPAM, Hormel chili), refrigerated foods (Natural Choice deli meats), and plant-based proteins. Investors watch its pricing power in inflationary environments and its ability to modernize legacy brands.
Technically dire: RSI(14) at 26.7 (oversold) with bearish MA alignment (price < MA20 < MA50 < MA200). Testing 52-week lows after -18.6% annual decline signals severe weakness.
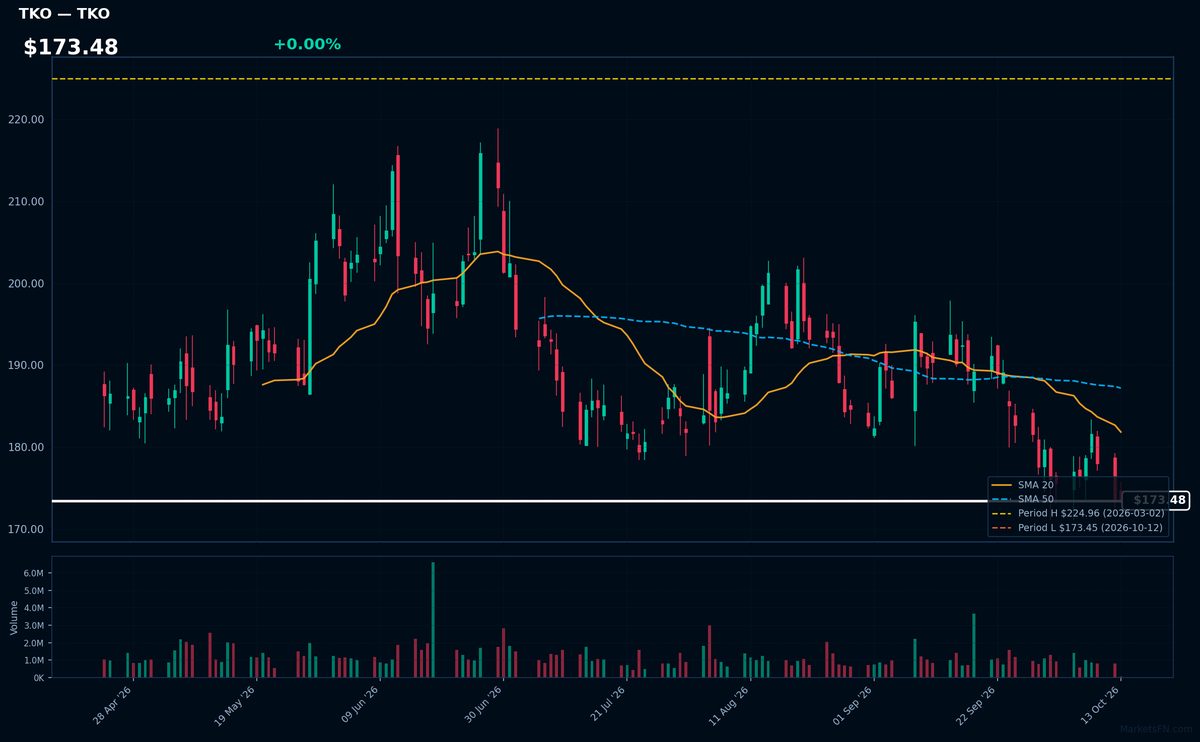
TKO | TKO Group Holdings Inc | Communication Services | Price Last: $173.48 | % Realized: -8.02% | RSI: 36.3 | % above MA200: -11.2% | Trend: Below MA20, MA50, MA200
TKO Group Holdings Inc operates WWE and UFC, dominating live sports entertainment with pay-per-view events, media rights, and merchandising. Investors care for its monopolistic position in combat sports and lucrative long-term media contracts.
Technically concerning: RSI(14) at 36.3 shows near-oversold conditions, but bearish MA alignment (price < MA20 < MA50 < MA200) confirms sustained downtrend. At 0.0% above 52-week low, testing critical support after -8.0% annual decline.
Market Commentary
The concentration of blue-chip stocks like Microsoft (MSFT), Apple (AAPL), and Visa (V) at 52-week highs signals sustained investor confidence in mega-cap technology and payments giants, likely driven by resilient earnings and AI-related optimism. Conversely, names like Copart (CPRT) and Hormel Foods (HRL) hovering near 52-week lows reflect sector-specific pressures—auto insurance headwinds and consumer staples margin compression, respectively—amid a narrow market rally favoring growth over defensive sectors.
Sector rotation remains stark, with energy (Exxon Mobil, XOM) and tech (Palantir, PLTR) benefiting from cyclical strength and AI adoption, while materials (Martin Marietta, MLM) and industrials (Lennox, LII) lag due to higher input costs and housing slowdowns. The divergence underscores a macro environment where inflation-sensitive sectors struggle, while cash-rich tech and energy firms capitalize on pricing power and efficiency gains.
Key levels to monitor include the 52-week highs for MSFT and AAPL, as breaks above could signal extended momentum, while rebounds off lows for TKO Group (TKO) may hinge on combat sports demand. Near-term catalysts include earnings revisions for consumer-facing names like HRL and industrial demand signals for LII. Strict adherence to these technical extremes is critical given tight trading ranges.
Methodology: All 503 S&P 500 constituents screened. 52-week high = highest daily close over the past 252 trading days (approx. 1 year). 52-week low = lowest daily close over the same period. Distance = (current price / extreme − 1) × 100. Technical indicators computed on up to 1 year of daily OHLCV data.
Disclaimer: For informational purposes only. Not investment advice. Past performance is not indicative of future results.