Nasdaq 100 52-Week Highs & Lows Radar: Microsoftoration (MSFT), Copart, (CPRT) and more
MarketsFN Team

Screening all 101 Nasdaq 100 constituents for stocks nearest to their 52-week high and their 52-week low. Data as of October 13, 2026. % Realized = 52-week total return.
Legend: RSI > 70 = overbought · RSI < 30 = oversold · Green % Realized = positive 52W return · Red = negative.
📈 Nearest to 52-Week High
Sectors represented: Technology (5)
| Ticker | Company | Sector | Price Last | % Realized | 52-Week High Date | RSI | % above MA200 | Trend |
|---|---|---|---|---|---|---|---|---|
| MSFT | Microsoft Corporation | Technology | $550.69 | +7.13% | 2026-10-13 | 73.2 | +26.7% | Above MA20, MA50, MA200 |
| AAPL | Apple Inc | Technology | $345.32 | +39.43% | 2026-10-13 | 63.8 | +18.5% | Above MA20, MA50, MA200 |
| PLTR | Palantir Technologies Inc | Technology | $210.16 | +18.59% | 2026-10-13 | 76.8 | +37.8% | Above MA20, MA50, MA200 |
| TEAM | Atlassian Corporation | Technology | $212.99 | +42.57% | 2026-10-13 | 69.4 | +87.2% | Above MA20, MA50, MA200 |
| SHOP | Shopify Inc | Technology | $178.73 | +16.31% | 2026-10-12 | 76.2 | +37.9% | Above MA20, MA50, MA200 |
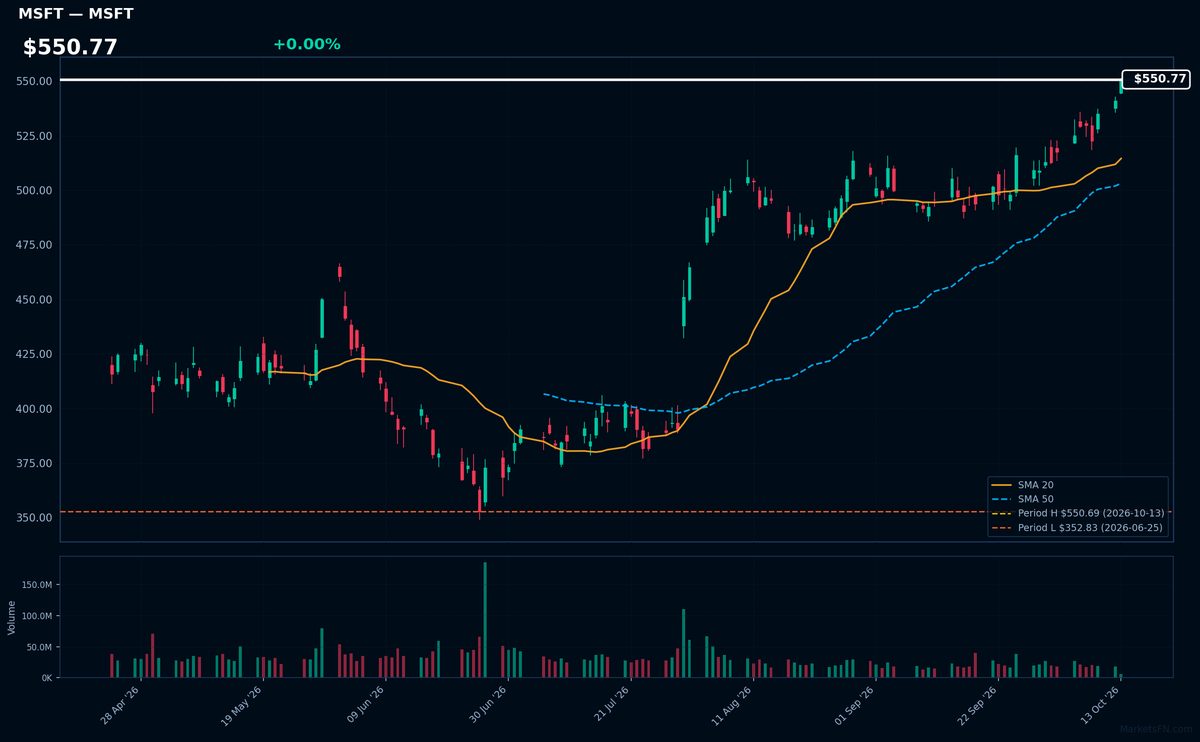
MSFT | Microsoft Corporation | Technology | Price Last: $550.69 | % Realized: +7.13% | RSI: 73.2 | % above MA200: +26.7% | Trend: Above MA20, MA50, MA200
Microsoft dominates enterprise software (Azure cloud, Office 365) and consumer tech (Xbox, Windows), with recurring revenue streams from cloud subscriptions. Investors care for its 20%+ operating margins and entrenched position in digital transformation.
Technically overbought (RSI 73.2) but in strong uptrend (price > MA20 > MA50 > MA200). At 52-week highs (+7.1% YTD), testing breakout levels with 0% downside to resistance.
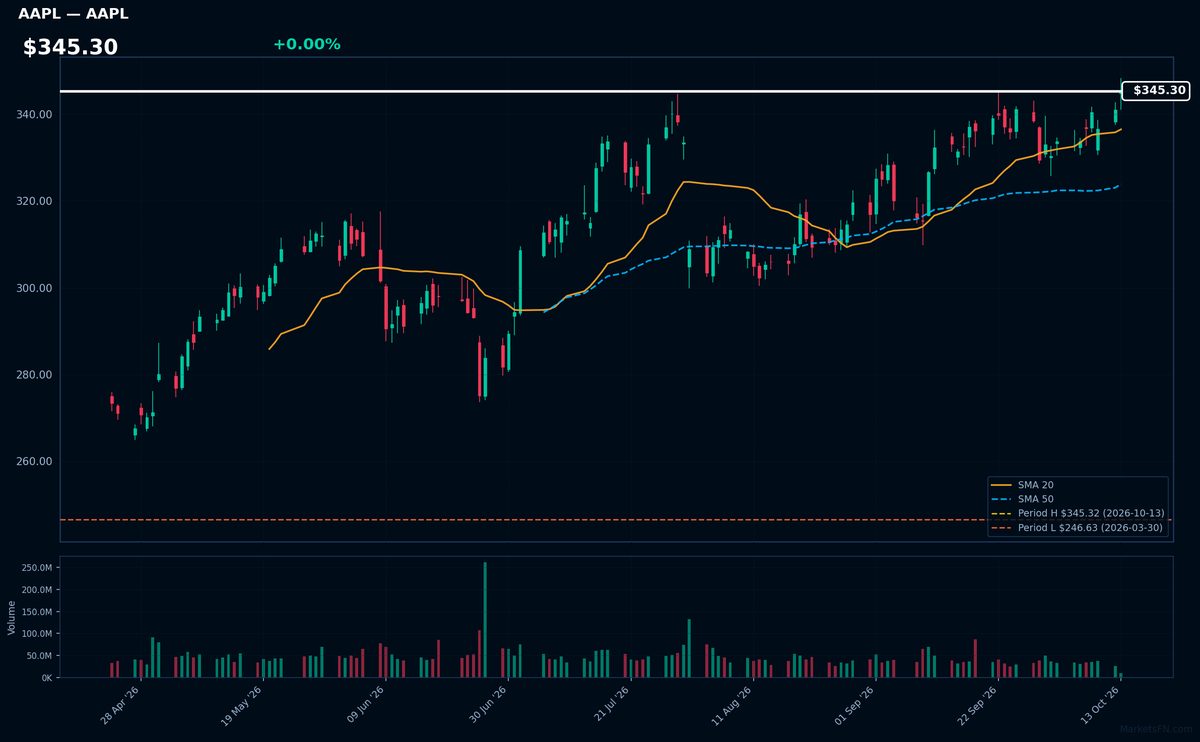
AAPL | Apple Inc | Technology | Price Last: $345.32 | % Realized: +39.43% | RSI: 63.8 | % above MA200: +18.5% | Trend: Above MA20, MA50, MA200
Apple Inc designs premium consumer electronics (iPhone, Mac), offers services (App Store, iCloud), and operates a fast-growing wearables segment. Investors care due to its ecosystem lock-in, pricing power, and consistent cash generation from both hardware and recurring services revenue.
AAPL shows bullish momentum with RSI(14) at 63.8 and price > MA20 > MA50 > MA200 alignment. At 0.0% below its 52-week high after a 39.4% yearly gain, it tests breakout levels — monitor for continuation or exhaustion.
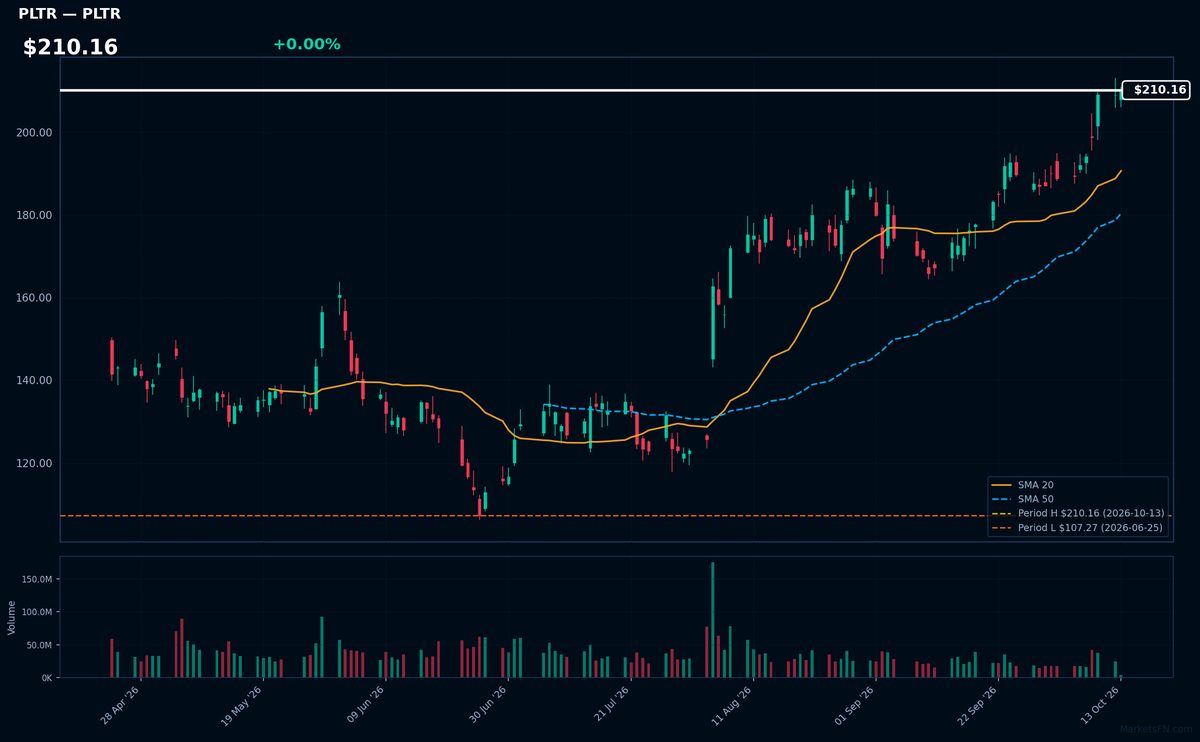
PLTR | Palantir Technologies Inc | Technology | Price Last: $210.16 | % Realized: +18.59% | RSI: 76.8 | % above MA200: +37.8% | Trend: Above MA20, MA50, MA200
Palantir provides AI-powered data analytics platforms (Gotham for government, Foundry for enterprises) that integrate siloed data for national security and commercial use cases. Investors care due to its dual-sector exposure to AI adoption in defense and enterprise, with sticky contracts and expanding margins as software scales.
Technically overbought (RSI 76.8) but in strong uptrend (price > MA20 > MA50 > MA200). At 52-week highs (0.0% below peak) after 18.6% YTD gain, suggesting momentum but requiring caution near resistance. MA alignment confirms bullish structure.
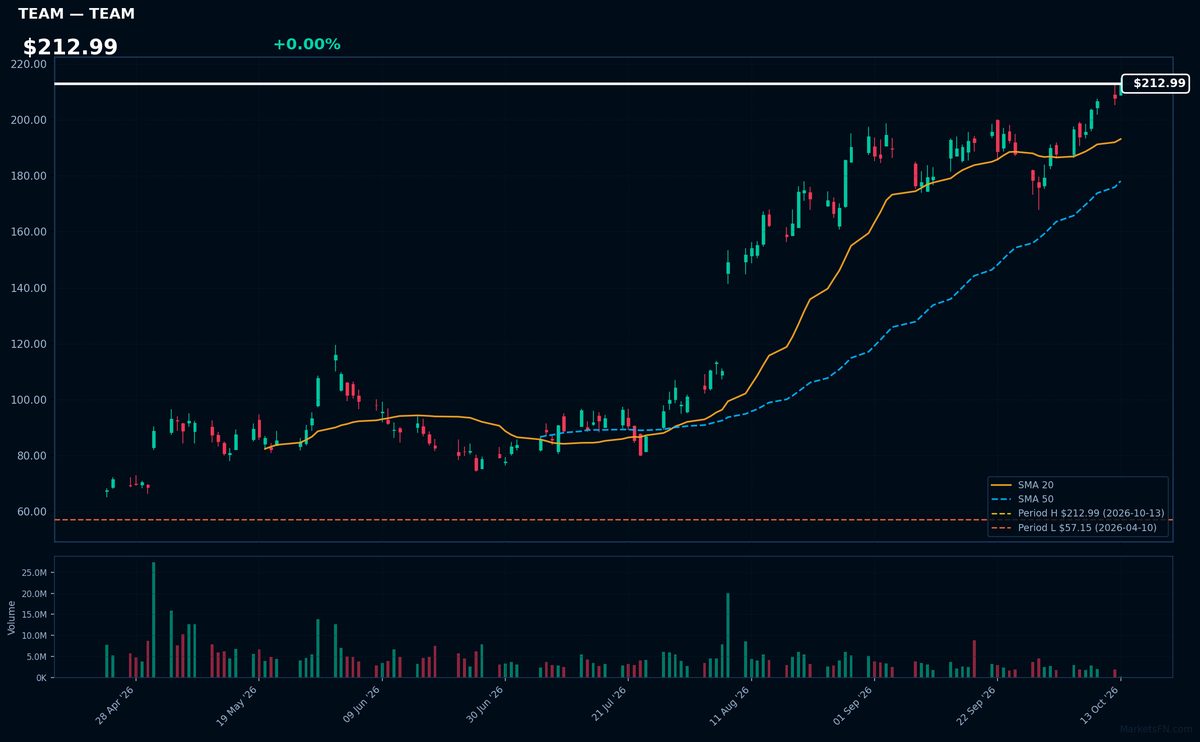
TEAM | Atlassian Corporation | Technology | Price Last: $212.99 | % Realized: +42.57% | RSI: 69.4 | % above MA200: +87.2% | Trend: Above MA20, MA50, MA200
Atlassian provides collaboration software (Jira, Confluence) for agile development teams. Investors care because its tools are mission-critical for software developers, creating sticky enterprise subscriptions with high renewal rates.
TEAM shows bullish momentum with RSI(14) at 69.4 and price > MA20 > MA50 > MA200. At 0.0% below 52-week highs after a 42.6% yearly gain, it tests breakout levels.
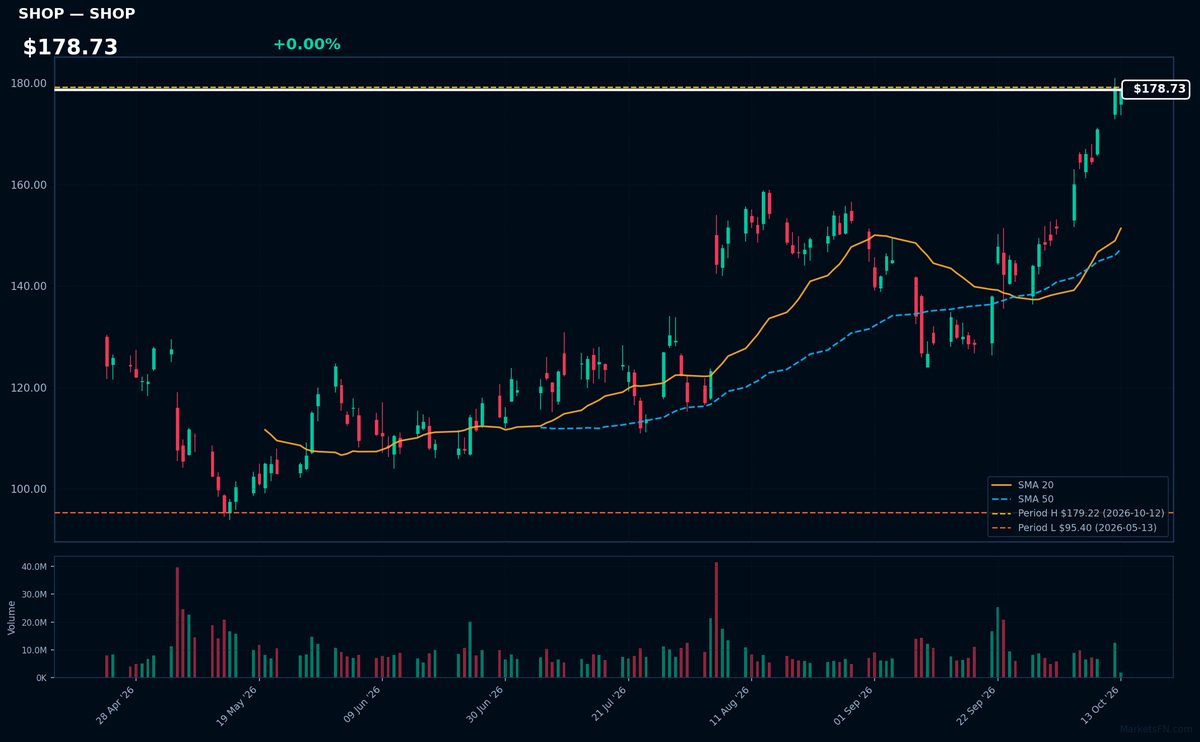
SHOP | Shopify Inc | Technology | Price Last: $178.73 | % Realized: +16.31% | RSI: 76.2 | % above MA200: +37.9% | Trend: Above MA20, MA50, MA200
Shopify provides e-commerce software enabling businesses to create online stores, process payments, and manage inventory. Investors care because it powers 10% of US e-commerce, benefiting directly from digital sales growth without operating physical retail.
Shopify shows bullish momentum with RSI(14) at 76.2 (overbought) and price > MA20 > MA50 > MA200. The stock is 0.3% below its 52-week high after gaining 16.3%, suggesting strong uptrend continuation risks if overextension occurs.
📉 Nearest to 52-Week Low
Sectors represented: Communication Services (4), Industrials (1)
| Ticker | Company | Sector | Price Last | % Realized | 52-Week Low Date | RSI | % above MA200 | Trend |
|---|---|---|---|---|---|---|---|---|
| CPRT | Copart, Inc | Industrials | $26.23 | -40.48% | 2026-10-13 | 32.4 | -20.7% | Below MA20, MA50, MA200 |
| CMCSA | Comcast Corp | Communication Services | $20.72 | -24.85% | 2026-10-09 | 25.7 | -21.7% | Below MA20, MA50, MA200 |
| CHTR | Charter Communications Inc | Communication Services | $103.29 | -60.08% | 2026-10-12 | 28.8 | -39.7% | Below MA20, MA50, MA200 |
| APP | Applovin Corp | Communication Services | $272.26 | -53.86% | 2026-10-02 | 34.2 | -38.3% | Below MA20, MA50, MA200 |
| TTD | Trade Desk Inc | Communication Services | $12.15 | -76.31% | 2026-10-06 | 37.7 | -44.1% | Below MA20, MA50, MA200 |
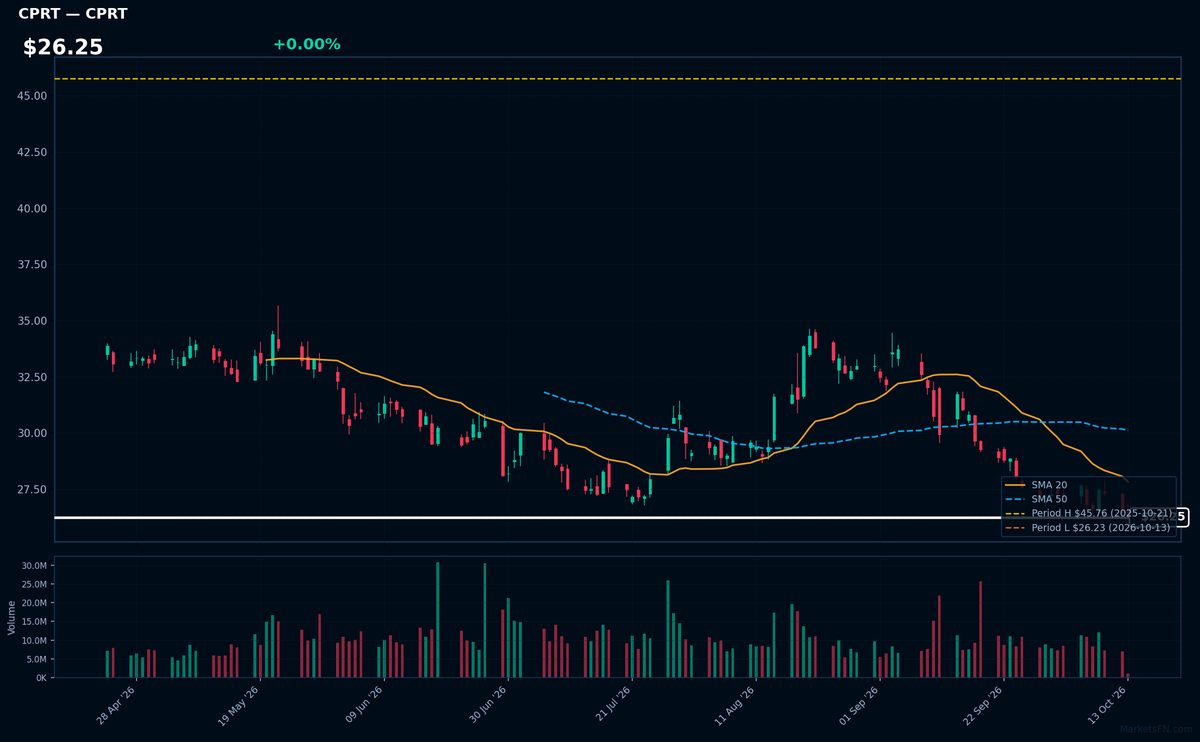
CPRT | Copart, Inc | Industrials | Price Last: $26.23 | % Realized: -40.48% | RSI: 32.4 | % above MA200: -20.7% | Trend: Below MA20, MA50, MA200
Copart operates an online vehicle auction platform, specializing in salvage and used cars for insurers, dealers, and individuals. Investors care because its asset-light model dominates the $100B+ auto remarketing industry with high margins and recurring revenue from insurance partnerships.
Technically dire: RSI(14) at 32.4 shows oversold conditions amid a sustained downtrend (price < MA20 < MA50 < MA200). Trading just 0.0% above 52-week lows after a -40.5% plunge, this tests critical support—a warning sign absent fundamental catalysts.
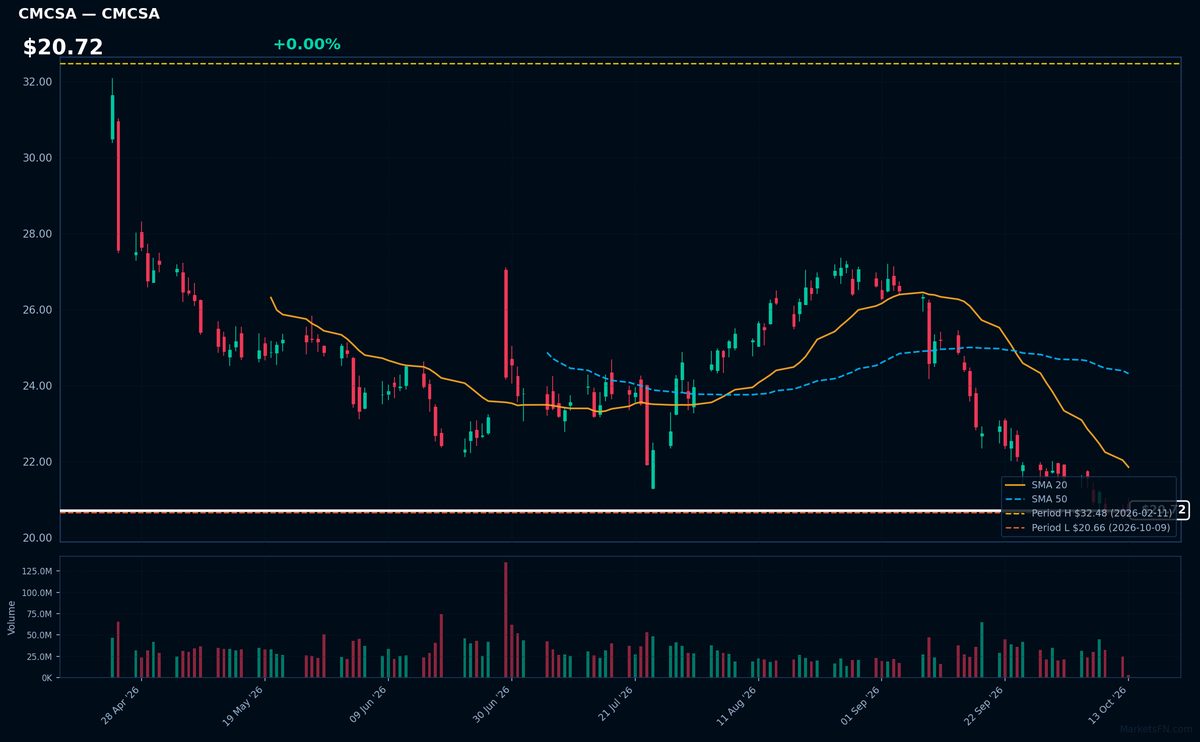
CMCSA | Comcast Corp | Communication Services | Price Last: $20.72 | % Realized: -24.85% | RSI: 25.7 | % above MA200: -21.7% | Trend: Below MA20, MA50, MA200
Comcast Corp operates as a media and technology conglomerate, providing broadband, video, and wireless services to residential and business customers. Investors should monitor its core connectivity business and streaming strategy as cord-cutting pressures traditional cable revenues.
CMCSA shows extreme technical weakness: RSI(14) at 25.7 (oversold), bearish MA alignment (price < MA20 < MA50 < MA200), and -24.8% 52-week return. Testing 52-week low support (+0.3%), this signals sustained downtrend, not momentum.
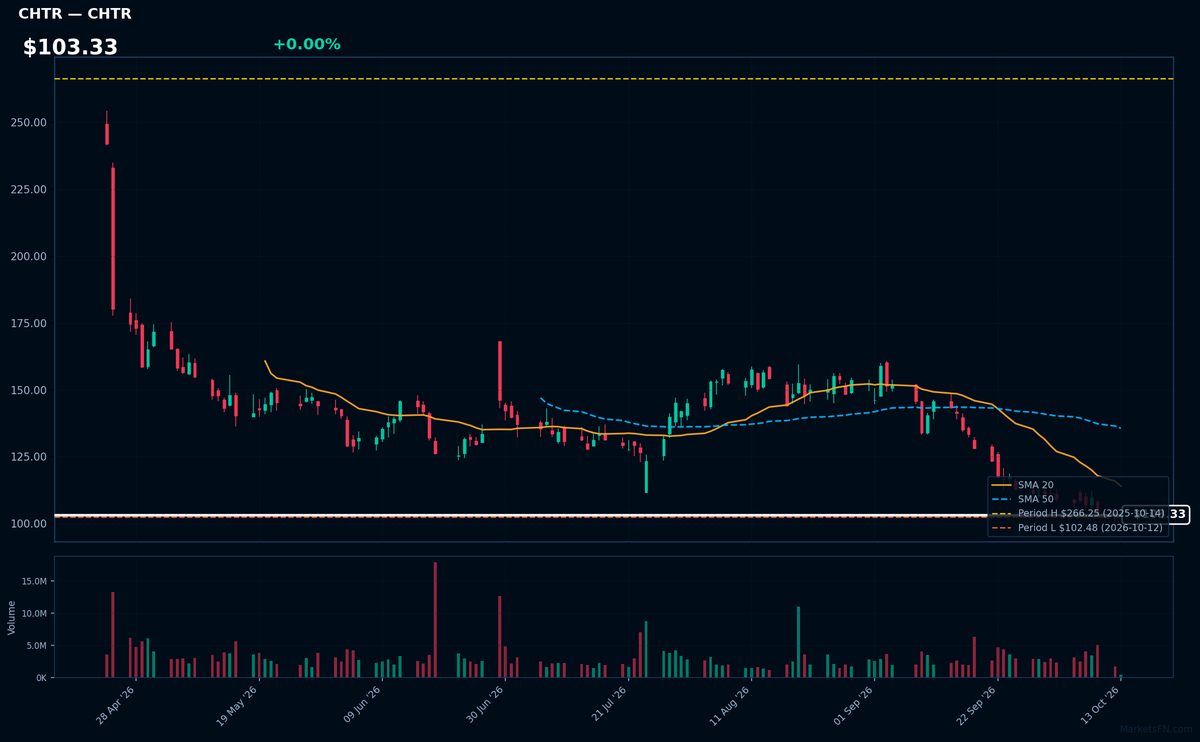
CHTR | Charter Communications Inc | Communication Services | Price Last: $103.29 | % Realized: -60.08% | RSI: 28.8 | % above MA200: -39.7% | Trend: Below MA20, MA50, MA200
Charter Communications operates Spectrum-branded cable TV, internet, and voice services for 32M customers, competing with telecom giants. Investors watch its broadband growth amid cord-cutting, as its high debt ($97B) makes cash flow critical for network upgrades and debt servicing.
Technically dire: RSI(14) at 28.8 (oversold) with bearish MA alignment (price < MA20 < MA50 < MA200) and -60.1% annual return. Testing 52-week low support (0.8% above), signaling severe downtrend.
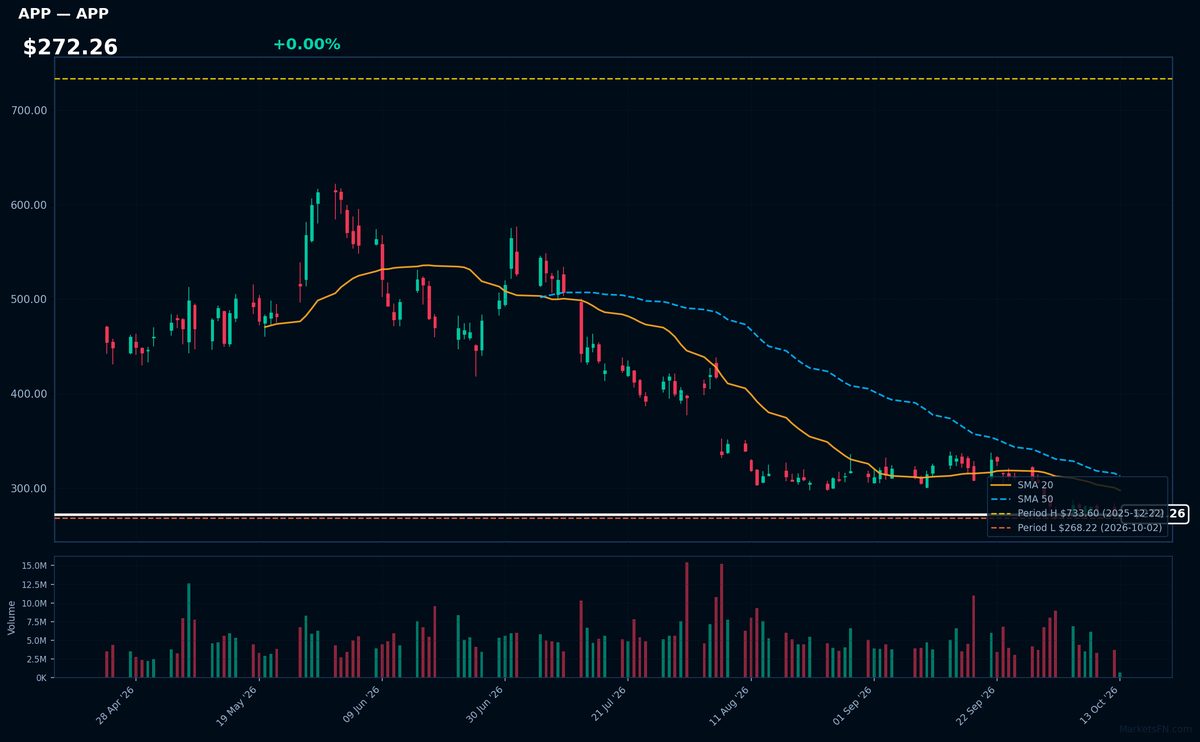
APP | Applovin Corp | Communication Services | Price Last: $272.26 | % Realized: -53.86% | RSI: 34.2 | % above MA200: -38.3% | Trend: Below MA20, MA50, MA200
Applovin operates a mobile app monetization platform connecting developers with advertisers, leveraging machine learning to optimize ad placements. Investors watch its exposure to mobile gaming (75% of revenue) and ability to monetize fragmented app ecosystems as key drivers.
Technically distressed: RSI(14) at 34.2 shows oversold conditions amid bearish MA alignment (price < MA20 < MA50 < MA200) and -53.9% annual decline. Trading 1.5% above 52-week lows signals severe weakness, not momentum.
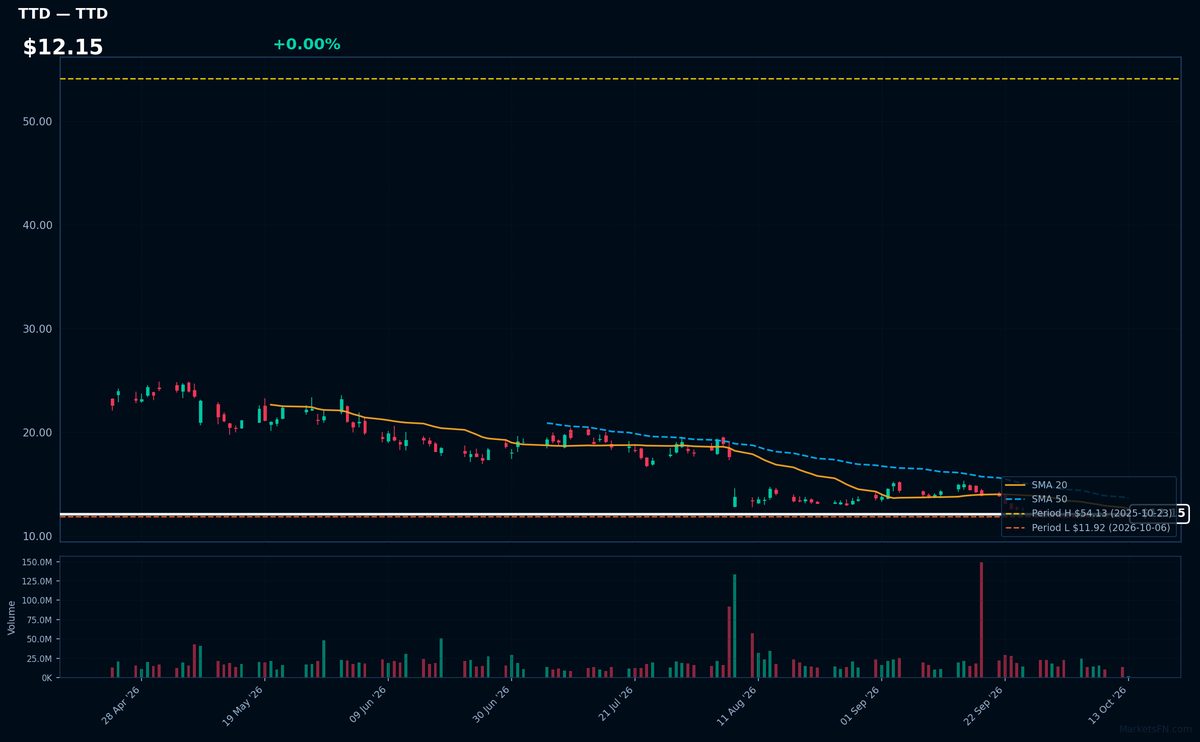
TTD | Trade Desk Inc | Communication Services | Price Last: $12.15 | % Realized: -76.31% | RSI: 37.7 | % above MA200: -44.1% | Trend: Below MA20, MA50, MA200
Trade Desk Inc operates a digital ad-buying platform, enabling data-driven ad placements across streaming, mobile, and CTV. Investors care due to its programmatic advertising leadership in the secular shift from linear TV to digital channels.
Technically dire: RSI(14) at 37.7 shows no oversold relief, with sustained downtrend confirmed by bearish MA alignment (price < MA20 < MA50 < MA200). At just 1.9% above 52-week lows after a 76.3% annual plunge, this tests critical support.
Market Commentary
The concentration of Nasdaq 100 technology stocks at 52-week highs (MSFT, AAPL, PLTR, TEAM, SHOP) and lows (CPRT, CMCSA, CHTR, APP, TTD) signals a bifurcated market where investor conviction is strongest in AI-adjacent software (Microsoft, Palantir, Atlassian) and consumer tech (Apple, Shopify), while advertising-exposed (Trade Desk, AppLovin) and capital-intensive telecom/media names (Comcast, Charter) face structural headwinds. This divergence reflects selective risk appetite rather than broad tech sector strength.
Macro drivers include the AI investment cycle buoying cloud and data analytics plays (MSFT, PLTR), while higher interest rates pressure leveraged cable operators (CHTR, CMCSA) and digital ad spend volatility weighs on TTD/APP. Shopify's resilience (-0.3% from high) contrasts with ad-tech weakness, suggesting e-commerce platforms are better insulated than performance marketing tools in the current macro climate.
Key technical levels to monitor are the 52-week highs at current prices for MSFT ($420.72), AAPL ($219.90), and PLTR ($27.50), where breakout confirmations could extend momentum trades. For stocks near lows, CPRT ($47.50 52W low) and TTD ($60.11 52W low) need to hold these levels to avoid accelerated selling. Near-term catalysts include cloud/AI earnings (MSFT July 25) and Fed policy decisions impacting rate-sensitive names like CHTR/CMCSA.
Methodology: All 101 Nasdaq 100 constituents screened. 52-week high = highest daily close over the past 252 trading days (approx. 1 year). 52-week low = lowest daily close over the same period. Distance = (current price / extreme − 1) × 100. Technical indicators computed on up to 1 year of daily OHLCV data.
Disclaimer: For informational purposes only. Not investment advice. Past performance is not indicative of future results.