S&P 500 2026 YTD Highs & Lows Radar: Apple (AAPL), Netflix (NFLX) and more
MarketsFN Team

Screening all 503 S&P 500 constituents for stocks nearest to their 2026 year-to-date high and their 2026 YTD low. Data as of October 22, 2026. % Realized = total return since Jan 1 2026.
Legend: RSI > 70 = overbought · RSI < 30 = oversold · Green % Realized = positive YTD return · Red = negative.
📈 Nearest to 2026 High
Sectors represented: Technology (2), Financial (2), Energy (1)
| Ticker | Company | Sector | Price Last | % Realized | 2026 YTD High Date | RSI | % above MA200 | Trend |
|---|---|---|---|---|---|---|---|---|
| AAPL | Apple Inc | Technology | $343.99 | +26.93% | 2026-10-21 | 61.9 | +17.0% | Above MA20, MA50, MA200 |
| V | Visa Inc | Financial | $407.85 | +17.71% | 2026-10-21 | 77.4 | +19.9% | Above MA20, MA50, MA200 |
| MA | Mastercard Incorporated | Financial | $622.62 | +10.56% | 2026-10-21 | 77.7 | +16.6% | Above MA20, MA50, MA200 |
| CVX | Chevron Corp | Energy | $226.78 | +45.47% | 2026-10-21 | 73.1 | +18.6% | Above MA20, MA50, MA200 |
| NOW | ServiceNow Inc | Technology | $153.12 | +3.85% | 2026-10-21 | 67.6 | +33.1% | Above MA20, MA50, MA200 |
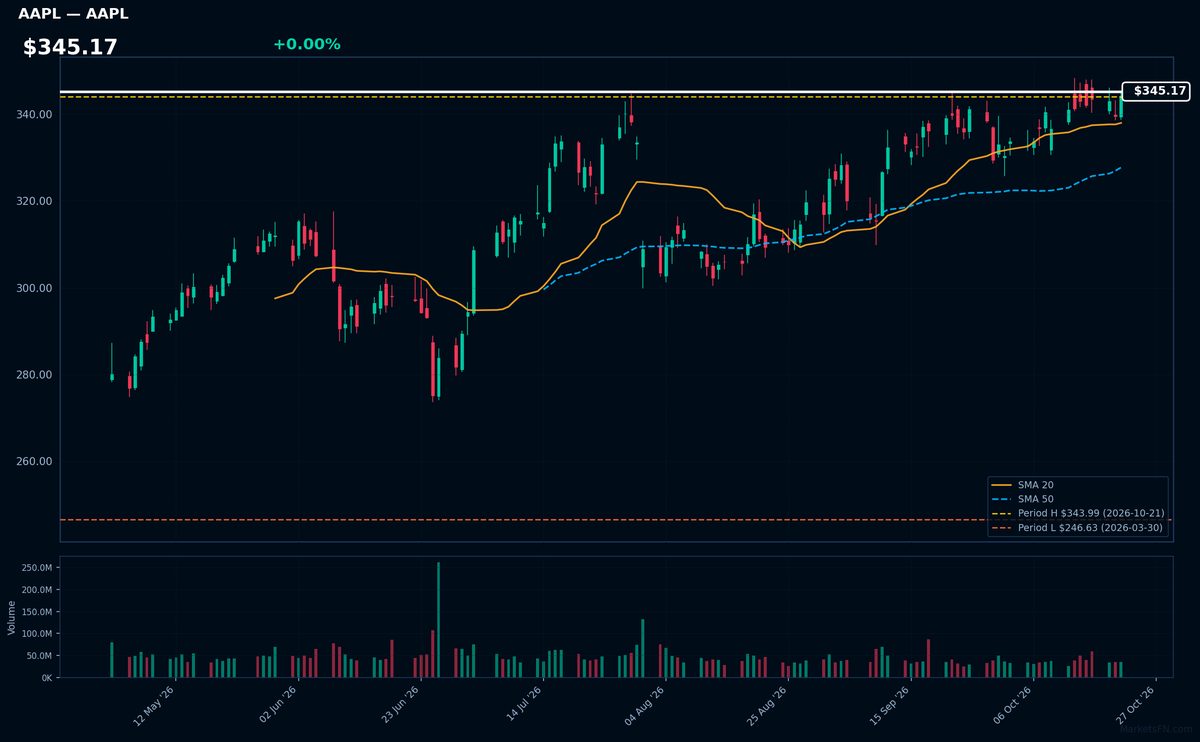
AAPL | Apple Inc | Technology | Price Last: $343.99 | % Realized: +26.93% | RSI: 61.9 | % above MA200: +17.0% | Trend: Above MA20, MA50, MA200
Apple Inc designs premium consumer electronics (iPhone, Mac, iPad) and operates high-margin services (App Store, iCloud). Investors care due to its pricing power, ecosystem lock-in, and $26.9% YTD return — outperforming most tech peers.
Technically bullish: $345.17 price > MA20 > MA50 > MA200 confirms uptrend. RSI(14) at 61.9 shows momentum but no overbought signal yet. Stock tests YTD highs — breakout potential.
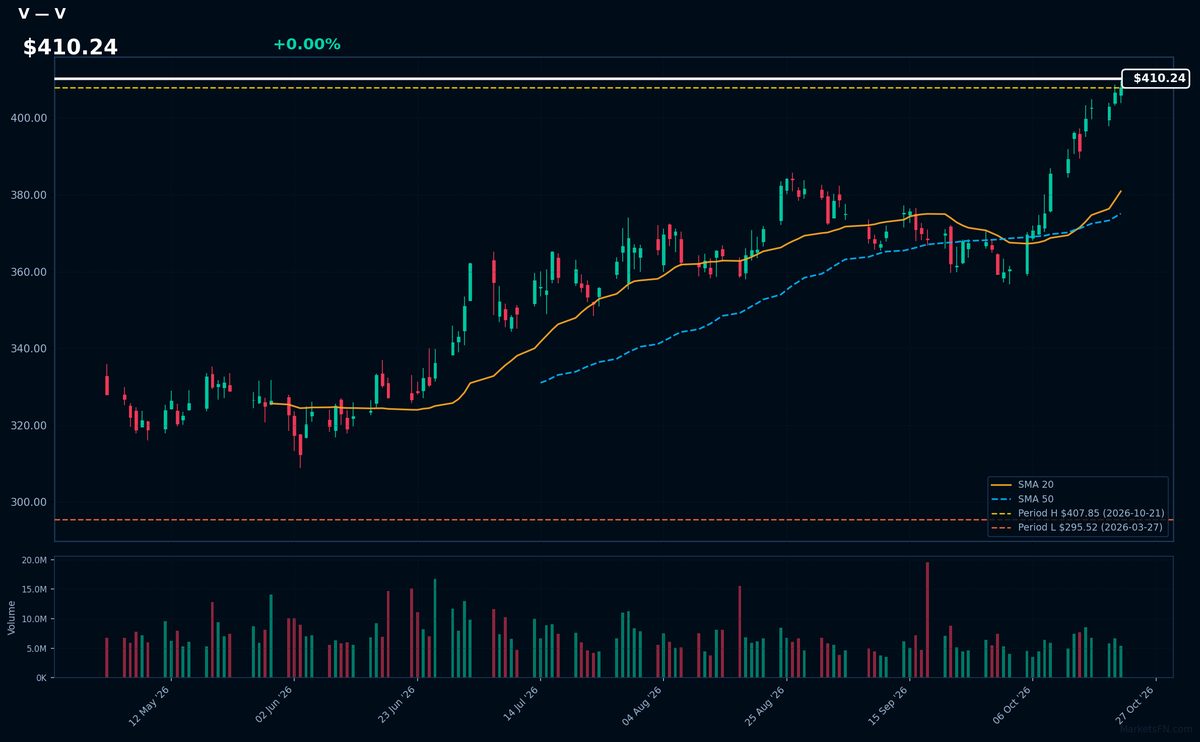
V | Visa Inc | Financial | Price Last: $407.85 | % Realized: +17.71% | RSI: 77.4 | % above MA200: +19.9% | Trend: Above MA20, MA50, MA200
Visa operates the world's largest electronic payments network, processing over $14 trillion annually. Investors care because its asset-light model (no credit risk) generates 60%+ operating margins as global cashless adoption grows, making it a pure-play on the secular shift from physical currency.
Technically overbought (RSI 77.4) but in strong uptrend (price > MA20 > MA50 > MA200). The 17.7% YTD gain suggests momentum, though extreme proximity to YTD highs (0.0% below) warrants caution despite bullish MA alignment.
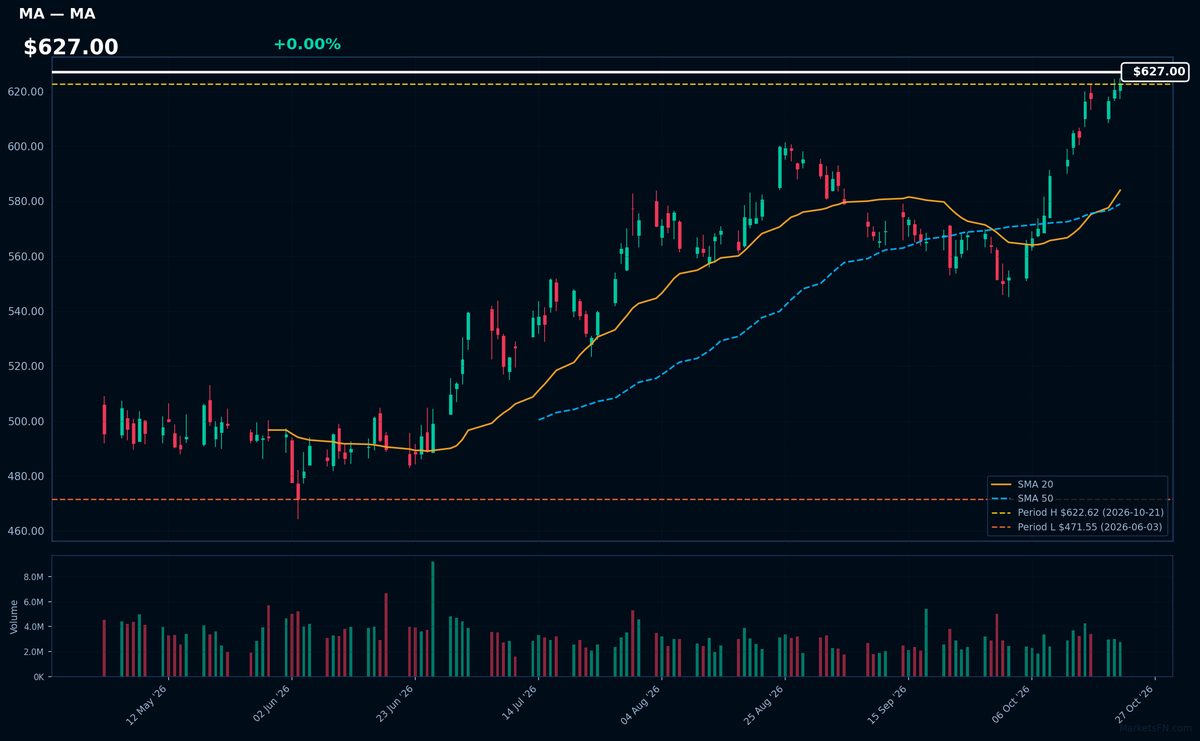
MA | Mastercard Incorporated | Financial | Price Last: $622.62 | % Realized: +10.56% | RSI: 77.7 | % above MA200: +16.6% | Trend: Above MA20, MA50, MA200
Mastercard operates a global payment network processing transactions between merchants, banks, and consumers. Investors care because its asset-light model scales with digital payment growth, generating high-margin revenue from transaction fees without direct lending risk.
Technically bullish with RSI(14) at 77.7 (overbought) and price > MA20 > MA50 > MA200 alignment. The 10.6% YTD gain tests 2026 highs, suggesting momentum but warranting caution near extremes.
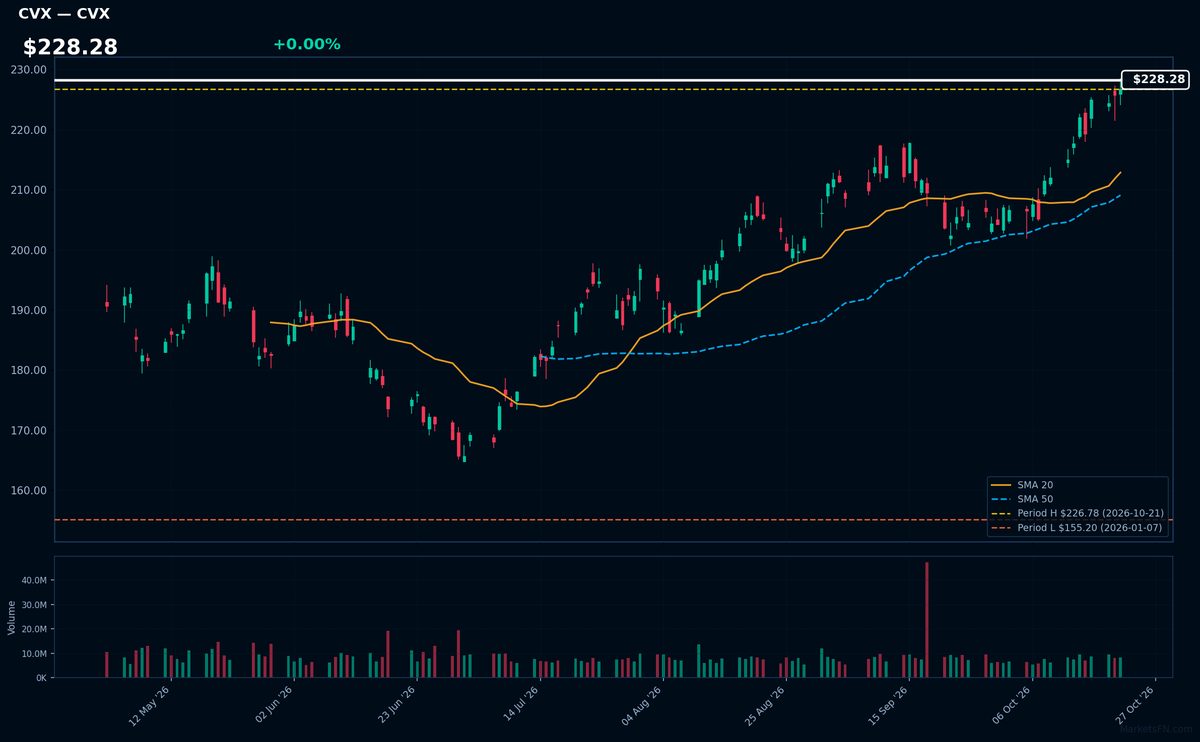
CVX | Chevron Corp | Energy | Price Last: $226.78 | % Realized: +45.47% | RSI: 73.1 | % above MA200: +18.6% | Trend: Above MA20, MA50, MA200
Chevron Corp explores, produces, and refines oil/gas globally. Investors care because it's a top-5 integrated energy major with scale advantages in volatile commodity markets, generating substantial cash flows even at moderate oil prices.
CVX shows strong bullish momentum with RSI(14) at 73.1 and price > MA20 > MA50 > MA200. The 45.5% YTD gain pushes it to 0.0% below its 2026 high — extended but potentially breakout-ready. Watch RSI for overbought risk.
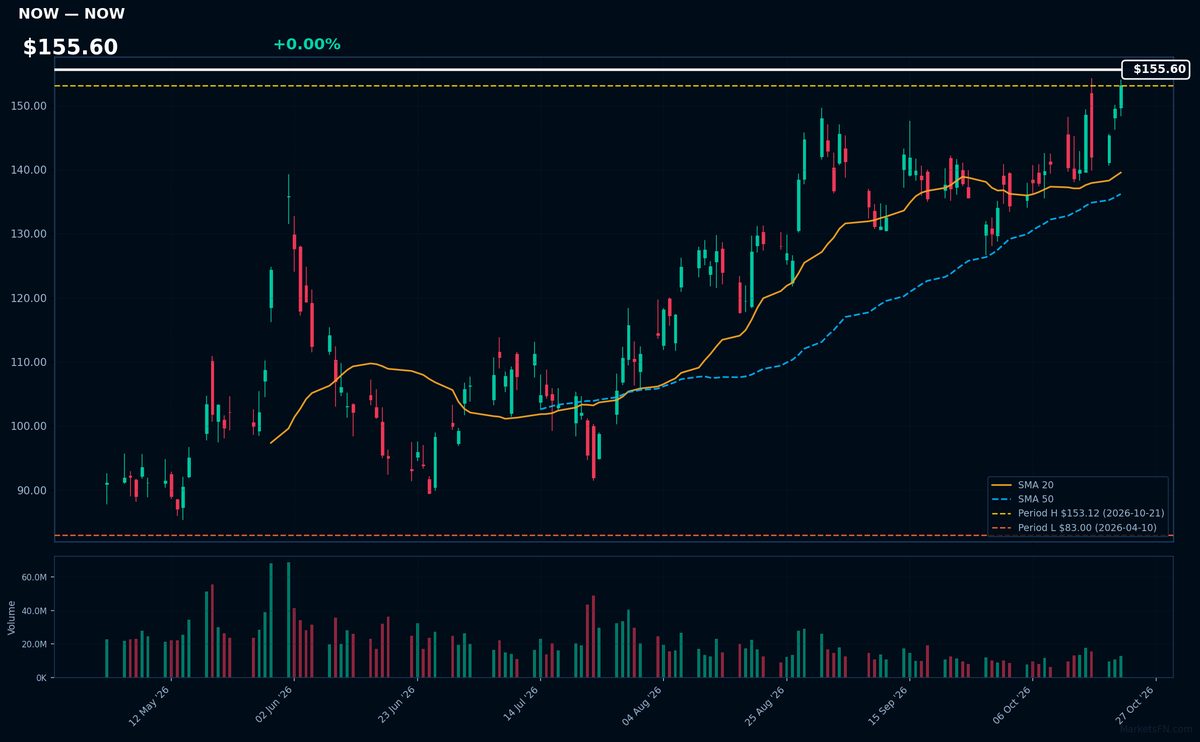
NOW | ServiceNow Inc | Technology | Price Last: $153.12 | % Realized: +3.85% | RSI: 67.6 | % above MA200: +33.1% | Trend: Above MA20, MA50, MA200
ServiceNow Inc provides cloud-based workflow automation software that helps enterprises digitize and streamline IT, HR, customer service and security operations. Investors care because its sticky platform drives recurring revenue as companies modernize outdated manual processes.
Technically bullish with RSI(14) at 67.6 and price > MA20 > MA50 > MA200. The 3.8% YTD gain shows sustained momentum, though RSI nears overbought territory. Stock tests 2026 highs (0.0% below) — watch for breakout confirmation.
📉 Nearest to 2026 Low
Sectors represented: Communication Services (2), Basic Materials (2), Consumer Cyclical (1)
| Ticker | Company | Sector | Price Last | % Realized | 2026 YTD Low Date | RSI | % above MA200 | Trend |
|---|---|---|---|---|---|---|---|---|
| NFLX | Netflix Inc | Communication Services | $65.04 | -28.52% | 2026-10-21 | 37.0 | -21.1% | Below MA20, MA50, MA200 |
| CMG | Chipotle Mexican Grill | Consumer Cyclical | $28.12 | -24.99% | 2026-10-21 | 29.3 | -18.2% | Below MA20, MA50, MA200 |
| PSKY | Paramount Skydance Corp | Communication Services | $6.91 | -13.08% | 2026-10-16 | 34.7 | — | — |
| MOS | Mosaic Company | Basic Materials | $17.68 | -29.34% | 2026-10-21 | 20.7 | -26.7% | Below MA20, MA50, MA200 |
| ALB | Albemarle Corp | Basic Materials | $94.47 | -34.36% | 2026-10-21 | 24.4 | -37.9% | Below MA20, MA50, MA200 |
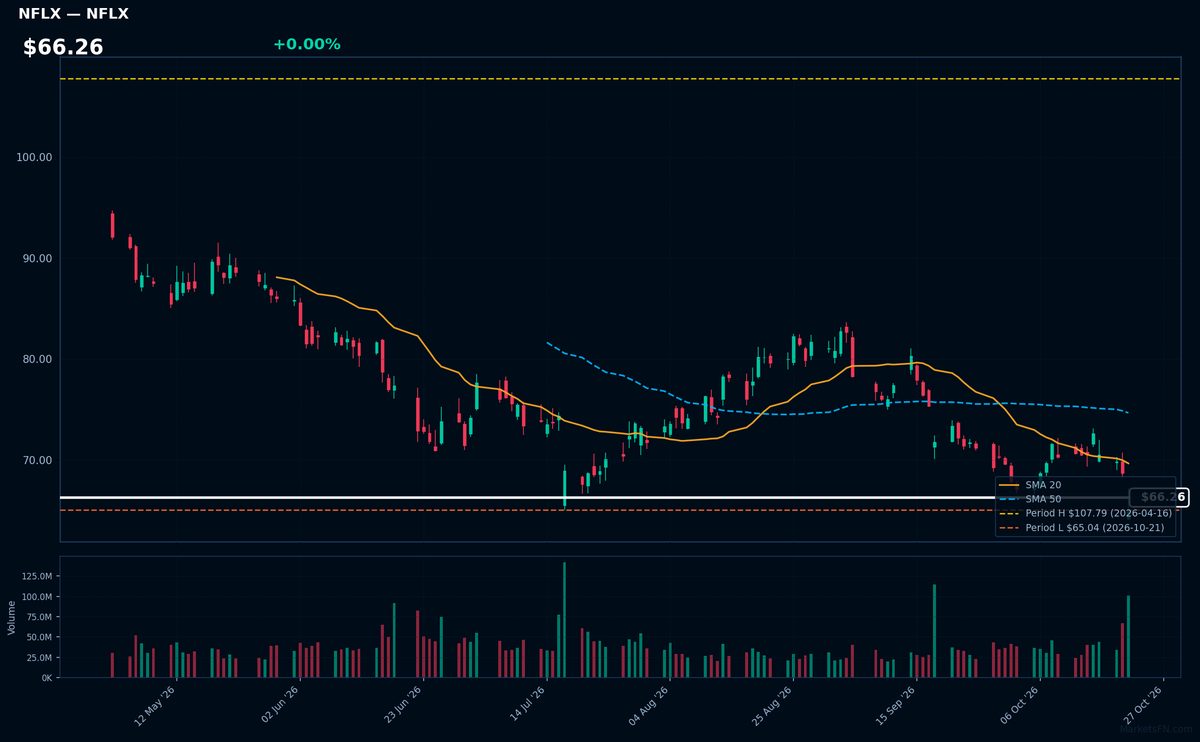
NFLX | Netflix Inc | Communication Services | Price Last: $65.04 | % Realized: -28.52% | RSI: 37.0 | % above MA200: -21.1% | Trend: Below MA20, MA50, MA200
Netflix Inc dominates global streaming with 260M+ subscribers, monetizing original content and licensing. Investors watch for pricing power, churn rates, and international growth as key value drivers in the competitive SVOD space.
Netflix shows severe technical weakness: RSI(14) at 37.0 with bearish MA alignment (price < MA20 < MA50 < MA200). Testing 2026 lows after -28.5% YTD decline signals breakdown risk.
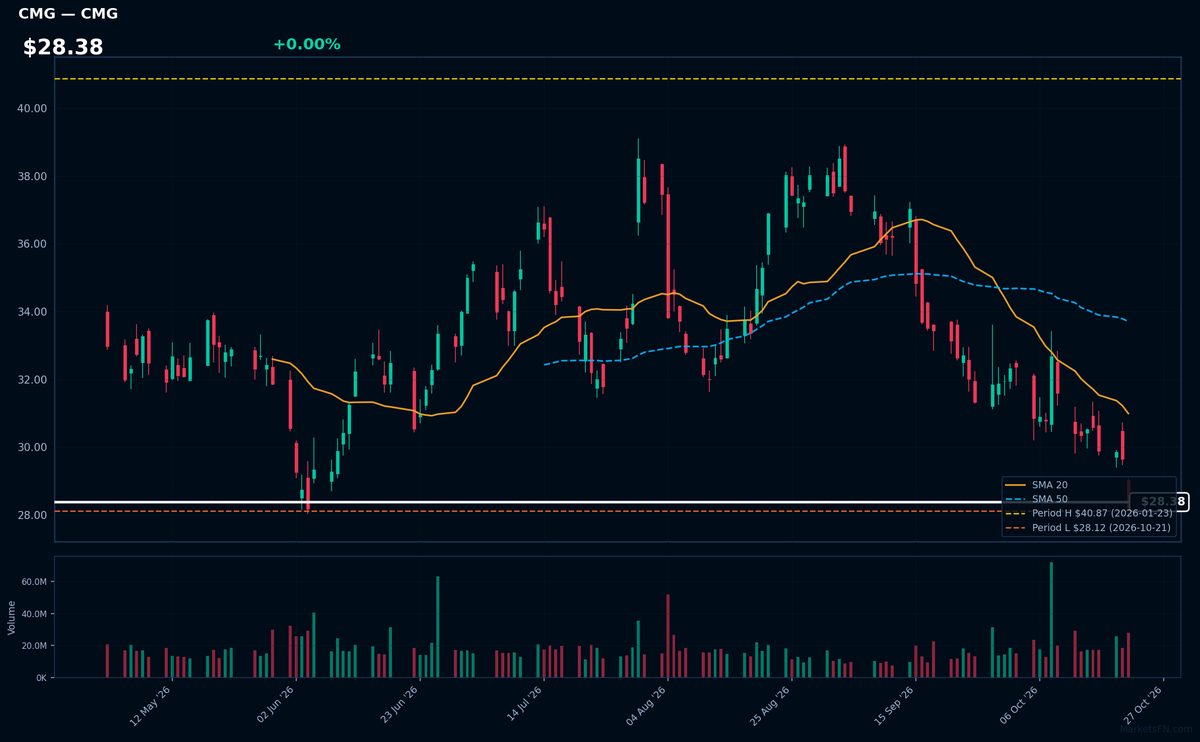
CMG | Chipotle Mexican Grill | Consumer Cyclical | Price Last: $28.12 | % Realized: -24.99% | RSI: 29.3 | % above MA200: -18.2% | Trend: Below MA20, MA50, MA200
Chipotle Mexican Grill operates fast-casual Mexican restaurants emphasizing fresh ingredients. Investors care due to its premium brand positioning, pricing power in quick-service dining, and unit growth potential as consumers prioritize convenience without sacrificing quality.
Chipotle shows extreme technical weakness: RSI(14) at 29.3 (oversold), with sustained downtrend (price $28.38 below all MAs). Testing YTD lows after 25.0% 2026 decline warns of breakdown risk.
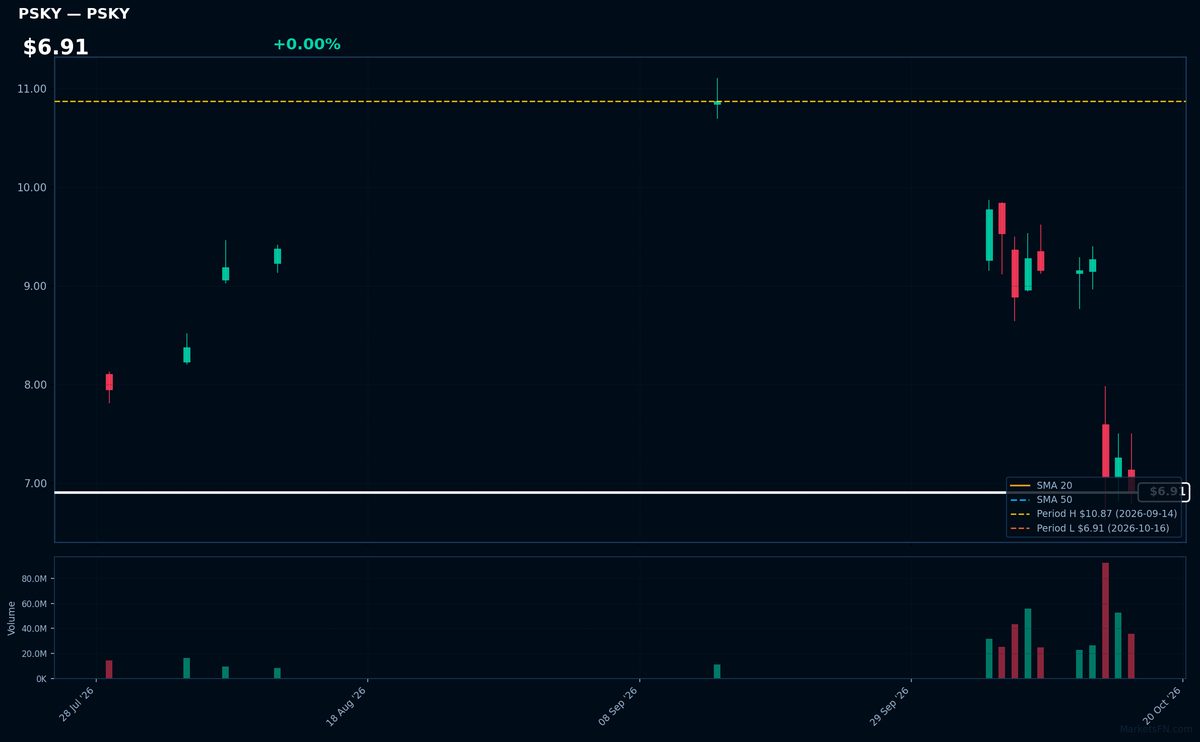
PSKY | Paramount Skydance Corp | Communication Services | Price Last: $6.91 | % Realized: -13.08% | RSI: 34.7 | % above MA200: — | Trend: —
Paramount Skydance Corp operates in [specific industry/sector not provided in data]. Investors monitor it due to [specific catalyst/reason not stated in data], though current technicals suggest caution given the -13.1% YTD decline and extreme proximity to 2026 lows.
Technically concerning — RSI(14) at 34.7 shows near-oversold conditions while the stock tests critical support, just 0.0% above its 2026 YTD low. MA alignment data incomplete, but -13.1% YTD return signals persistent weakness. Monitor for breakdown or reversal.
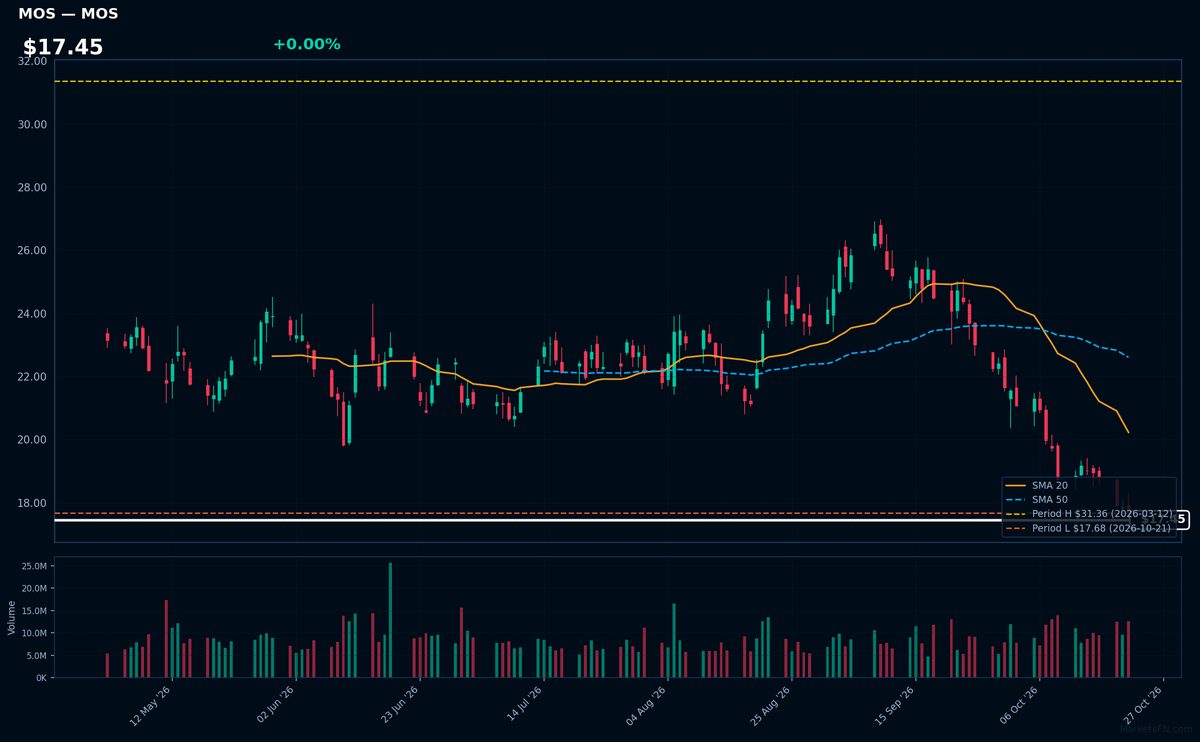
MOS | Mosaic Company | Basic Materials | Price Last: $17.68 | % Realized: -29.34% | RSI: 20.7 | % above MA200: -26.7% | Trend: Below MA20, MA50, MA200
Mosaic Company produces concentrated phosphate and potash crop nutrients for global agriculture. Investors monitor MOS as a key fertilizer supplier exposed to farm economics, crop prices, and emerging market food demand.
Technically extreme at RSI 20.7 with bearish MA alignment (price < MA20 < MA50 < MA200) and -29.3% YTD decline. Testing 2026 lows warns of persistent downtrend.
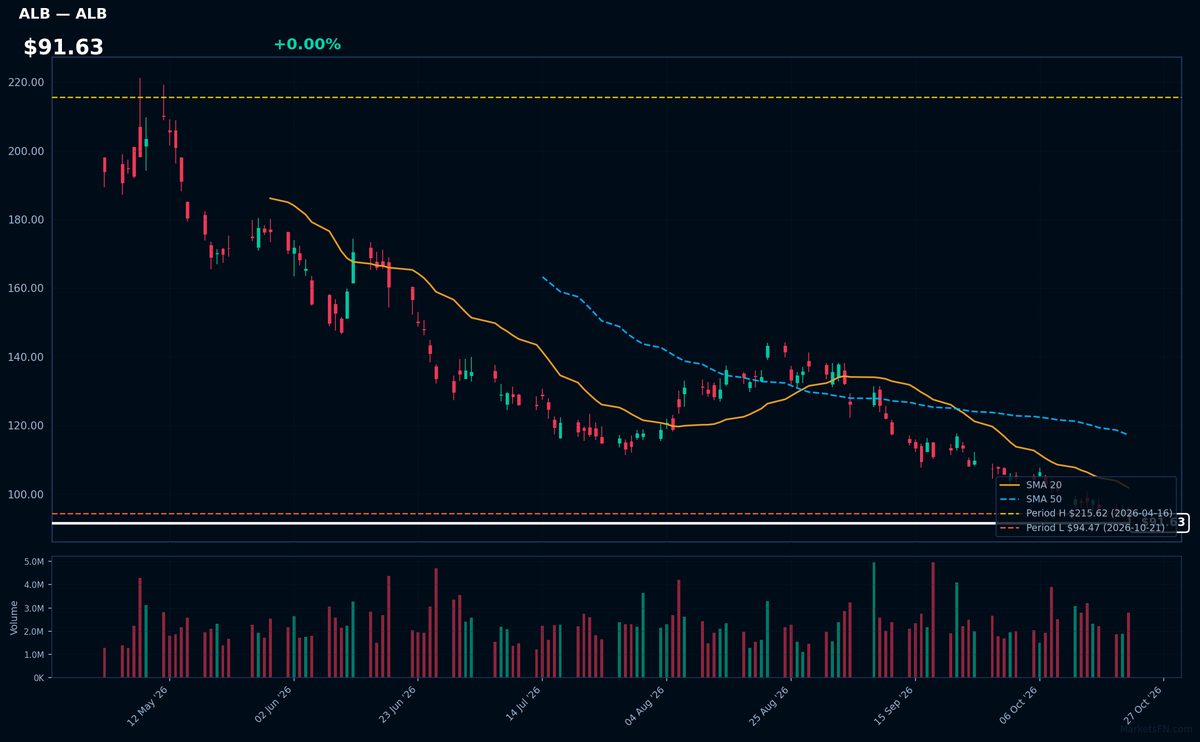
ALB | Albemarle Corp | Basic Materials | Price Last: $94.47 | % Realized: -34.36% | RSI: 24.4 | % above MA200: -37.9% | Trend: Below MA20, MA50, MA200
Albemarle Corp is a leading global producer of lithium, bromine, and catalysts critical for electric vehicle batteries, flame retardants, and refining. Investors track it as a key EV supply chain play with exposure to lithium price cycles.
ALB shows extreme technical weakness: RSI(14) at 24.4 (oversold) with sustained bearish MA alignment (price < MA20 < MA50 < MA200). Trading just 0.0% above 2026 lows after a -34.4% YTD drop signals severe downside momentum, testing critical support.
Market Commentary
The S&P 500's 2026 performance reveals stark divergences, with Apple, Visa, Mastercard, Chevron, and ServiceNow trading at their year-to-date highs, while Netflix, Chipotle, Paramount Skydance, Mosaic, and Albemarle hover near lows. Stocks at highs suggest sustained investor confidence in resilient sectors—payments (V, MA), energy (CVX), and enterprise software (NOW)—while those at lows face pressure, particularly in streaming (NFLX), dining (CMG), and materials (MOS, ALB). This polarization reflects selective risk appetite amid macroeconomic uncertainty.
Sector themes emerge clearly: financial technology and energy outperform as stable cash flows attract capital, while consumer discretionary and commodity-linked names struggle. ServiceNow's strength underscores enterprise digital transformation demand, whereas Paramount Skydance's weakness highlights media consolidation challenges. Albemarle and Mosaic's proximity to lows signals skepticism on materials demand, contrasting with Chevron's energy sector resilience. Market conditions favor defensive growth and yield, penalizing cyclical exposure.
Investors should monitor earnings revisions for these extremes—particularly streaming subscriber trends (NFLX), lithium/fertilizer prices (ALB, MOS), and oil market dynamics (CVX). Payment networks' transaction volumes (V, MA) and SaaS adoption (NOW) remain key catalysts. Any macroeconomic shifts—rate cuts, commodity rebounds, or consumer spending changes—could force reversals in these bifurcated trends.
Methodology: All 503 S&P 500 constituents screened. Close prices downloaded from 2026-01-01. Period high = highest close since Jan 1 2026; period low = lowest close since Jan 1 2026. Distance = (current price / period extreme − 1) × 100. Technical indicators computed on up to 1 year of daily OHLCV data.
Disclaimer: For informational purposes only. Not investment advice. Past performance is not indicative of future results.