Nasdaq 100 2026 YTD Highs & Lows Radar: Apple (AAPL), Netflix (NFLX) and more
MarketsFN Team

Screening all 101 Nasdaq 100 constituents for stocks nearest to their 2026 year-to-date high and their 2026 YTD low. Data as of October 22, 2026. % Realized = total return since Jan 1 2026.
Legend: RSI > 70 = overbought · RSI < 30 = oversold · Green % Realized = positive YTD return · Red = negative.
📈 Nearest to 2026 High
Sectors represented: Technology (2), Industrials (2), Consumer Cyclical (1)
| Ticker | Company | Sector | Price Last | % Realized | 2026 YTD High Date | RSI | % above MA200 | Trend |
|---|---|---|---|---|---|---|---|---|
| AAPL | Apple Inc | Technology | $343.99 | +26.93% | 2026-10-21 | 62.2 | +17.0% | Above MA20, MA50, MA200 |
| ADP | Automatic Data Processing Inc | Technology | $294.50 | +16.46% | 2026-10-21 | 76.2 | +23.0% | Above MA20, MA50, MA200 |
| CTAS | Cintas Corporation | Industrials | $220.15 | +19.08% | 2026-10-21 | 76.7 | +16.2% | Above MA20, MA50, MA200 |
| MAR | Marriott International, Inc | Consumer Cyclical | $404.00 | +28.90% | 2026-10-21 | 78.0 | +14.2% | Above MA20, MA50, MA200 |
| FAST | Fastenal Co | Industrials | $52.49 | +29.80% | 2026-10-21 | 52.2 | +11.9% | Above MA20, MA50, MA200 |
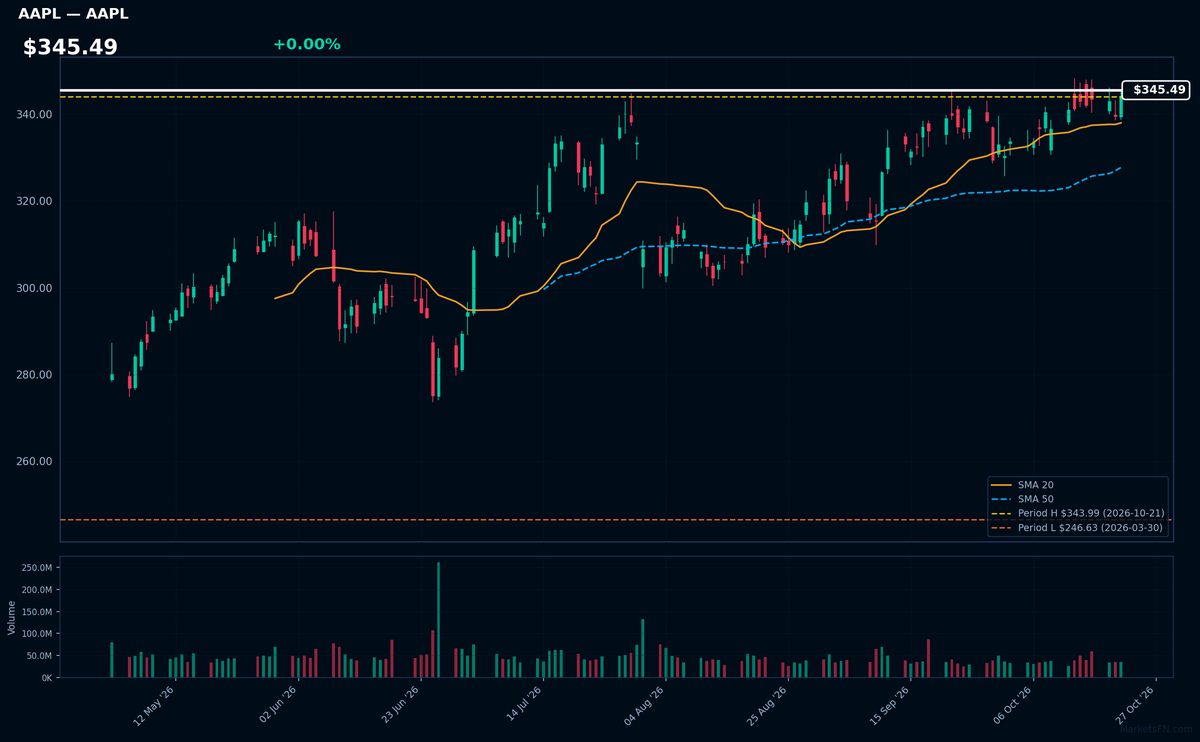
AAPL | Apple Inc | Technology | Price Last: $343.99 | % Realized: +26.93% | RSI: 62.2 | % above MA200: +17.0% | Trend: Above MA20, MA50, MA200
Apple Inc designs premium consumer electronics (iPhone, Mac), services (App Store, Apple Music), and chipsets. Investors care because its ecosystem drives recurring revenue and industry-leading margins (gross margin 42.3% in Q1'26).
AAPL shows bullish momentum: RSI(14) at 62.2 (neutral-bullish), price > MA20 > MA50 > MA200, and just 0.0% below its 2026 high. The 26.9% YTD gain suggests sustained uptrend strength.
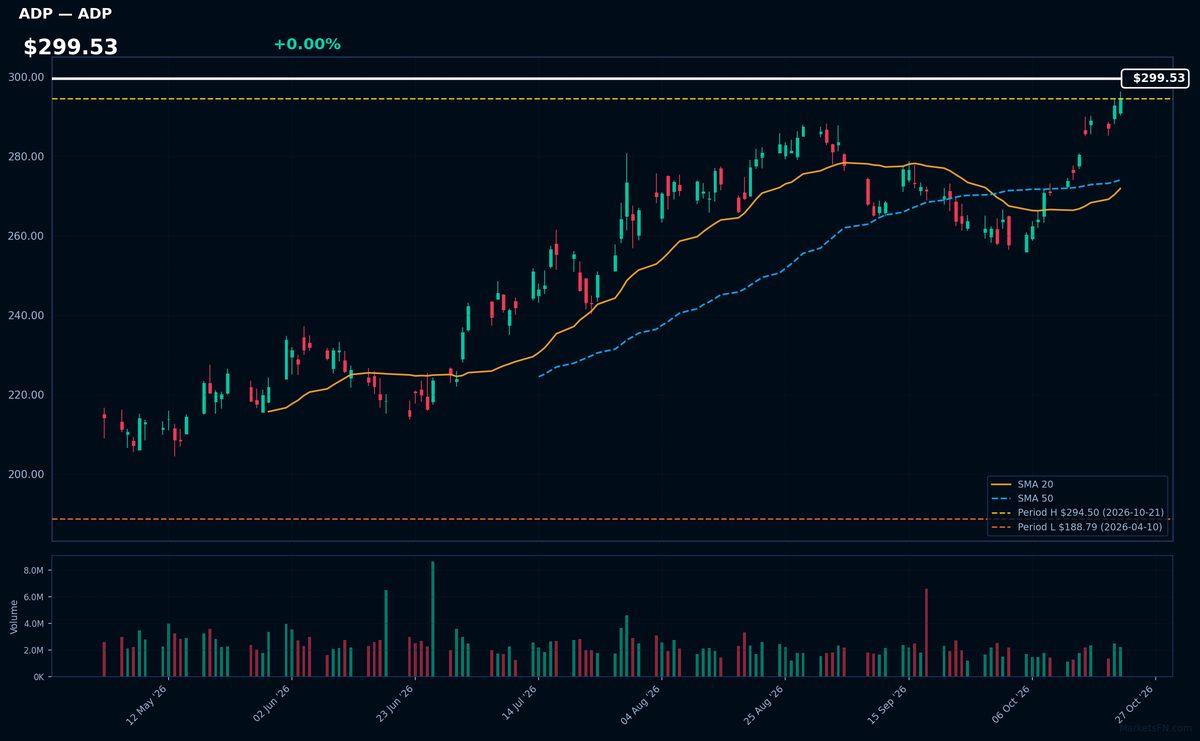
ADP | Automatic Data Processing Inc | Technology | Price Last: $294.50 | % Realized: +16.46% | RSI: 76.2 | % above MA200: +23.0% | Trend: Above MA20, MA50, MA200
Automatic Data Processing Inc (ADP) provides cloud-based HR and payroll solutions, serving over 1 million clients globally. Investors should care because its recurring revenue model and mission-critical services drive consistent cash flows, with the stock up 16.5% YTD in 2026.
ADP trades at $299.53 with an overbought RSI(14) of 76.2, testing its 2026 high (0.0% below). The mixed MA alignment (above MA20/MA50/MA200) suggests stretched momentum — watch for confirmation or reversal near this breakout level.
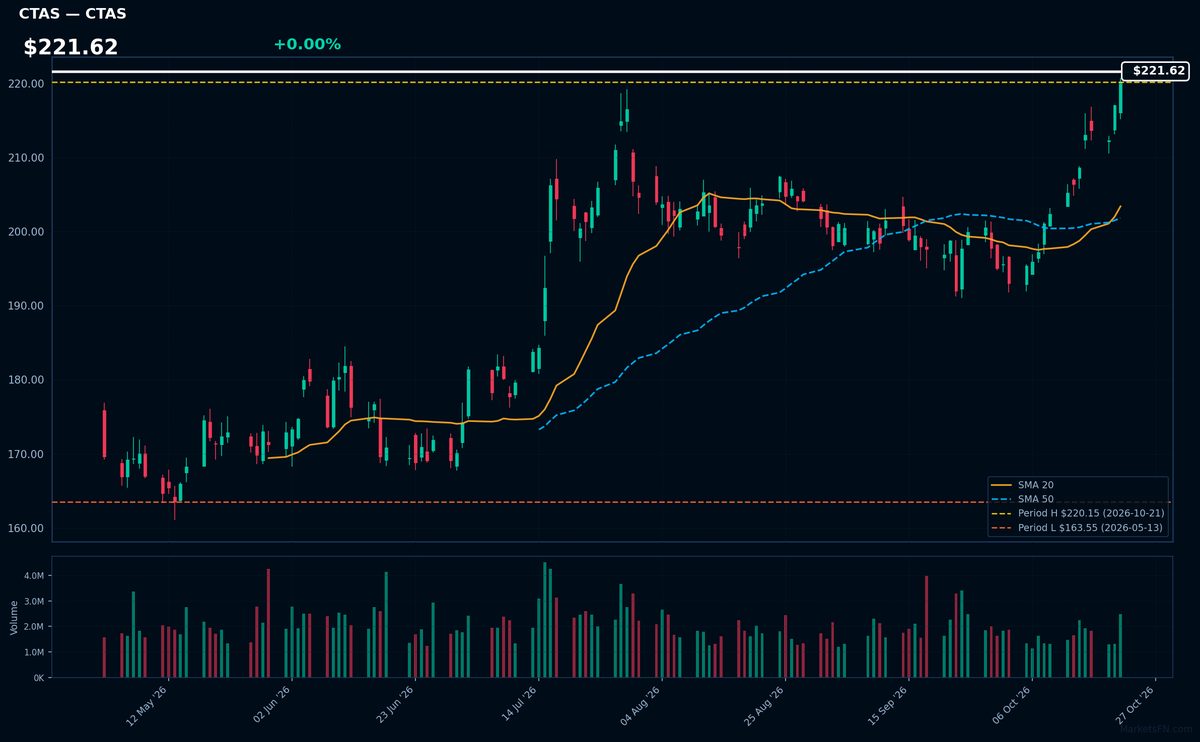
CTAS | Cintas Corporation | Industrials | Price Last: $220.15 | % Realized: +19.08% | RSI: 76.7 | % above MA200: +16.2% | Trend: Above MA20, MA50, MA200
Cintas provides corporate identity uniforms and business services (restroom supplies, first aid, safety products) to over 1 million businesses. Investors care because its recession-resistant B2B model delivers consistent cash flows and market share gains in fragmented industries.
CTAS shows extreme bullish momentum (RSI 76.7, price > MA20 > MA50 > MA200) but nears overbought territory at YTD highs. The 19.1% YTD surge suggests continuation potential, though RSI warns of short-term exhaustion.
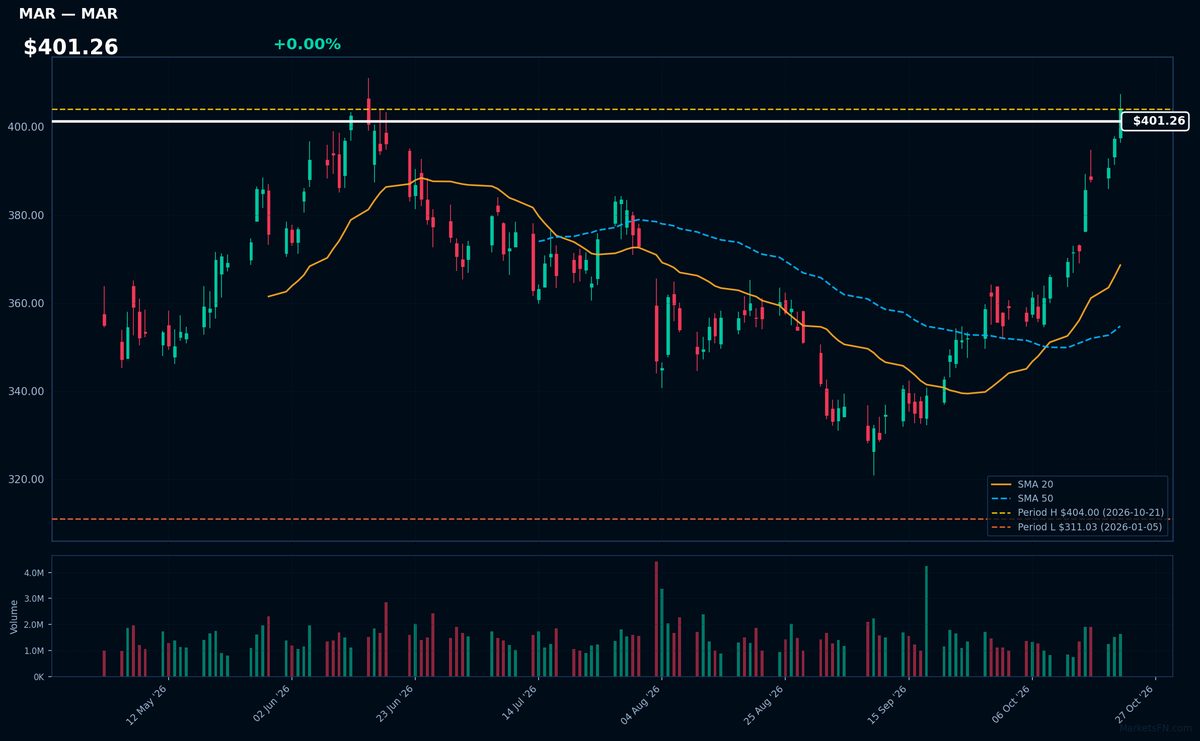
MAR | Marriott International, Inc | Consumer Cyclical | Price Last: $404.00 | % Realized: +28.90% | RSI: 78.0 | % above MA200: +14.2% | Trend: Above MA20, MA50, MA200
Marriott operates 8,700+ hotels under 30 brands (Ritz-Carlton to Fairfield) and earns fees from management/franchising. Investors care for its asset-light model (90% franchised) and global travel rebound exposure, particularly in luxury where RevPAR growth remains strong.
MAR shows extreme bullish momentum (RSI 78, price > MA20 > MA50 > MA200) after 28.9% YTD surge. The stock tests 2026 highs (0.0% below peak) — either breakout fuel or overbought risk given stretched RSI. No fundamental data provided to assess valuation.
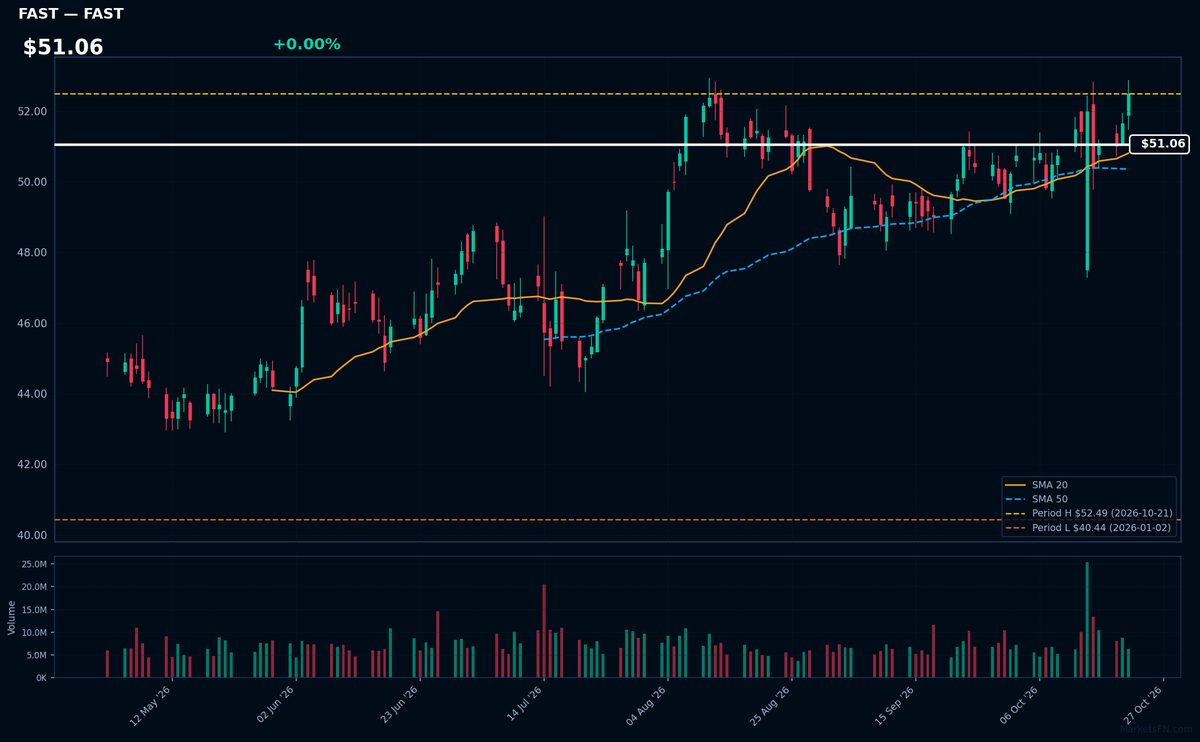
FAST | Fastenal Co | Industrials | Price Last: $52.49 | % Realized: +29.80% | RSI: 52.2 | % above MA200: +11.9% | Trend: Above MA20, MA50, MA200
Fastenal supplies industrial and construction supplies (fasteners, tools, safety equipment) via 3,300+ on-site locations. Investors care because its vast distribution network drives consistent revenue growth and pricing power in cyclical markets.
Technically bullish: RSI(14) at 52.2 shows balanced momentum, while MA alignment (price > MA20 > MA50 > MA200) confirms uptrend. Stock tests YTD highs after 29.8% 2026 gain.
📉 Nearest to 2026 Low
Sectors represented: Communication Services (3), Consumer Cyclical (1), Industrials (1)
| Ticker | Company | Sector | Price Last | % Realized | 2026 YTD Low Date | RSI | % above MA200 | Trend |
|---|---|---|---|---|---|---|---|---|
| NFLX | Netflix Inc | Communication Services | $65.04 | -28.52% | 2026-10-21 | 37.8 | -21.1% | Below MA20, MA50, MA200 |
| APP | Applovin Corp | Communication Services | $267.90 | -56.67% | 2026-10-14 | 38.1 | -37.3% | Below MA20, MA50, MA200 |
| BKNG | Booking Holdings Inc | Consumer Cyclical | $158.38 | -25.62% | 2026-05-15 | 44.9 | -11.4% | Below MA20, MA50, MA200 |
| PCAR | Paccar Inc | Industrials | $110.22 | -1.20% | 2026-10-07 | 37.8 | -8.6% | Above MA20 · Below MA50, MA200 |
| TMUS | T-Mobile US Inc | Communication Services | $153.75 | -22.96% | 2026-10-09 | 43.3 | -18.4% | Below MA20, MA50, MA200 |
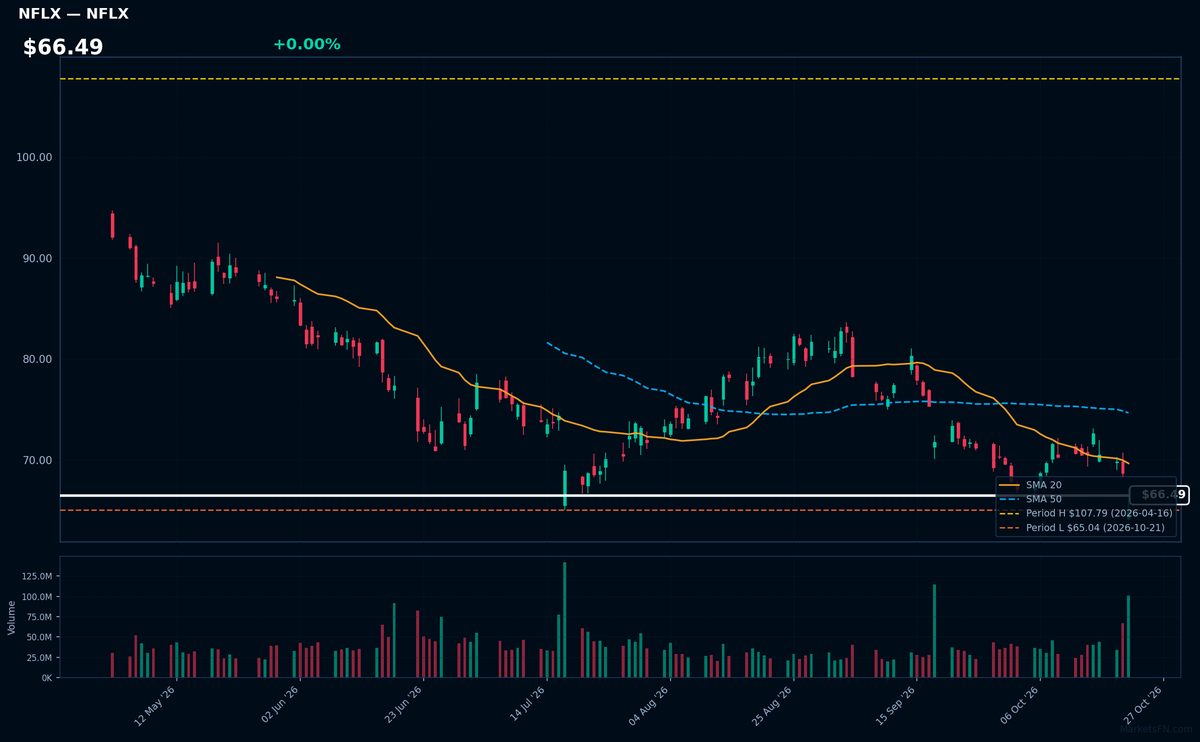
NFLX | Netflix Inc | Communication Services | Price Last: $65.04 | % Realized: -28.52% | RSI: 37.8 | % above MA200: -21.1% | Trend: Below MA20, MA50, MA200
Netflix Inc dominates global streaming with 250M+ subscribers, monetizing content through subscriptions and ads. Investors care for its pricing power, scale advantages in original content production, and potential to leverage its platform for new revenue streams as streaming penetration grows worldwide.
Netflix shows severe technical weakness: RSI(14) at 37.8 confirms bearish momentum, with price ($66.49) below all key MAs (MA20/50/200). The stock tests 2026 lows after a 28.5% YTD plunge — a clear warning sign. MA alignment remains decisively bearish.
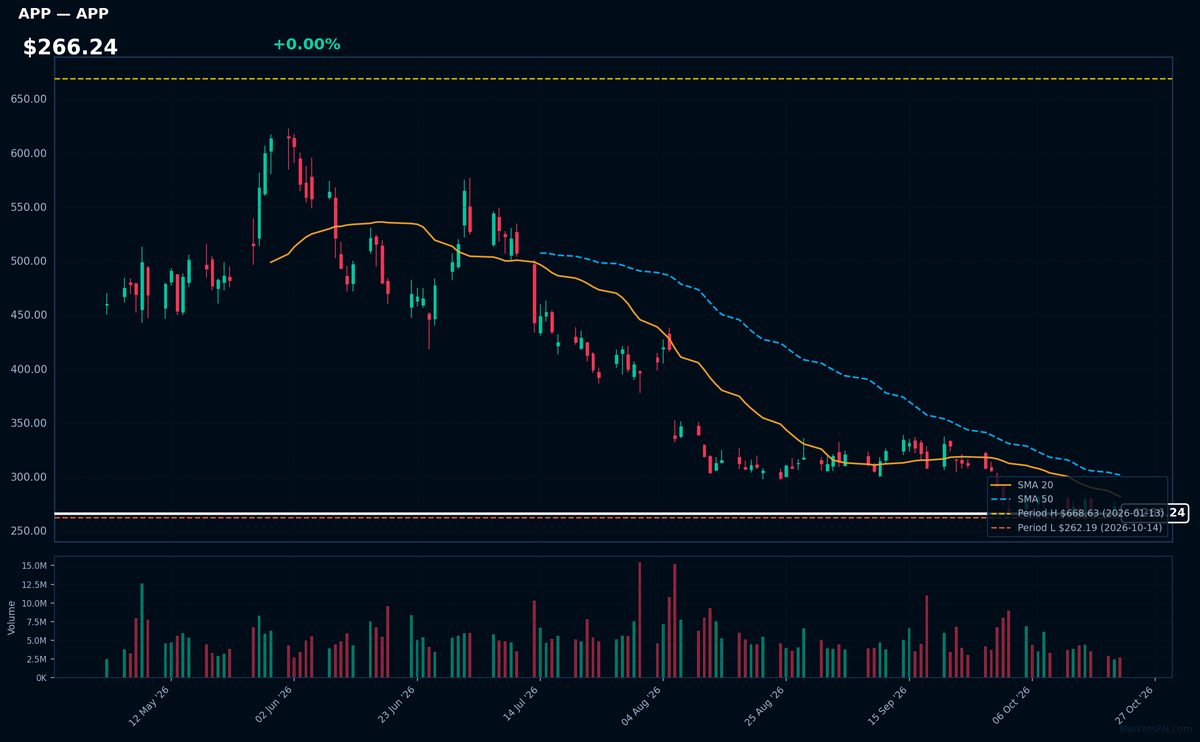
APP | Applovin Corp | Communication Services | Price Last: $267.90 | % Realized: -56.67% | RSI: 38.1 | % above MA200: -37.3% | Trend: Below MA20, MA50, MA200
Applovin operates a mobile app monetization platform, connecting developers with advertisers through its AXON AI-powered ad network. Investors care because its tech stack directly monetizes the $400B+ mobile app economy, though exposure to digital ad cyclicality creates volatility.
Technically dire: RSI 38.1 shows oversold conditions amid bearish MA alignment (price < MA20 < MA50 < MA200). At just 2.2% above YTD lows after a 56.7% 2026 plunge, this tests critical support — a warning sign, not a dip-buying opportunity.
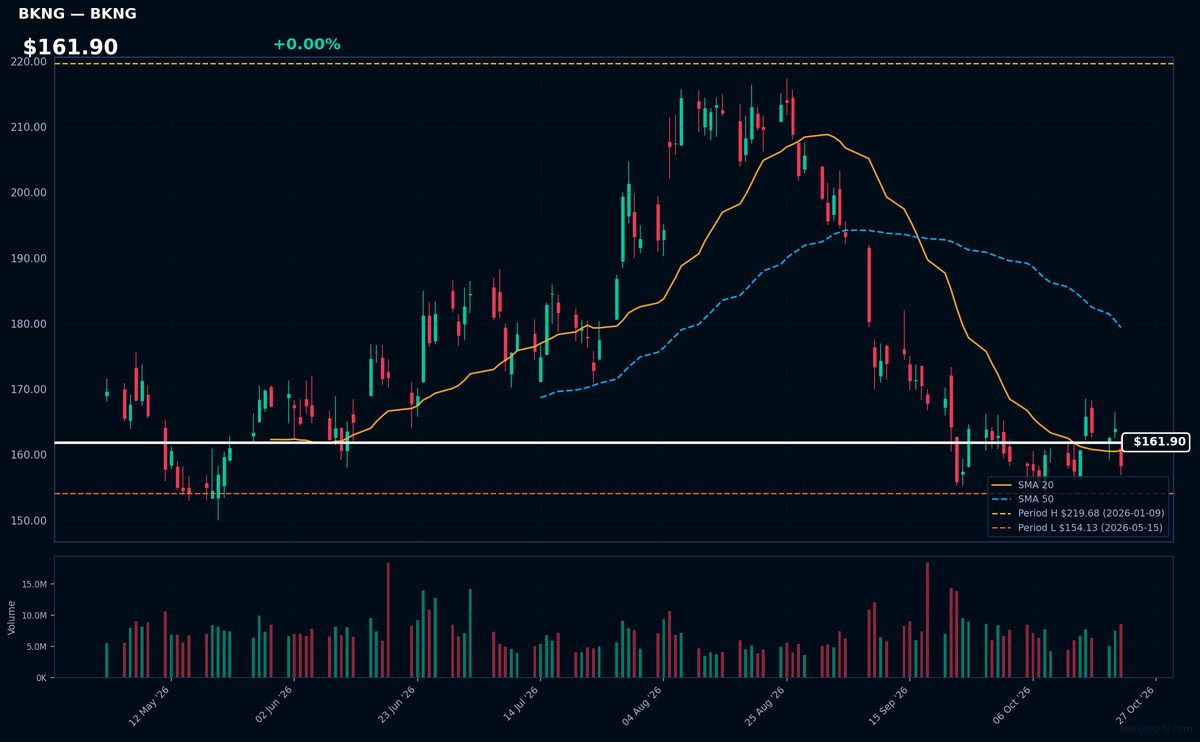
BKNG | Booking Holdings Inc | Consumer Cyclical | Price Last: $158.38 | % Realized: -25.62% | RSI: 44.9 | % above MA200: -11.4% | Trend: Below MA20, MA50, MA200
Booking Holdings operates leading online travel platforms (Booking.com, Priceline, Kayak) connecting travelers with lodging/transportation. Investors care about its global scale in the $1.8T travel market and asset-light model generating high-margin recurring revenue from commissions.
Technically concerning: RSI(14) at 44.9 shows weakening momentum, with price ($161.90) trapped between MA20 (support) and MA50/200 (resistance). Down 25.6% YTD and just 2.8% above 2026 lows signals breakdown risk if support fails.
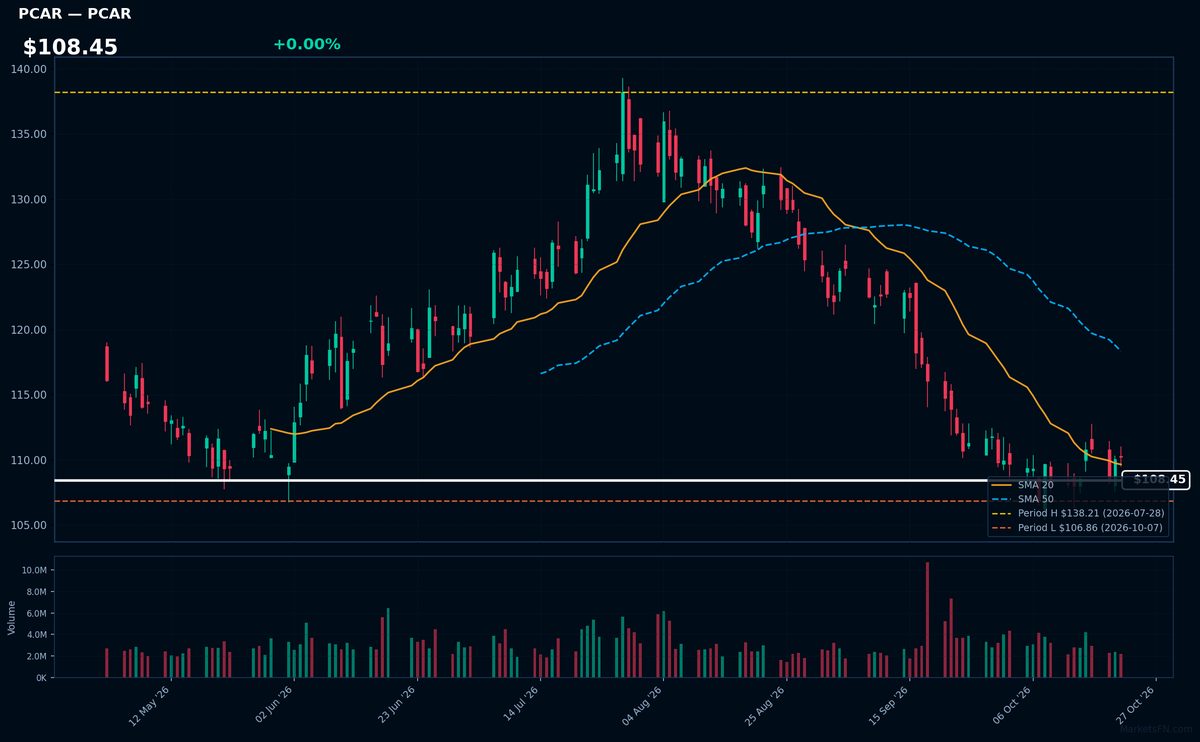
PCAR | Paccar Inc | Industrials | Price Last: $110.22 | % Realized: -1.20% | RSI: 37.8 | % above MA200: -8.6% | Trend: Above MA20 · Below MA50, MA200
Paccar designs/manufactures premium Kenworth and Peterbilt trucks, earning premium pricing through superior fuel efficiency and resale value. Investors care because its cyclical business (tied to freight demand) generates strong margins even in downturns, with a 70+ year dividend history.
PCAR shows bearish momentum (RSI 37.8, price below all MAs) and tests critical support at just 3.1% above YTD lows. The sustained downtrend (MA20 < MA50 < MA200) and YTD -1.2% return suggest weakening demand expectations for heavy trucks.
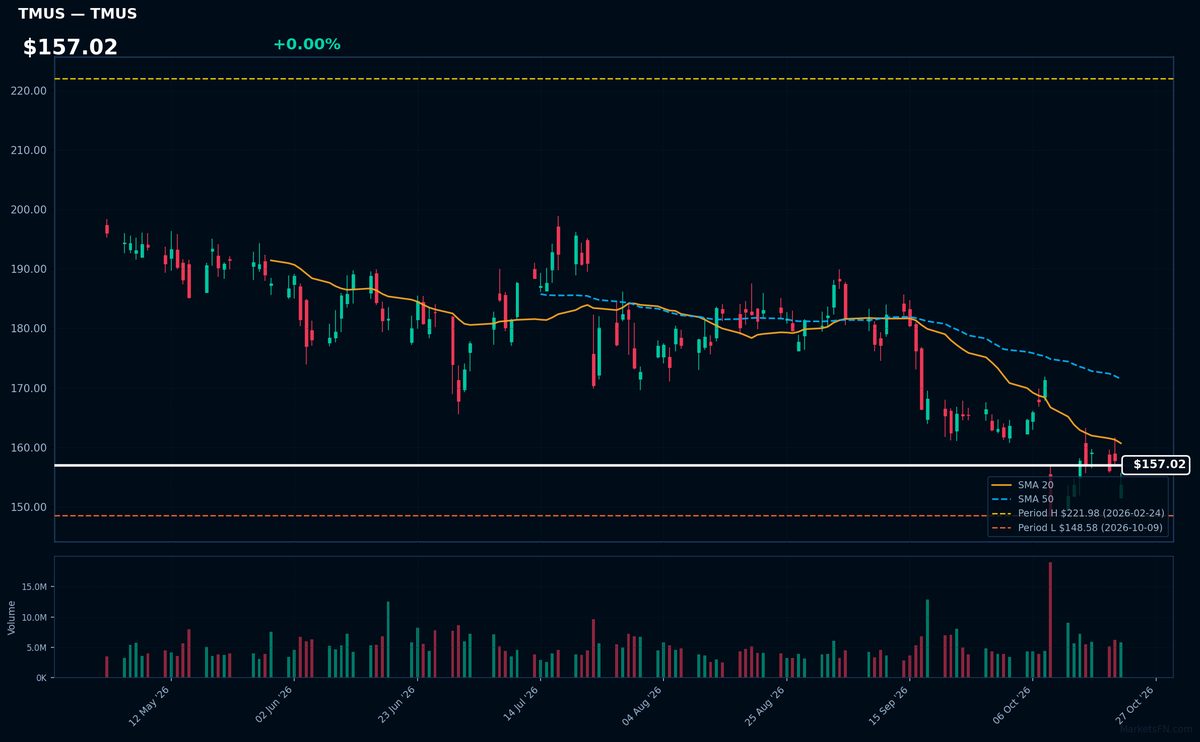
TMUS | T-Mobile US Inc | Communication Services | Price Last: $153.75 | % Realized: -22.96% | RSI: 43.3 | % above MA200: -18.4% | Trend: Below MA20, MA50, MA200
T-Mobile US Inc operates as a major wireless carrier, providing mobile services and 5G networks to consumers and businesses. Investors watch TMUS for its competitive pricing, network expansion, and market share gains in the telecom sector.
TMUS shows bearish momentum with RSI(14) at 43.3 and a sustained downtrend (price < MA20 < MA50 < MA200). The stock is down 23.0% YTD in 2026 and hovering just 3.5% above its YTD low, signaling weak near-term support.
Market Commentary
The Nasdaq 100's 2026 extremes reveal a stark divergence in tech and tech-adjacent performance. Apple (AAPL), ADP, Cintas (CTAS), Marriott (MAR), and Fastenal (FAST) are pinned at yearly highs, reflecting resilient demand for productivity tools, business services, and cyclical recovery plays. Conversely, Netflix (NFLX), AppLovin (APP), Booking (BKNG), Paccar (PCAR), and T-Mobile (TMUS) hover near lows, signaling pressure on consumer discretionary spending, ad-tech volatility, and industrial/telecom headwinds.
This bifurcation underscores macro uncertainty: high performers benefit from enterprise digitization (AAPL, ADP), essential services (CTAS, MAR), and industrial supply chains (FAST), while laggards face streaming saturation (NFLX), mobile advertising churn (APP), and travel normalization (BKNG). Interest rate sensitivity weighs on growth-dependent names, with TMUS and PCAR additionally exposed to capex cyclicality. The market rewards predictable cash flows over speculative growth.
Investors should monitor enterprise software spend (via ADP/FAST earnings), ad-market health (APP guidance), and consumer resilience (NFLX/BKNG subscriptions). A pivot in Fed policy could revive growth multiples, while prolonged tightness may extend the low-volatility premium for CTAS/MAR. Technical breaks above/below these extremes will confirm trend acceleration.
Methodology: All 101 Nasdaq 100 constituents screened. Close prices downloaded from 2026-01-01. Period high = highest close since Jan 1 2026; period low = lowest close since Jan 1 2026. Distance = (current price / period extreme − 1) × 100. Technical indicators computed on up to 1 year of daily OHLCV data.
Disclaimer: For informational purposes only. Not investment advice. Past performance is not indicative of future results.