S&P 500 52-Week Highs & Lows Radar: Apple (AAPL), First Solar (FSLR) and more
MarketsFN Team

Screening all 503 S&P 500 constituents for stocks nearest to their 52-week high and their 52-week low. Data as of October 22, 2026. % Realized = 52-week total return.
Legend: RSI > 70 = overbought · RSI < 30 = oversold · Green % Realized = positive 52W return · Red = negative.
📈 Nearest to 52-Week High
Sectors represented: Financial (3), Technology (1), Healthcare (1)
| Ticker | Company | Sector | Price Last | % Realized | 52-Week High Date | RSI | % above MA200 | Trend |
|---|---|---|---|---|---|---|---|---|
| AAPL | Apple Inc | Technology | $345.61 | +33.72% | 2026-10-22 | 62.3 | +17.6% | Above MA20, MA50, MA200 |
| BRK-B | Berkshire Hathaway Inc | Financial | $545.40 | +10.90% | 2026-10-22 | 80.9 | +10.3% | Above MA20, MA50, MA200 |
| LLY | Lilly(Eli) & Co | Healthcare | $1298.64 | +59.85% | 2026-10-22 | 69.8 | +19.8% | Above MA20, MA50, MA200 |
| V | Visa Inc | Financial | $410.57 | +18.88% | 2026-10-22 | 77.5 | +20.7% | Above MA20, MA50, MA200 |
| MA | Mastercard Incorporated | Financial | $626.63 | +9.67% | 2026-10-22 | 77.6 | +17.3% | Above MA20, MA50, MA200 |
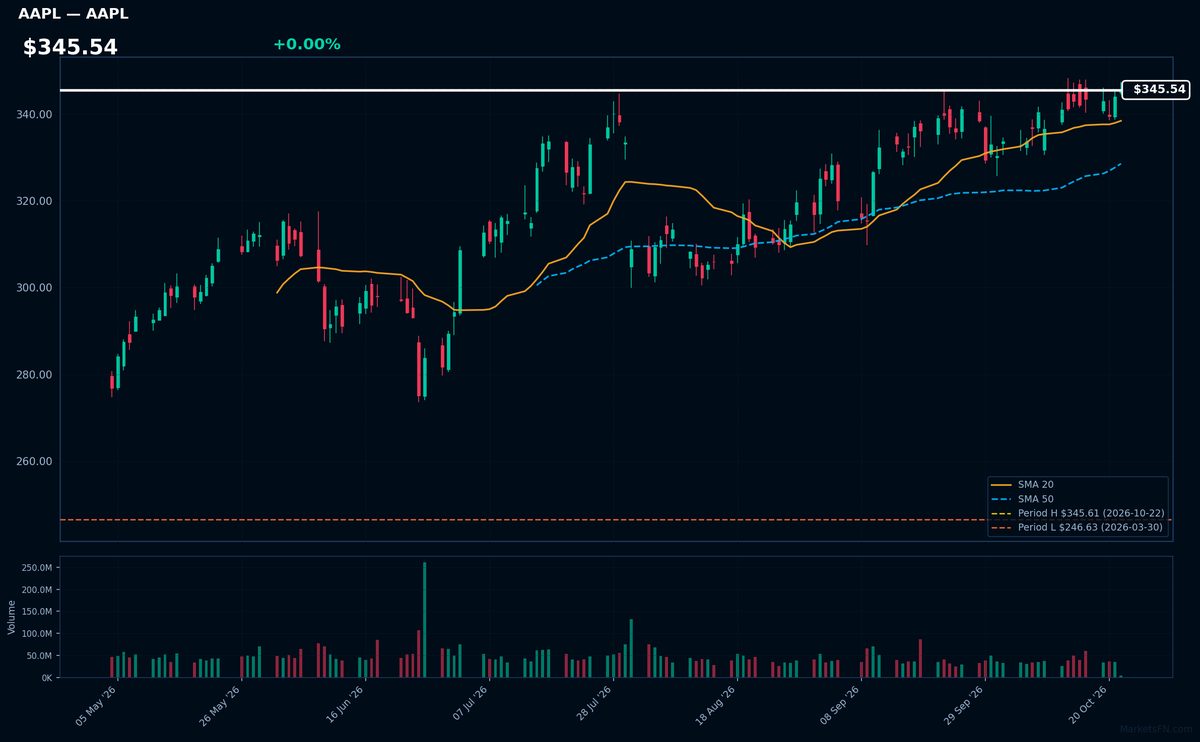
AAPL | Apple Inc | Technology | Price Last: $345.61 | % Realized: +33.72% | RSI: 62.3 | % above MA200: +17.6% | Trend: Above MA20, MA50, MA200
Apple Inc designs premium consumer electronics (iPhone, Mac), services (App Store, iCloud), and wearables (Apple Watch). Investors care because its ecosystem drives recurring revenue and pricing power, with 33.7% annual returns showing sustained execution.
Technically bullish: $345.54 trades above all key MAs (20/50/200) in sustained uptrend, RSI(14) at 62.3 shows room before overbought. At 0.0% below 52-week high, near breakout confirmation.
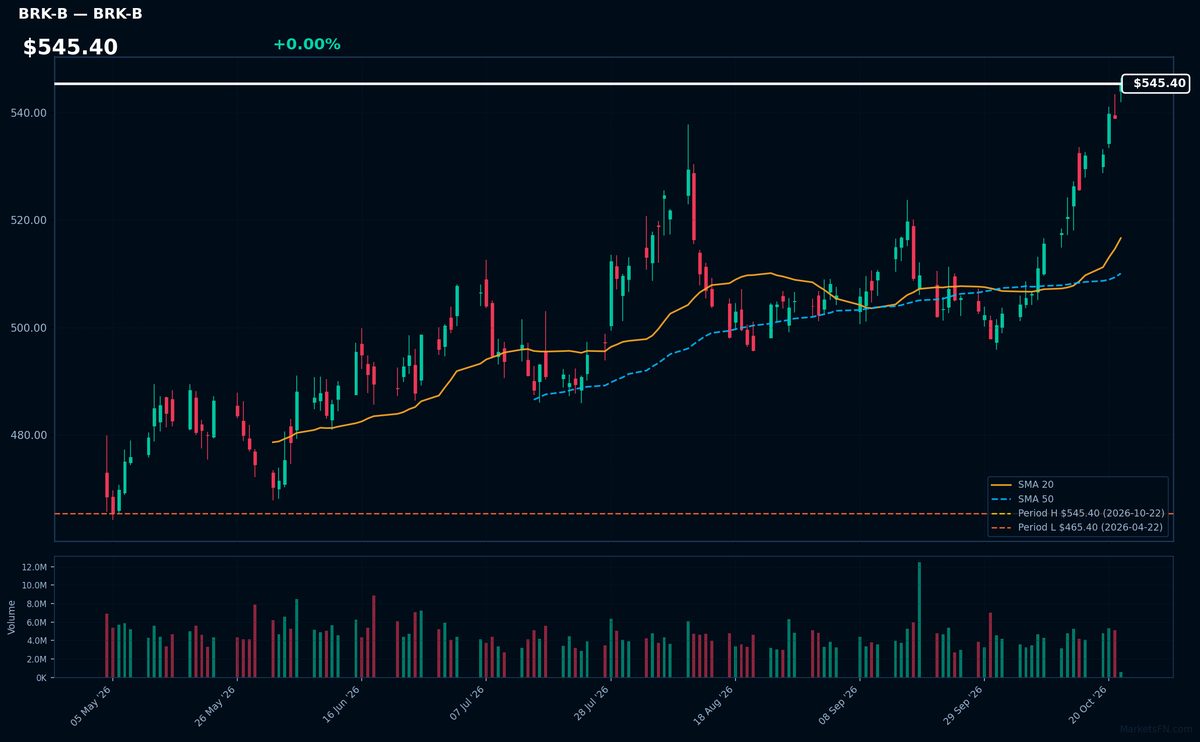
BRK-B | Berkshire Hathaway Inc | Financial | Price Last: $545.40 | % Realized: +10.90% | RSI: 80.9 | % above MA200: +10.3% | Trend: Above MA20, MA50, MA200
Berkshire Hathaway is a diversified holding company with major insurance operations (GEICO, reinsurance) and controlling stakes in railroads (BNSF), utilities, and consumer brands. Investors care for its unique conglomerate structure, disciplined capital allocation under Warren Buffett, and exposure to both defensive and cyclical industries through wholly-owned subsidiaries.
Technically overbought with RSI(14) at 80.9 and bullish MA alignment (price > MA20 > MA50 > MA200). At 0.0% below 52-week highs after a 10.9% yearly gain, this suggests extreme momentum—watch for either breakout confirmation or mean-reversion given stretched conditions.
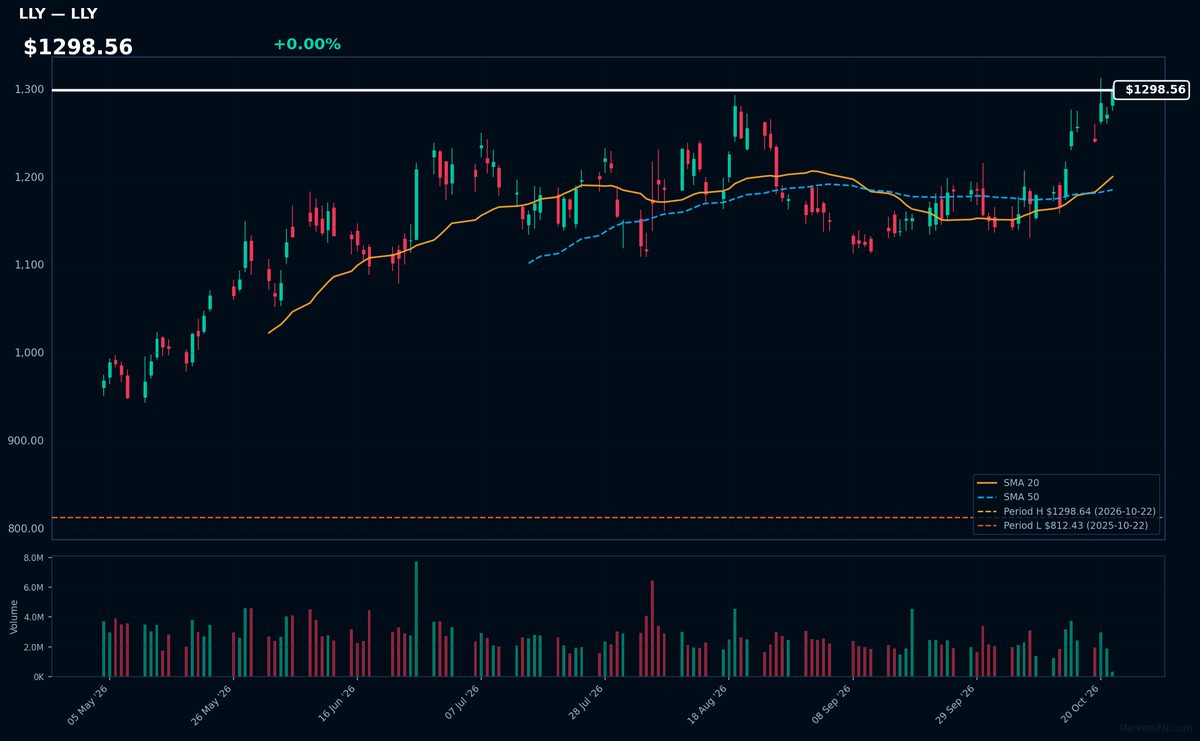
LLY | Lilly(Eli) & Co | Healthcare | Price Last: $1298.64 | % Realized: +59.85% | RSI: 69.8 | % above MA200: +19.8% | Trend: Above MA20, MA50, MA200
Lilly(Eli) & Co (LLY) develops blockbuster drugs for diabetes (Mounjaro) and Alzheimer's (donanemab), with obesity treatment Zepbound gaining traction. Investors care because its pipeline addresses high-growth chronic conditions with limited competition, driving premium pricing power.
Technically bullish: RSI(14) at 69.8 nears overbought but confirms momentum as price ($1298.56) rides a sustained MA20>MA50>MA200 uptrend. Stock hugs its 52-week high after a 59.8% annual return — watch for breakout confirmation.
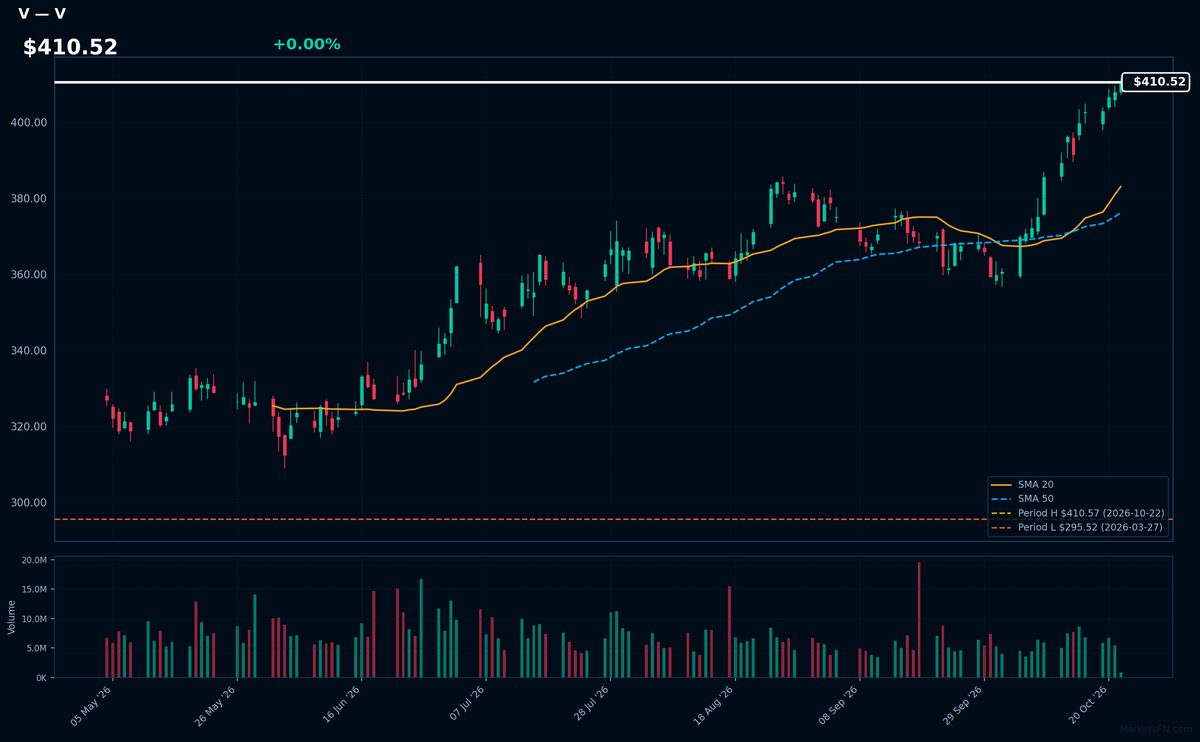
V | Visa Inc | Financial | Price Last: $410.57 | % Realized: +18.88% | RSI: 77.5 | % above MA200: +20.7% | Trend: Above MA20, MA50, MA200
Visa operates the world's largest electronic payments network, processing over $14 trillion annually. Investors care because its asset-light model generates 60%+ operating margins as global cashless adoption grows, with pricing power from duopoly market structure.
Technically overbought (RSI 77.5) but in strong uptrend (price > MA20 > MA50 > MA200). At 52-week highs after 18.9% annual return, suggesting momentum but extended near-term.
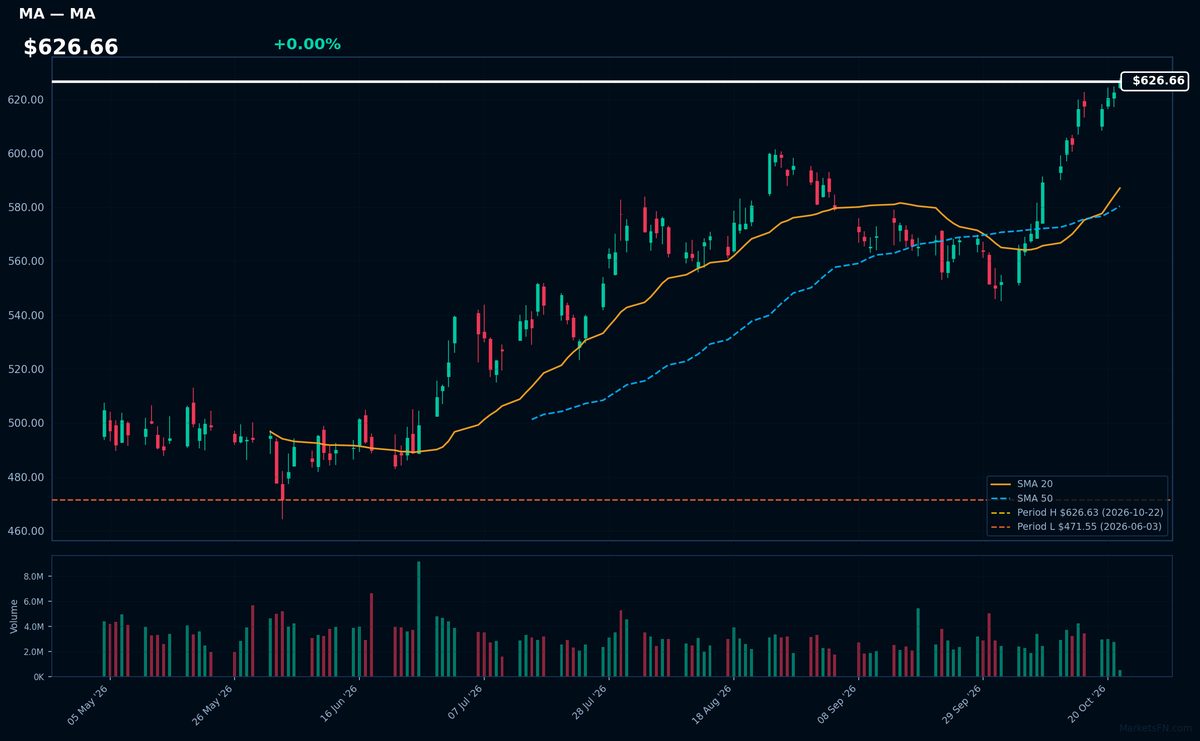
MA | Mastercard Incorporated | Financial | Price Last: $626.63 | % Realized: +9.67% | RSI: 77.6 | % above MA200: +17.3% | Trend: Above MA20, MA50, MA200
Mastercard operates a global payment network processing $8T+ in annual transactions. Investors should care about its asset-light model with 60%+ operating margins, recurring revenue from swipe fees, and exposure to cash-to-card conversion in emerging markets.
Technically overbought (RSI 77.6) but in strong uptrend (price > MA20 > MA50 > MA200). At 52-week highs (+9.7% YTD), momentum suggests continuation though RSI warrants caution.
📉 Nearest to 52-Week Low
Sectors represented: Consumer Cyclical (2), Technology (1), Communication Services (1), Basic Materials (1)
| Ticker | Company | Sector | Price Last | % Realized | 52-Week Low Date | RSI | % above MA200 | Trend |
|---|---|---|---|---|---|---|---|---|
| FSLR | First Solar Inc | Technology | $170.76 | -23.55% | 2026-10-22 | 37.8 | -21.6% | Below MA20, MA50, MA200 |
| PSKY | Paramount Skydance Corp | Communication Services | $6.91 | -13.08% | 2026-10-16 | 34.7 | — | — |
| MOS | Mosaic Company | Basic Materials | $17.20 | -41.99% | 2026-10-22 | 19.8 | -28.7% | Below MA20, MA50, MA200 |
| CMG | Chipotle Mexican Grill | Consumer Cyclical | $28.33 | -31.92% | 2026-10-21 | 28.8 | -17.6% | Below MA20, MA50, MA200 |
| LKQ | LKQ Corp | Consumer Cyclical | $21.64 | -28.71% | 2026-10-21 | 37.0 | -21.7% | Below MA20, MA50, MA200 |
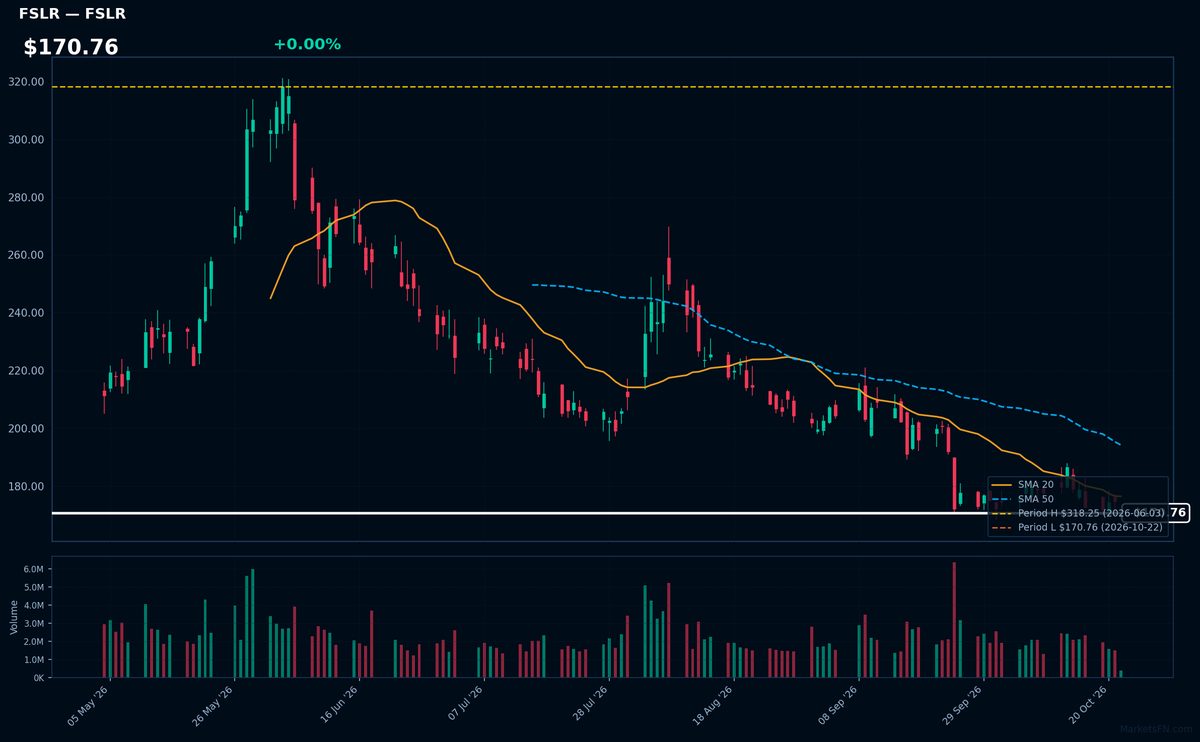
FSLR | First Solar Inc | Technology | Price Last: $170.76 | % Realized: -23.55% | RSI: 37.8 | % above MA200: -21.6% | Trend: Below MA20, MA50, MA200
First Solar manufactures thin-film solar panels using proprietary cadmium telluride technology, avoiding China-dominated silicon supply chains. Investors care because it's the only scaled US solar manufacturer eligible for Inflation Reduction Act subsidies, with $1.1B net cash providing stability amid industry turmoil.
Technically dire: RSI 37.8 shows oversold conditions while bearish MA alignment (price < MA20 < MA50 < MA200) confirms sustained downtrend. At 0.0% above 52-week lows after a 23.5% annual drop, this tests critical support.
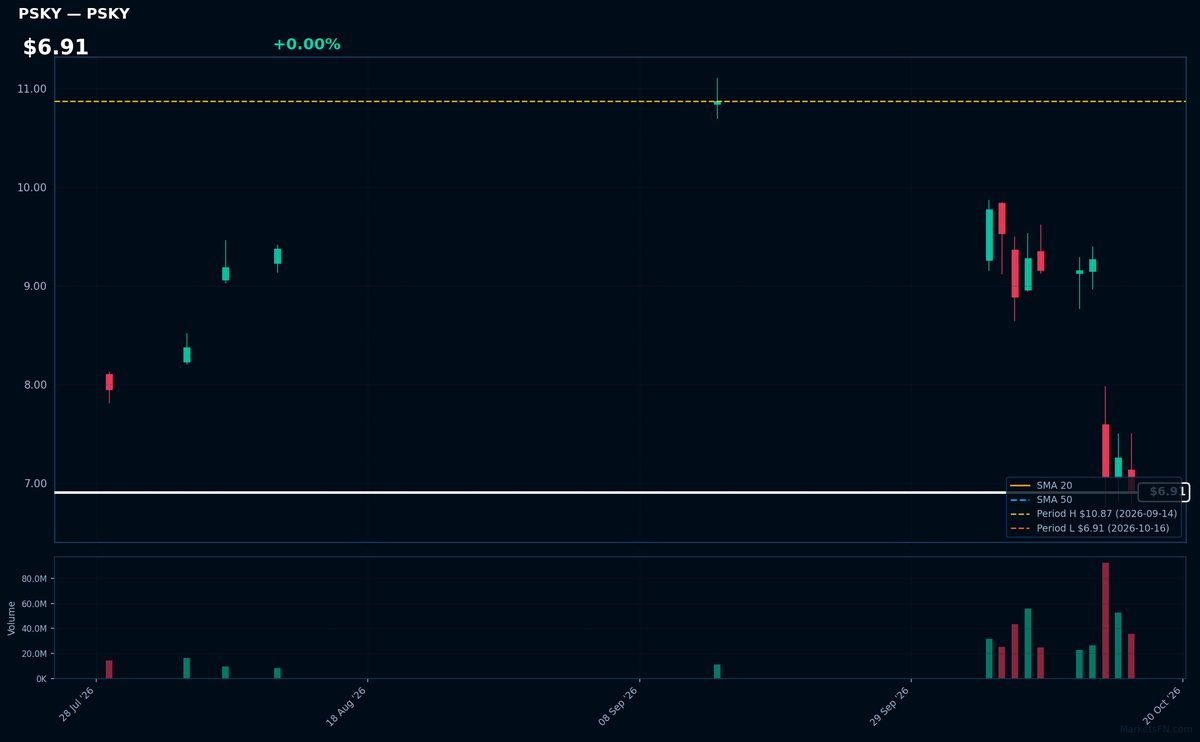
PSKY | Paramount Skydance Corp | Communication Services | Price Last: $6.91 | % Realized: -13.08% | RSI: 34.7 | % above MA200: — | Trend: —
Paramount Skydance Corp (PSKY) operates in [specific industry/sector not provided in data]. Investors monitor it for [specific catalyst not provided in data] — though current technical deterioration warrants caution given its 52-week performance.
PSKY trades at $6.91, just 0.0% above 52-week lows with oversold RSI(14) at 34.7. MA alignment data is incomplete, but the -13.1% annual return signals sustained weakness. Extreme proximity to support suggests make-or-break technicals.
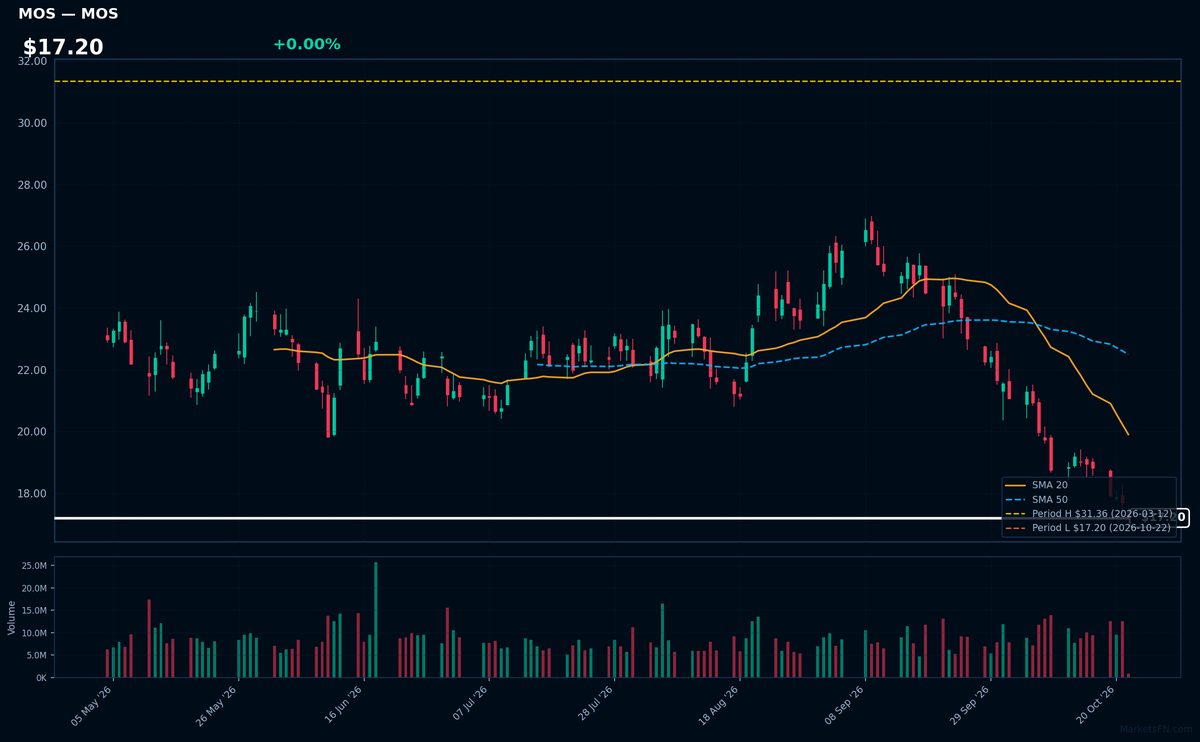
MOS | Mosaic Company | Basic Materials | Price Last: $17.20 | % Realized: -41.99% | RSI: 19.8 | % above MA200: -28.7% | Trend: Below MA20, MA50, MA200
Mosaic Company produces concentrated phosphate and potash crop nutrients for global agriculture. Investors watch MOS as a pure-play fertilizer stock with direct exposure to farm input demand cycles and crop price trends.
Extreme technical weakness: RSI(14) at 19.8 signals oversold conditions amid bearish MA alignment (price < MA20 < MA50 < MA200). Testing 52-week lows after -42.0% decline warns of persistent downtrend.
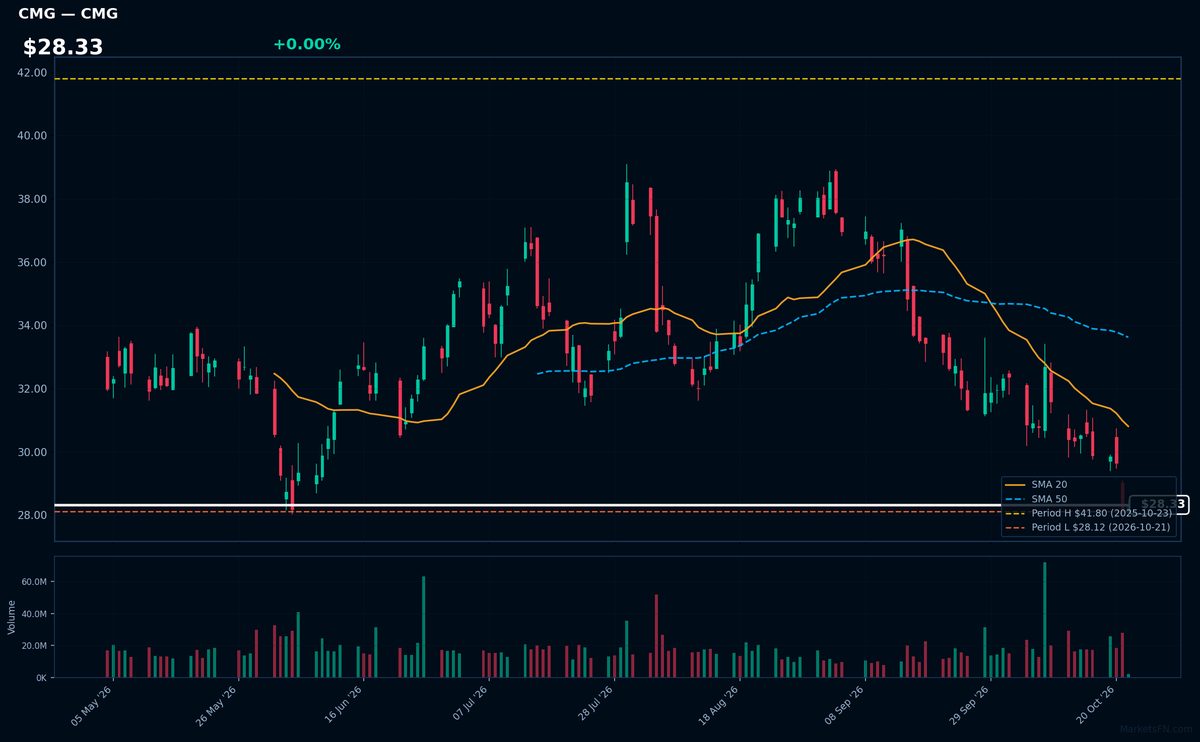
CMG | Chipotle Mexican Grill | Consumer Cyclical | Price Last: $28.33 | % Realized: -31.92% | RSI: 28.8 | % above MA200: -17.6% | Trend: Below MA20, MA50, MA200
Chipotle Mexican Grill operates fast-casual Mexican restaurants emphasizing fresh ingredients and customizable meals. Investors care due to its strong brand loyalty, unit economics, and growth potential in digital sales and new markets.
Technically concerning: RSI(14) at 28.8 (nearing oversold) with bearish MA alignment (price < MA20 < MA50 < MA200). Down 31.9% YTD, just 0.7% above 52-week lows—testing critical support.
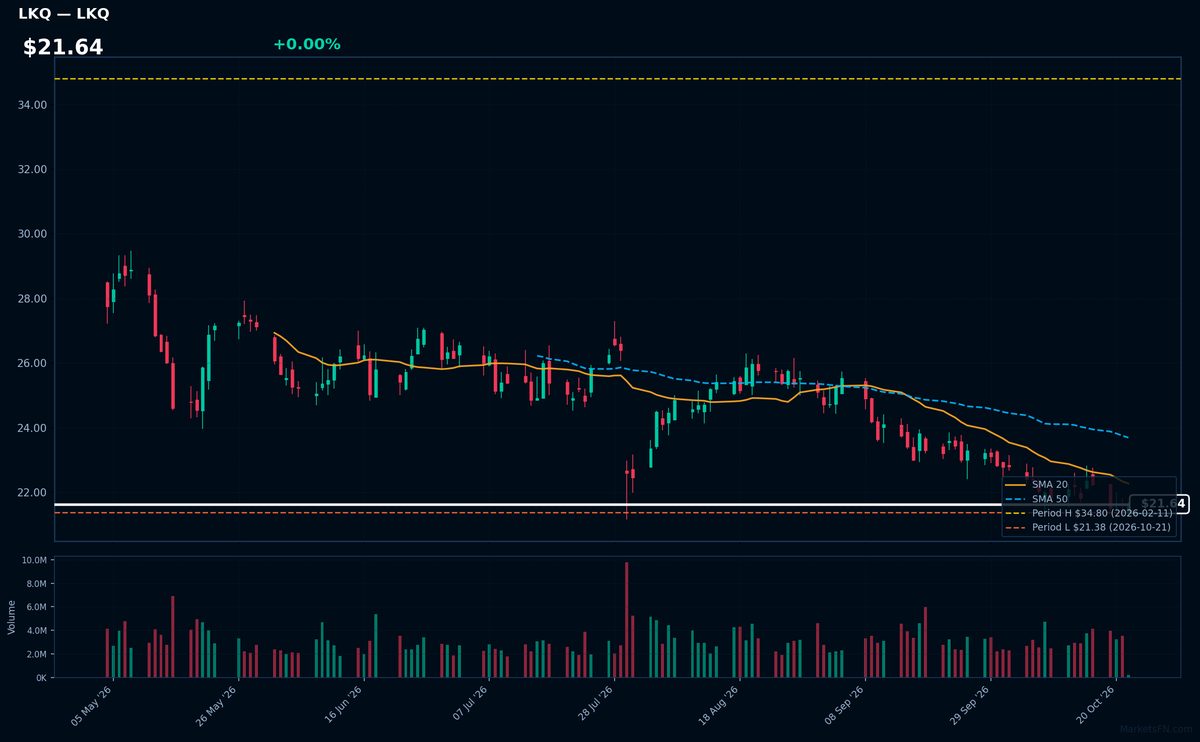
LKQ | LKQ Corp | Consumer Cyclical | Price Last: $21.64 | % Realized: -28.71% | RSI: 37.0 | % above MA200: -21.7% | Trend: Below MA20, MA50, MA200
LKQ Corp is a leading distributor of vehicle replacement parts, serving collision and mechanical repair markets. Investors should care because its aftermarket parts business thrives when consumers delay new car purchases during economic uncertainty, creating countercyclical demand.
LKQ shows severe technical weakness: RSI(14) at 37.0 confirms bearish momentum, with sustained downtrend (price < MA20 < MA50 < MA200). Trading just 1.2% above 52-week lows after -28.7% annual decline signals critical support test—clear warning sign.
Market Commentary
The concentration of blue-chip stocks like Apple (AAPL), Berkshire Hathaway (BRK-B), and Visa (V) at 52-week highs signals persistent investor confidence in quality cash flow generators and defensive growth names. Conversely, stocks like First Solar (FSLR) and Mosaic (MOS) hovering near 52-week lows reflect sector-specific headwinds, particularly in renewables and commodities. Such extremes often indicate market bifurcation between secular winners and cyclical or rate-sensitive laggards.
Sector rotation appears tilted toward financial services (V, MA) and healthcare (LLY), benefiting from stable demand and pricing power, while clean energy (FSLR) and agriculture (MOS) face pressure from oversupply and policy uncertainty. The dominance of payment processors and defensive giants suggests a "flight to safety" amid macroeconomic uncertainty, with investors favoring recurring revenue models over cyclical exposures.
Key levels to monitor include AAPL's $200 psychological resistance and FSLR's $140 support, a breakdown of which could accelerate downside momentum. Catalysts for reversal in laggards may include Fed rate cuts or commodity price rebounds, while extended highs could face profit-taking if earnings disappoint. Paramount (PSKY) and Chipotle (CMG) merit watch for mean-reversion potential given their atypical positioning near lows.
Methodology: All 503 S&P 500 constituents screened. 52-week high = highest daily close over the past 252 trading days (approx. 1 year). 52-week low = lowest daily close over the same period. Distance = (current price / extreme − 1) × 100. Technical indicators computed on up to 1 year of daily OHLCV data.
Disclaimer: For informational purposes only. Not investment advice. Past performance is not indicative of future results.