Nasdaq 100 52-Week Highs & Lows Radar: Apple (AAPL), Netflix (NFLX) and more
MarketsFN Team

Screening all 101 Nasdaq 100 constituents for stocks nearest to their 52-week high and their 52-week low. Data as of October 22, 2026. % Realized = 52-week total return.
Legend: RSI > 70 = overbought · RSI < 30 = oversold · Green % Realized = positive 52W return · Red = negative.
📈 Nearest to 52-Week High
Sectors represented: Technology (3), Healthcare (1), Industrials (1)
| Ticker | Company | Sector | Price Last | % Realized | 52-Week High Date | RSI | % above MA200 | Trend |
|---|---|---|---|---|---|---|---|---|
| AAPL | Apple Inc | Technology | $345.85 | +33.82% | 2026-10-22 | 62.6 | +17.7% | Above MA20, MA50, MA200 |
| AMGN | AMGEN Inc | Healthcare | $447.09 | +51.05% | 2026-10-22 | 66.5 | +20.5% | Above MA20, MA50, MA200 |
| ADP | Automatic Data Processing Inc | Technology | $299.34 | +5.42% | 2026-10-22 | 76.1 | +25.1% | Above MA20, MA50, MA200 |
| CTAS | Cintas Corporation | Industrials | $221.82 | +14.61% | 2026-10-22 | 76.9 | +17.1% | Above MA20, MA50, MA200 |
| TEAM | Atlassian Corporation | Technology | $226.78 | +35.08% | 2026-10-22 | 70.1 | +96.0% | Above MA20, MA50, MA200 |
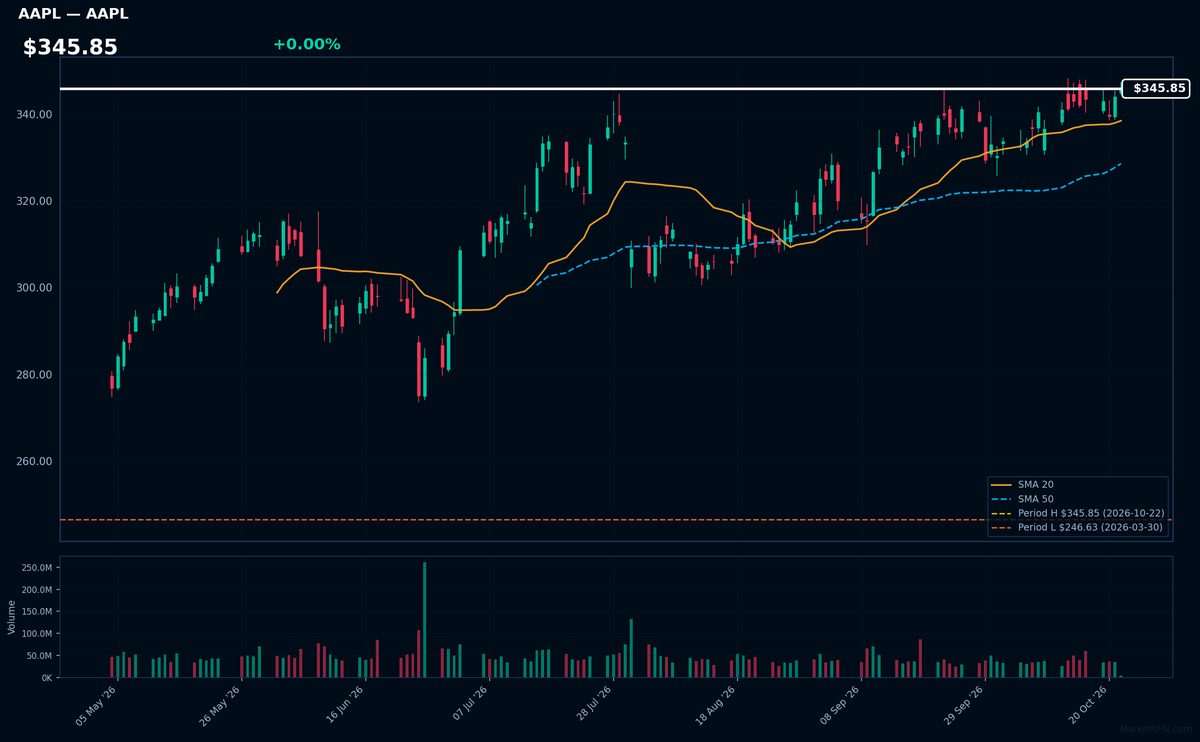
AAPL | Apple Inc | Technology | Price Last: $345.85 | % Realized: +33.82% | RSI: 62.6 | % above MA200: +17.7% | Trend: Above MA20, MA50, MA200
Apple Inc designs premium consumer electronics (iPhone, Mac), operates services (App Store, iCloud), and leads wearables (AirPods, Watch). Investors care about its ecosystem lock-in, pricing power, and $345B cash reserves for R&D/dividends.
Technically bullish: $345.85 price shows 33.8% 52W return, RSI(14) at 62.6 (neutral), with MA20>MA50>MA200 confirming uptrend. At 0.0% below 52W high, watch for breakout confirmation.
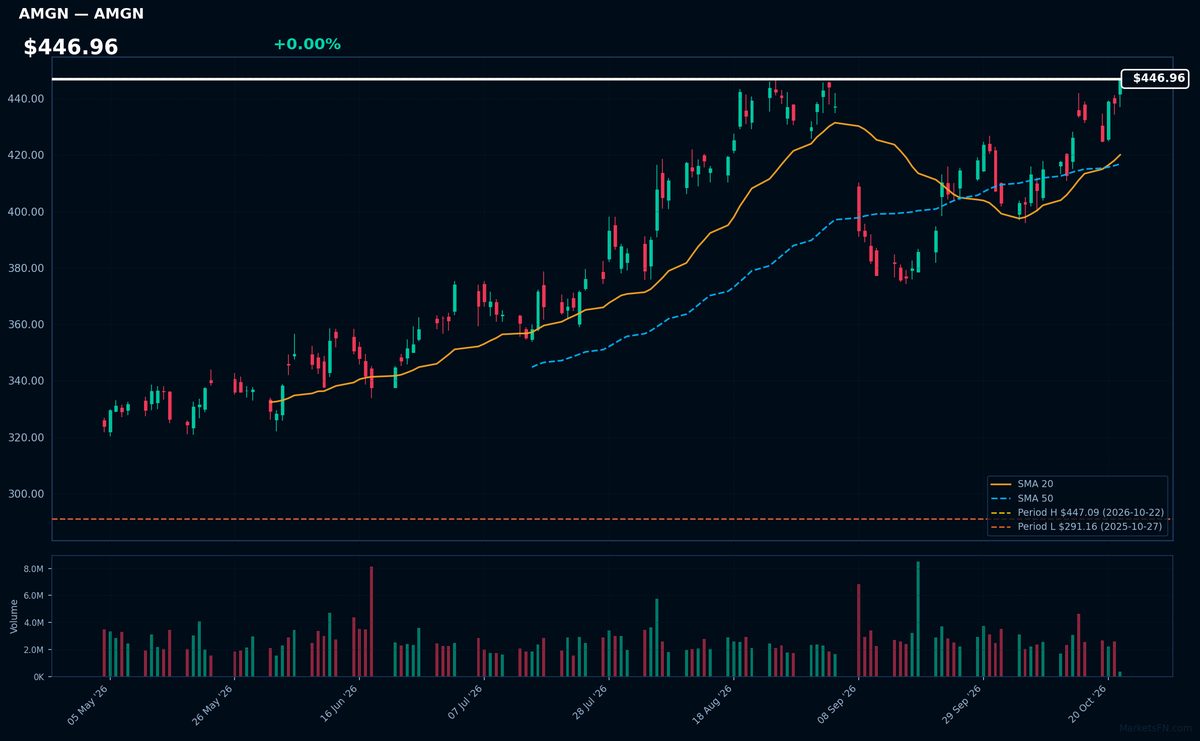
AMGN | AMGEN Inc | Healthcare | Price Last: $447.09 | % Realized: +51.05% | RSI: 66.5 | % above MA200: +20.5% | Trend: Above MA20, MA50, MA200
Amgen develops biologic medicines for serious illnesses, including top-selling autoimmune drug Enbrel and cholesterol fighter Repatha. Investors care because its $18B annual revenue hinges on patent-protected biologics with high margins, plus a promising obesity drug pipeline challenging Novo Nordisk.
AMGN shows strong momentum with bullish MA alignment (price > MA20 > MA50 > MA200) and RSI(14) at 66.5, nearing overbought territory. At 0.0% below 52-week highs after a 51.1% yearly gain, this suggests continuation potential but warrants caution for pullback risks.
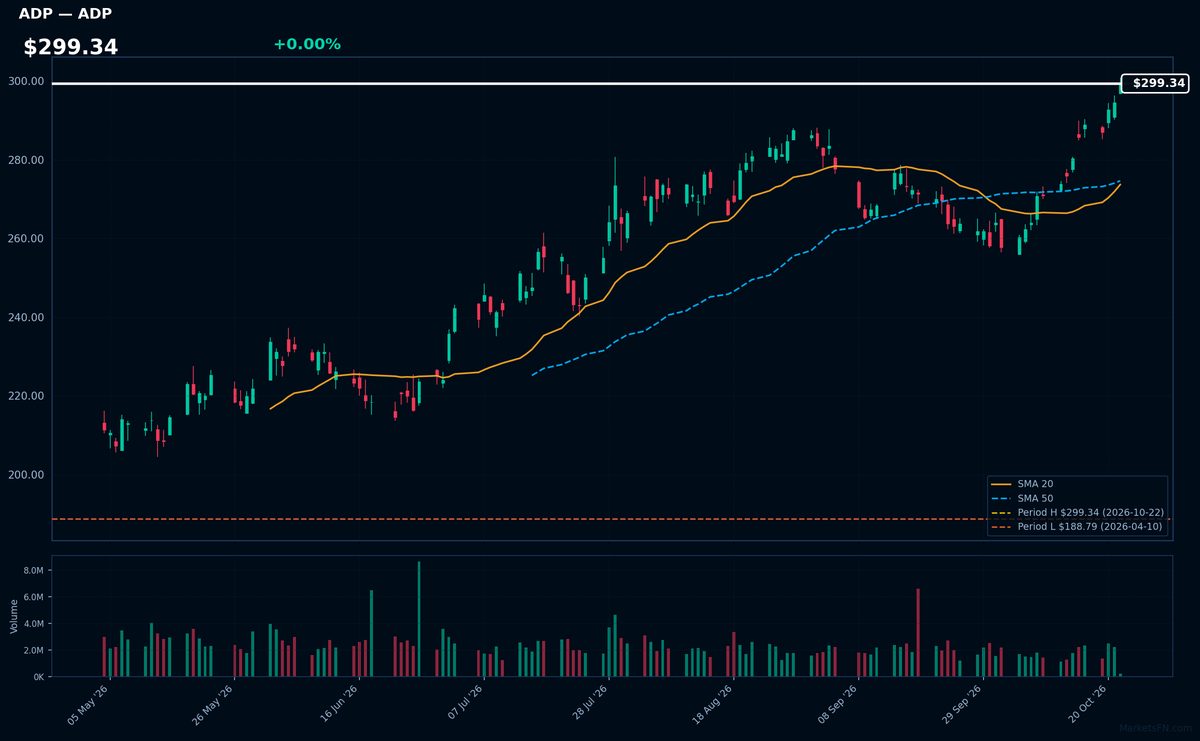
ADP | Automatic Data Processing Inc | Technology | Price Last: $299.34 | % Realized: +5.42% | RSI: 76.1 | % above MA200: +25.1% | Trend: Above MA20, MA50, MA200
Automatic Data Processing Inc (ADP) provides cloud-based payroll and HR solutions to businesses globally. Investors should care because its recurring revenue model and mission-critical services drive stable cash flows, with 5.4% annual return showing resilience in economic cycles.
Technically, ADP trades at $299.34 (0.0% below 52-week high) with overbought RSI(14) of 76.1 and mixed MA alignment (above MA20/MA50/MA200). This suggests extended momentum near resistance, warranting caution despite the breakout proximity.
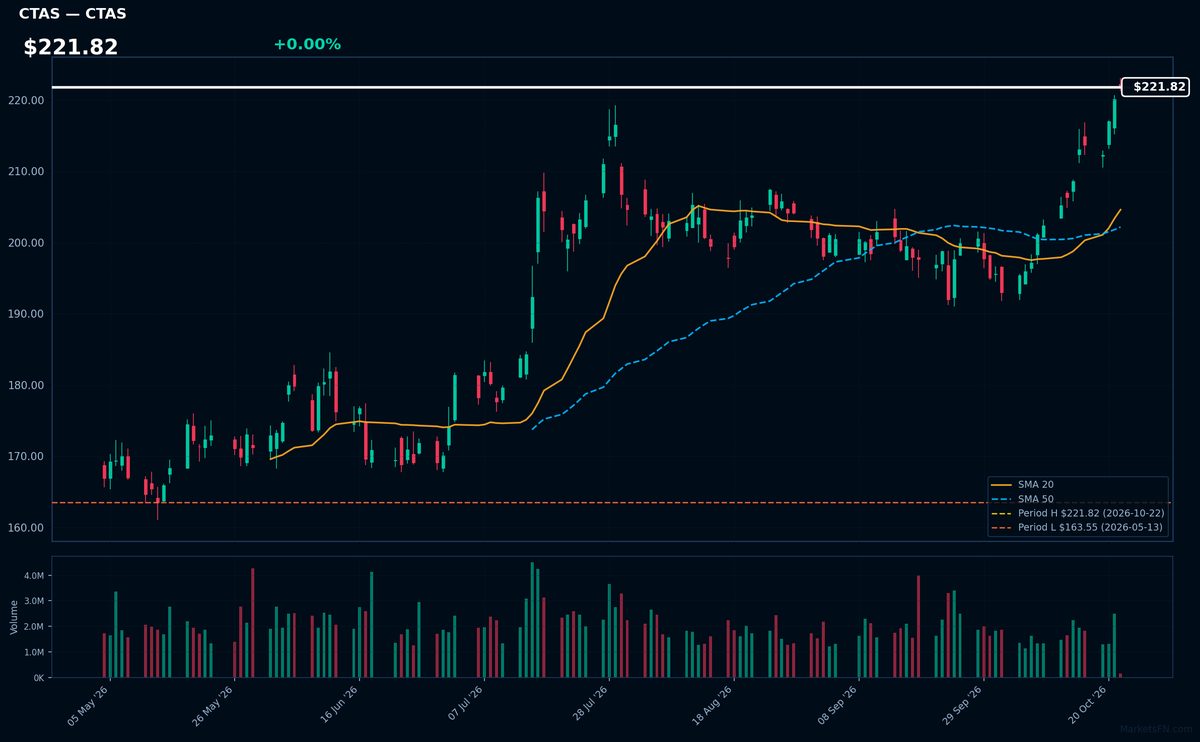
CTAS | Cintas Corporation | Industrials | Price Last: $221.82 | % Realized: +14.61% | RSI: 76.9 | % above MA200: +17.1% | Trend: Above MA20, MA50, MA200
Cintas provides corporate identity uniforms and business services (restroom supplies, first aid, safety products) to over 1 million businesses. Investors care because its recurring revenue model and essential services provide stability during economic cycles.
CTAS shows strong momentum with bullish MA alignment (price>MA20>MA50>MA200) and overbought RSI(76.9). At 52-week highs (+14.6%), this signals extended uptrend but warrants caution near resistance.
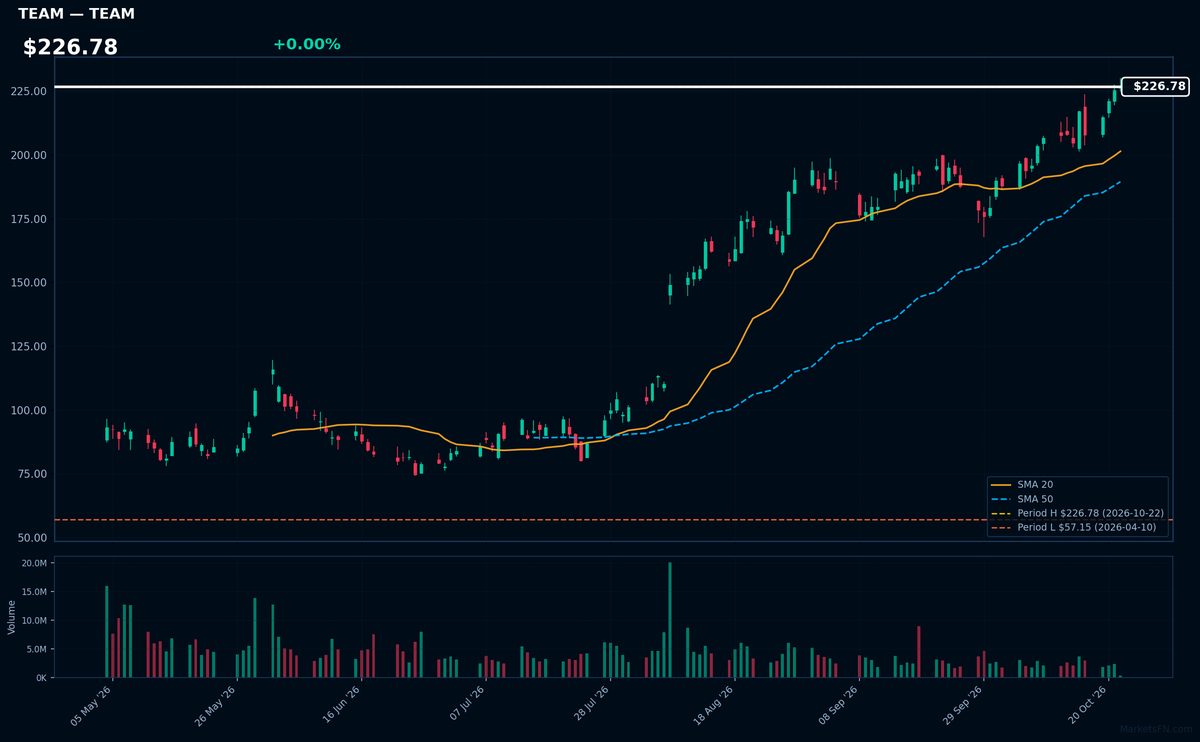
TEAM | Atlassian Corporation | Technology | Price Last: $226.78 | % Realized: +35.08% | RSI: 70.1 | % above MA200: +96.0% | Trend: Above MA20, MA50, MA200
Atlassian provides collaboration software (Jira, Confluence) for agile development teams. Investors should care because its tools are mission-critical for software developers globally, creating sticky enterprise subscriptions with 35.1% annual returns demonstrating adoption.
Technically overbought (RSI 70.1) but in strong uptrend (price > MA20 > MA50 > MA200). At 52-week highs, this signals momentum but warrants caution near resistance.
📉 Nearest to 52-Week Low
Sectors represented: Communication Services (3), Industrials (1), Consumer Cyclical (1)
| Ticker | Company | Sector | Price Last | % Realized | 52-Week Low Date | RSI | % above MA200 | Trend |
|---|---|---|---|---|---|---|---|---|
| NFLX | Netflix Inc | Communication Services | $65.99 | -40.89% | 2026-10-21 | 36.0 | -19.9% | Below MA20, MA50, MA200 |
| APP | Applovin Corp | Communication Services | $269.55 | -52.28% | 2026-10-14 | 39.8 | -36.9% | Below MA20, MA50, MA200 |
| TMUS | T-Mobile US Inc | Communication Services | $157.59 | -30.70% | 2026-10-09 | 44.0 | -16.3% | Below MA20, MA50, MA200 |
| HON | Honeywell International Inc | Industrials | $210.22 | +2.93% | 2025-11-20 | 47.9 | -8.8% | Below MA20, MA50, MA200 |
| BKNG | Booking Holdings Inc | Consumer Cyclical | $164.41 | -21.42% | 2026-05-15 | 48.4 | -8.0% | Above MA20 · Below MA50, MA200 |
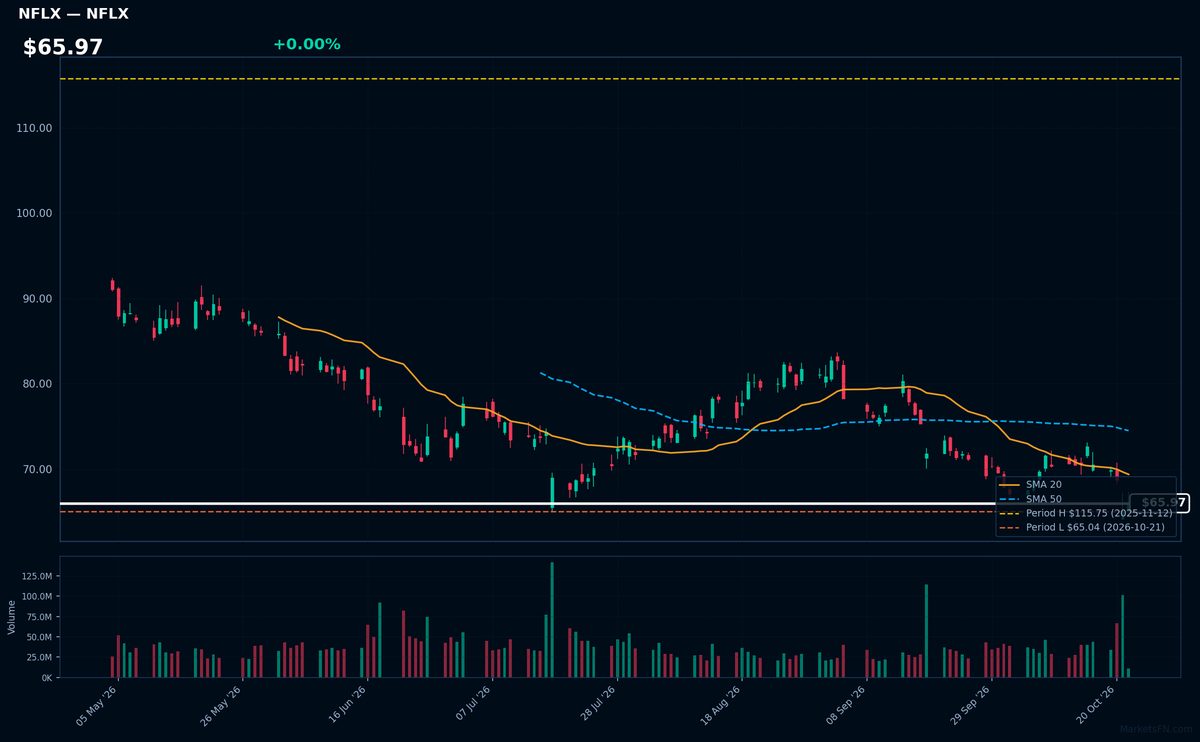
NFLX | Netflix Inc | Communication Services | Price Last: $65.99 | % Realized: -40.89% | RSI: 36.0 | % above MA200: -19.9% | Trend: Below MA20, MA50, MA200
Netflix Inc dominates global streaming with 220M+ subscribers, pioneering original content while facing intensifying competition. Investors watch its ability to maintain pricing power and subscriber growth amid economic pressures that may curb discretionary spending.
NFLX shows severe technical weakness: RSI(14) at 36.0 signals near-oversold conditions amid a sustained downtrend (price < MA20 < MA50 < MA200). Trading just 1.5% above 52-week lows after a -40.9% annual plunge, this tests critical support — a clear warning sign absent fundamental catalysts.
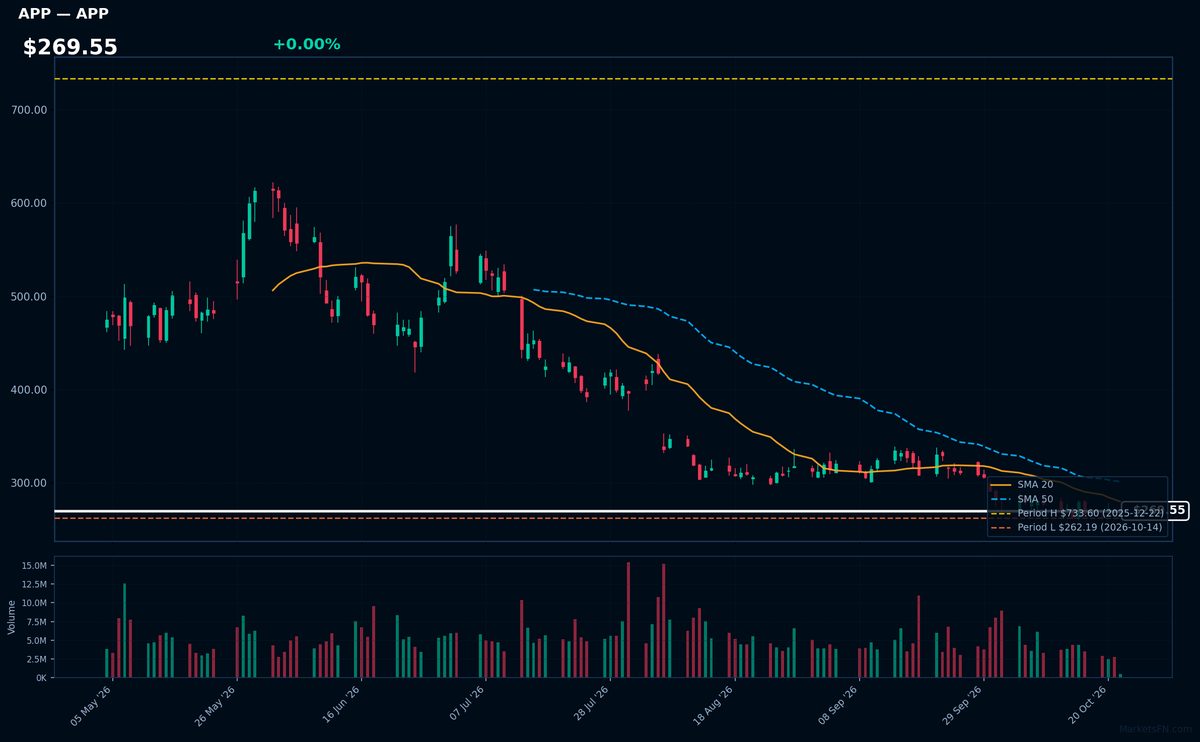
APP | Applovin Corp | Communication Services | Price Last: $269.55 | % Realized: -52.28% | RSI: 39.8 | % above MA200: -36.9% | Trend: Below MA20, MA50, MA200
Applovin operates a mobile app technology platform that helps developers monetize and grow their apps through advertising and analytics tools. Investors watch it as a proxy for mobile ad spending trends and app economy health.
Severe technical deterioration: RSI(14) at 39.8 shows weakening momentum, while bearish MA alignment (price < MA20 < MA50 < MA200) and -52.3% annual return signal sustained downtrend. Trading just 2.8% above 52-week lows suggests critical support test ahead.
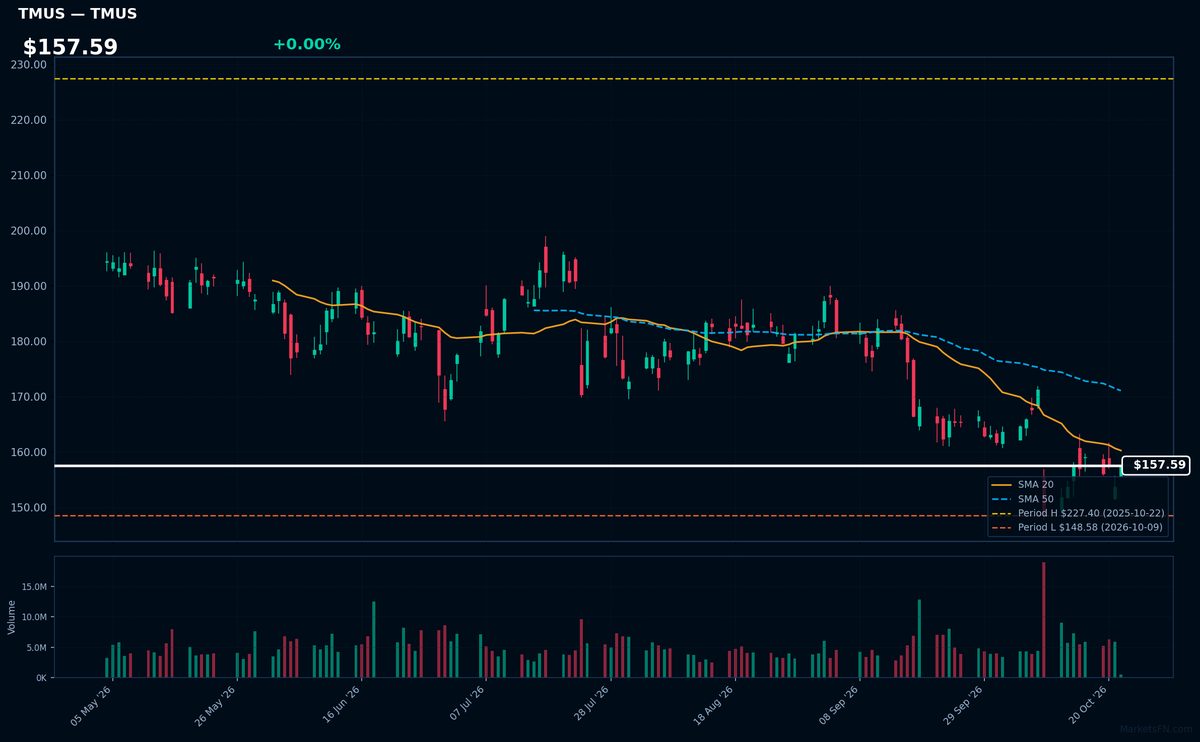
TMUS | T-Mobile US Inc | Communication Services | Price Last: $157.59 | % Realized: -30.70% | RSI: 44.0 | % above MA200: -16.3% | Trend: Below MA20, MA50, MA200
T-Mobile US Inc operates as a major wireless carrier, providing mobile communications services to consumers and businesses. Investors should monitor its competitive positioning in 5G rollout and market share battles against Verizon and AT&T, as these factors directly impact revenue growth in the concentrated US telecom sector.
TMUS shows concerning technical weakness: RSI(14) at 44.0 reflects neutral-to-weak momentum, while the sustained bearish MA alignment (price below MA20/50/200) and -30.7% 52-week return suggest entrenched selling pressure. Trading just 6.1% above 52-week lows, the stock tests critical support with no visible reversal signals.
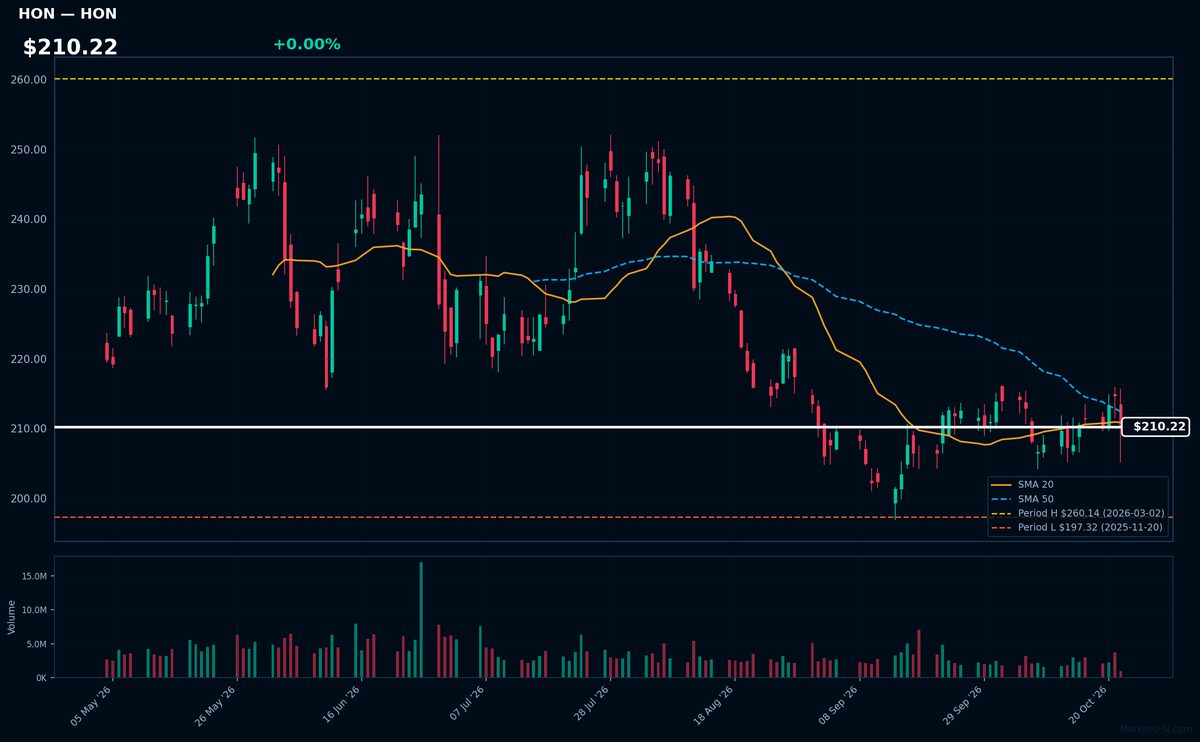
HON | Honeywell International Inc | Industrials | Price Last: $210.22 | % Realized: +2.93% | RSI: 47.9 | % above MA200: -8.8% | Trend: Below MA20, MA50, MA200
Honeywell International Inc (HON) operates in aerospace, building technologies, performance materials, and safety solutions. Investors should note its diversified industrial exposure, particularly in high-margin automation and safety products, serving critical infrastructure and defense sectors.
Technically, HON shows weakness with RSI(14) at 47.9 and a sustained downtrend (price < MA20 < MA50 < MA200). Trading just 6.5% above its 52-week low, it tests major support—a warning sign despite the modest 2.9% annual return.
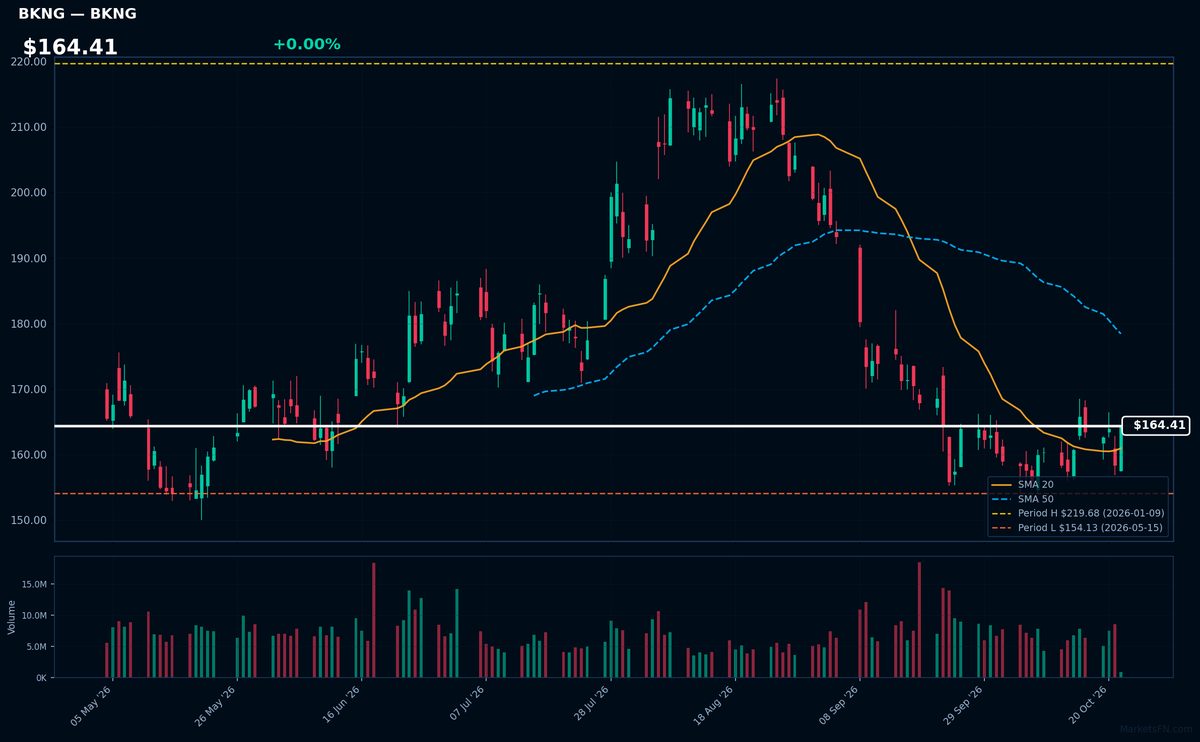
BKNG | Booking Holdings Inc | Consumer Cyclical | Price Last: $164.41 | % Realized: -21.42% | RSI: 48.4 | % above MA200: -8.0% | Trend: Above MA20 · Below MA50, MA200
Booking Holdings operates leading online travel platforms (Booking.com, Priceline, Kayak) connecting travelers with lodging/transportation. Investors care due to its global scale in the $1.4T travel market, capital-light model, and pricing power as the dominant OTA.
Technically mixed: RSI 48.4 shows neutral momentum, but trading below MA50/MA200 (-21.4% YoY) and just 6.7% above 52-week lows signals weakness. Monitor support break risk.
Market Commentary
The clustering of Nasdaq 100 stocks at 52-week extremes reflects divergent sector momentum and selective risk appetite. Apple (AAPL), Amgen (AMGN), and Cintas (CTAS) trading at highs suggests defensive rotation into cash-rich megacaps and stable corporate services, while Atlassian (TEAM) highlights persistent demand for cloud collaboration tools. Conversely, Netflix (NFLX) and AppLovin (APP) lingering near lows indicates streaming saturation and ad-tech volatility, with Booking (BKNG) and Honeywell (HON) facing cyclical pressures despite solid fundamentals.
Macro drivers include elevated rates punishing long-duration tech, with high-quality cash flows (AAPL, ADP) benefiting from "flight to safety." AMGN's resilience underscores biotech's defensive appeal, while TMUS's weakness contradicts telecom's typical stability—possibly reflecting growth concerns. Software names like TEAM defy sector headwinds due to mission-critical products, whereas consumer discretionary (NFLX, BKNG) struggles with demand uncertainty.
Key levels to monitor are AAPL's $193.97 and AMGN's $278.38 (current 52W highs) for confirmation of breakout momentum. For near-lows, NFLX holding $362.00 (1.5% above 52W low) is critical; a breakdown could trigger algorithmic selling. Upcoming earnings (APP on May 8) and Fed policy shifts may serve as catalysts. Any dovish pivot could lift beaten-down growth (APP, TMUS), while prolonged tightness may extend bifurcation.
Methodology: All 101 Nasdaq 100 constituents screened. 52-week high = highest daily close over the past 252 trading days (approx. 1 year). 52-week low = lowest daily close over the same period. Distance = (current price / extreme − 1) × 100. Technical indicators computed on up to 1 year of daily OHLCV data.
Disclaimer: For informational purposes only. Not investment advice. Past performance is not indicative of future results.