Ripple Eyes Recovery as RSI Nears Oversold at $1.2864
QuoteReporter
•2 min read
Ripple Eyes Recovery as RSI Nears Oversold at $1.2864
Ripple (XRP/USD) | September 16, 2026 $1.2864 +0.13%
🔍 Technical Analysis
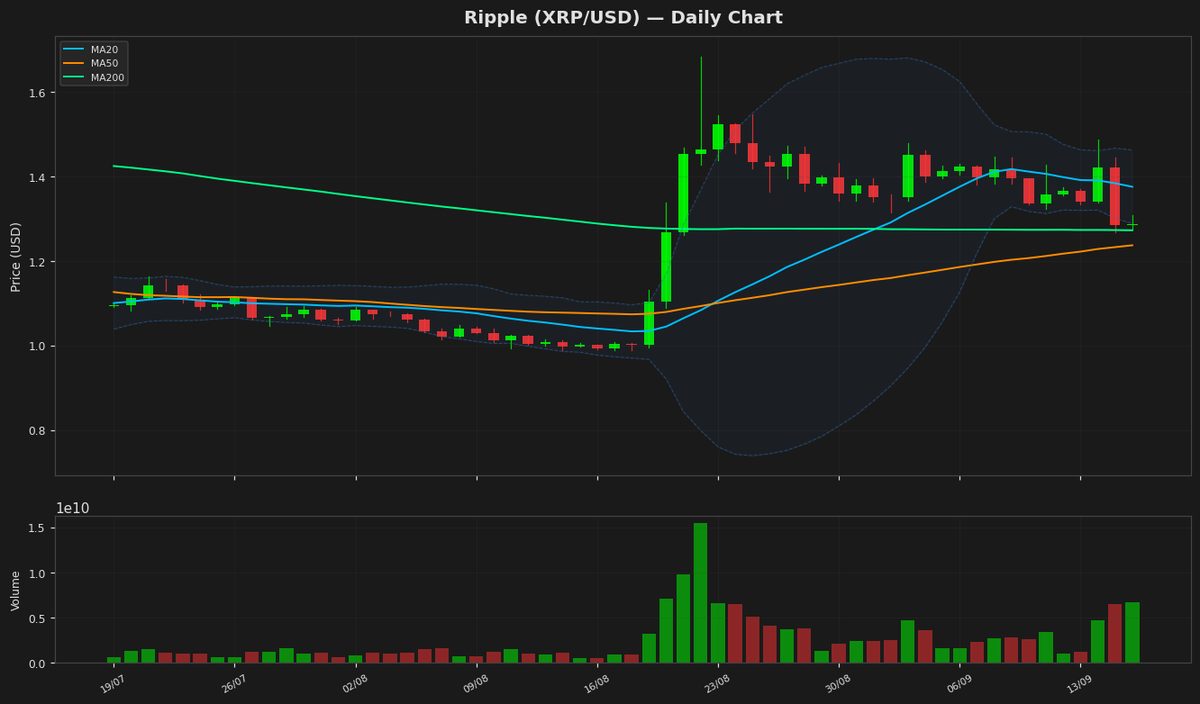
Ripple (XRP) is currently trading at $1.286400, showing a marginal daily gain of 0.13%. The price remains below the 20-day moving average (MA20) at $1.375234, indicating short-term bearish pressure, while hovering above the 50-day moving average (MA50) at $1.236783, suggesting intermediate support. The 200-day moving average (MA200) at $1.272317 is nearly aligned with the current price, reflecting a neutral long-term trend. Bollinger Bands show the upper band at $1.462251 and the lower band at $1.288218, with the price near the lower band, signaling potential oversold conditions. The Relative Strength Index (RSI) at 44.512865 is below the neutral 50 level, indicating weakening momentum but not yet in oversold territory. The MACD line at 0.016819 is below the signal line at 0.03867, reinforcing bearish sentiment in the near term. Key support levels are seen at the MA50 ($1.236783) and the 52-week low ($0.98842198), while resistance lies at the MA20 ($1.375234) and the upper Bollinger Band ($1.462251). The ATR(14) at 0.072614 suggests moderate volatility. Given the mixed signals, XRP may consolidate between $1.236783 and $1.375234 until a clearer trend emerges.
Technical Metrics
| Metric | Value |
|---|---|
| Current Price | $1.2864 |
| Daily Change | +0.13% |
| MA 20 | $1.3752 |
| % from MA20 | -6.46% |
| MA 50 | $1.2368 |
| % from MA50 | +4.01% |
| MA 200 | $1.2723 |
| % from MA200 | +1.11% |
| BB Upper | $1.4623 |
| % from BB Upper | -12.03% |
| BB Lower | $1.2882 |
| % from BB Lower | -0.14% |
| RSI (14) | 44.51 |
| MACD | 0.016819 |
| MACD Signal | 0.038670 |
| ATR (14) | 0.072614 |
| 3-Day High | $1.4871 |
| 3-Day Low | $1.2669 |
| 52-Week High | $2.1864 |
| % from 52W High | -41.16% |
| 52-Week Low | $0.9884 |
| % from 52W Low | +30.15% |
| YTD High | $2.4103 |
| % from YTD High | -46.63% |
| YTD Low | $0.9884 |
| % from YTD Low | +30.15% |
📊 Market Commentary
Ripple (XRP) is trading at $1.2864, up 0.13% today, as the broader cryptocurrency market shows mixed sentiment. The Relative Strength Index (RSI) at 44.5 suggests XRP is neither overbought nor oversold, hovering near neutral territory. Over the past 52 weeks, XRP has fluctuated between $0.9884 and $2.1864, reflecting significant volatility amid regulatory developments and shifting market dynamics.
Market sentiment around XRP remains cautious but stable, with traders closely monitoring key support and resistance levels. The $1.25 level has acted as near-term support, while $1.35 is seen as the next resistance to watch. A sustained move above $1.35 could signal renewed bullish interest, though trading volumes remain subdued compared to recent peaks. Regulatory clarity continues to influence XRP’s price action, particularly as the SEC case against Ripple progresses, with traders awaiting further updates.
Institutional interest and adoption of Ripple’s payment solutions provide a fundamental backdrop, but macroeconomic factors, including Fed policy and Bitcoin’s performance, also weigh on XRP’s short-term trajectory. Traders are observing whether XRP can hold above its 200-day moving average, currently near $1.20, as a breakdown could invite further downside pressure. For now, the asset appears range-bound, with neither bulls nor bears asserting clear dominance.
Market sentiment around XRP remains cautious but stable, with traders closely monitoring key support and resistance levels. The $1.25 level has acted as near-term support, while $1.35 is seen as the next resistance to watch. A sustained move above $1.35 could signal renewed bullish interest, though trading volumes remain subdued compared to recent peaks. Regulatory clarity continues to influence XRP’s price action, particularly as the SEC case against Ripple progresses, with traders awaiting further updates.
Institutional interest and adoption of Ripple’s payment solutions provide a fundamental backdrop, but macroeconomic factors, including Fed policy and Bitcoin’s performance, also weigh on XRP’s short-term trajectory. Traders are observing whether XRP can hold above its 200-day moving average, currently near $1.20, as a breakdown could invite further downside pressure. For now, the asset appears range-bound, with neither bulls nor bears asserting clear dominance.
Disclaimer
The content on MarketsFN.com is provided for educational and informational purposes only. It does not constitute financial advice or investment recommendations. All investments involve risk. Cryptocurrency markets are highly volatile. Past performance does not guarantee future results.