NZD/USD: Up 0.06% to 0.5685 — Price Holds Above SMA-20
MarketsFN Team
NZD/USD: Up 0.06% to 0.5685 — Price Holds Above SMA-20
Published: October 21, 2026 · MarketsFN Team
| Pair | Rate | Change | RSI(14) | SMA-20 | SMA-50 | 52W High | 52W Low | Pivot | R1 | S1 |
|---|---|---|---|---|---|---|---|---|---|---|
| NZD/USD | 0.5685 | +0.06% | 59.8 | 0.5631 | 0.5769 | 0.5982 | 0.5587 | 0.5676 | 0.5688 | 0.5653 |
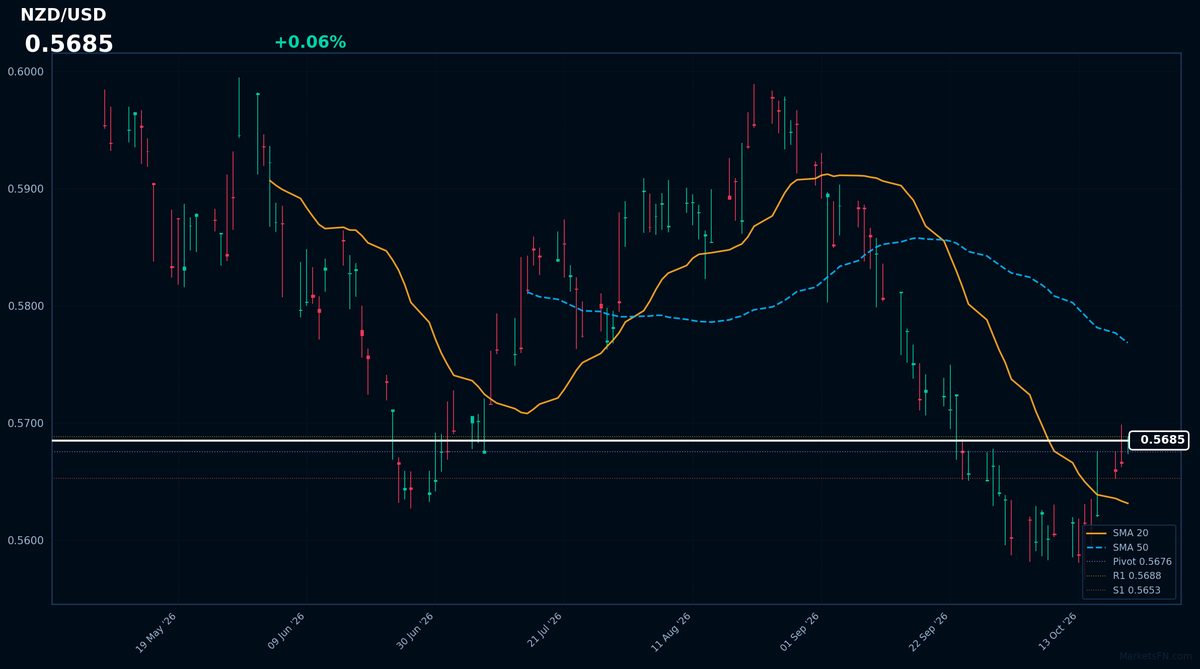
NZD/USD is trading at 0.5685 (+0.06%) as the European session is underway, showing a modest gain from the previous close of 0.5682. The current rate is within its day range of 0.5674 to 0.5688, indicating a relatively contained price move. Over the past 52 weeks, NZD/USD has traded between 0.5587 and 0.5982, with the current level near the lower end of this range.
The technical picture suggests a consolidation phase, as the rate is above the 20-day simple moving average (SMA-20) of 0.5631 but below the SMA-50 of 0.5769. The Relative Strength Index (RSI) at 59.8 is in neutral territory, not indicating overbought or oversold conditions. The Average True Range (ATR) of 0.0042 reflects the current daily volatility.
Key levels to watch include the pivot at 0.5676, with resistance at R1: 0.5688 and support at S1: 0.5653. The rate is currently testing the R1 level, having reached a high of 0.5688 earlier in the session. A break above this resistance could signal further upside, while a drop below the S1 support at 0.5653 may indicate a continuation of the downside.
Given the current technical setup, a break above 0.5688 or below 0.5653 will likely dictate the near-term direction. The upcoming US economic data releases may serve as a catalyst to confirm or invalidate the current consolidation phase.
Disclaimer
The content on MarketsFN.com is provided for educational and informational purposes only. It does not constitute financial advice or investment recommendations. All investments involve risks and past performance does not guarantee future results. You are solely responsible for your investment decisions.